

Executive Summary
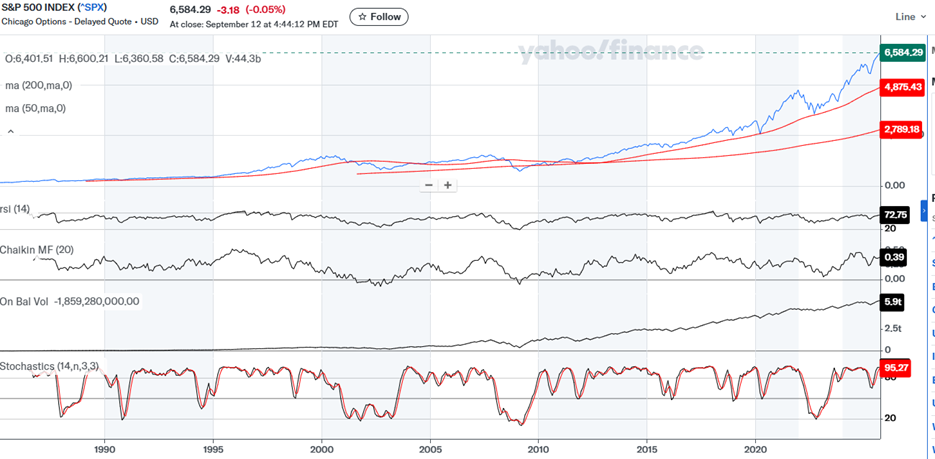
- The S&P 500 rose 1.6% last week to finish at 6,584.3
- The stock market rises long-term due to earnings growth and interest rates
- A stock is ownership in a business
- Investors are willing to pay more for a dollar’s worth of earnings today than in the past
- Profit margins are already near record highs
- The Volatility Index (VIX) closed the week at 14.76
- The market is setting new highs
- The CME FedWatch tool places the odds at 100% for a rate cut Wednesday
- The August jobs report and last week’s jobs revision are driving rate cut expectations
- Cutting the fed funds rate isn’t the answer to slower job growth
- Higher long-term rates will negate any benefit from a rate cut
The Stock Market

S&P 500 5-Day Chart
The S&P 500 rose 1.6% last week to finish at 6,584.3. It is up 11.95% year-to-date. It is up 17.67% over the trailing 12 months. The S&P 500 has returned 97.08% over the trailing 5 years. The communication services sector is up 21.22% year-to-date. It leads all other sectors. Warner Bros. Discovery is the top-performing stock in the communications sector with a return of 78.52%. Seagate is the top-performing stock in the S&P, having returned 127.08% year-to-date.
The stock market rises long-term due to earnings growth and interest rates. A stock is worth all future earnings discounted to the present. The higher the interest rate, the lower the current value of future earnings. The lower the interest rate, the higher the current value of future earnings. That fact is why growth stocks have outperformed for most of the last 15 years. A low interest rate means a higher present value for all future earnings. Growth stocks get a higher present value in other words.
A stock is ownership in a business. Owners are entitled to their share of earnings. An owner will earn the earnings yield (price-to-earnings inverted) and earnings growth summed. There is a caveat: the amount an investor is willing to pay for each dollar of earnings doesn’t change.
An example: A stock is trading for 15 times earnings (6.7% earnings yield). The company is growing its earnings at 4% per year. Mathematically, the owner will have a return of 10.7% per year if the price-to-earnings ratio doesn’t change. The S&P 500 earned $208.1 in 2021. It is expected to earn $304.60 in 2026. Earnings growth over the five years would be 46.4%, or approximately 9.3% per year. Again, the S&P 500 is up 97.08% over the last five years. Prices have run well ahead of earnings.
The S&P is trading at 21.6 times 2026 earnings as a result. The S&P has historically traded at around 17 times 12-month forward earnings. Investors are willing to pay more for a dollar’s worth of earnings today than over the long run. It's unlikely that investors value a dollar's worth of earnings today more than thirty years ago. It's more likely that investors believe earnings will grow faster than they have over the last 250 years. The consensus earnings forecast is for 13.8% earnings growth in 2026. For reference, yearly earnings growth beginning in 2022 was 4.8%, 1.5%, 9.7%, and (estimated) 10.3%.
Earnings growth of 13.8% in 2026 appears to be a reach. Profit margins are already near record highs.
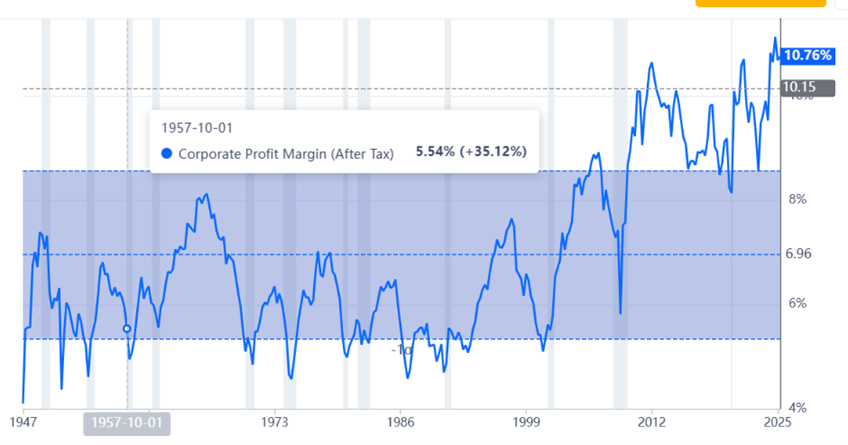
Higher earnings growth requires higher revenue growth if margins don't expand. Higher nominal revenue growth requires higher nominal GDP growth. Real GDP growth is slowing from last year’s 2.8%. Trend growth appears to be around 1.6% in 2025. Add 3% for inflation, and nominal GDP growth only reaches 4.6%. Growing earnings by 13.8% next year with nominal GDP growth of 4.6% is unlikely without margin expansion. (Take another look at the above chart)
The Volatility Index (VIX) closed the week at 14.76.
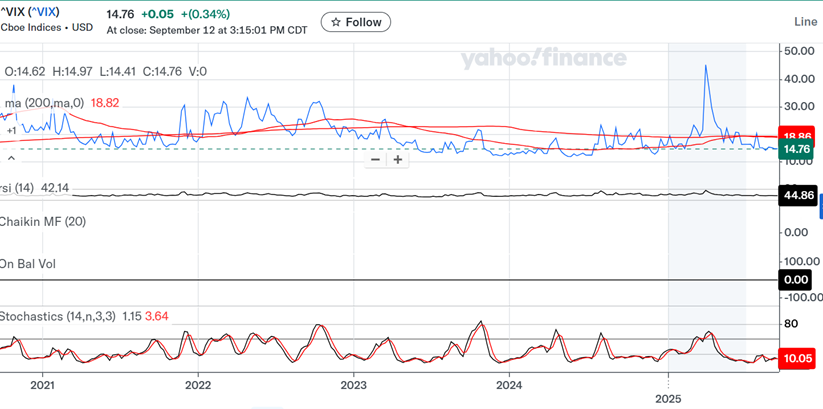
The VIX is a widely followed gauge of market fear and uncertainty. Any reading below 20 indicates a benign 30-day outlook for volatility. A low VIX is associated with a rising market and investor confidence. A VIX below 15 is uncommon and smacks of complacency.
The market is setting new highs. Its earnings yield is a paltry 4.6% based on 2026 earnings. Investor confidence is high, and earnings growth expectations are robust. The Fed is cutting rates on Wednesday. The only question is how much? The CME FedWatch tool places the odds at 100% for a rate cut, including a 6.6% chance of a 0.50% cut. The Futures market is expecting a quarter-point cut in October and December as well. That would drop the Fed funds rate to 3.50%-3.75. Futures traders have priced in a total of six quarter-point cuts by year-end 2026. The funds rate would sit at 2.75%-3% after six cuts. The futures market appears to be expecting a recession. Yet earnings are still expected to grow by 13.8% in 2026. Something doesn't add up.
The August jobs report and last week’s jobs revision are driving rate cut expectations. The August jobs report showed 22,000 new jobs created, well below the 75,000 forecast. It was the lowest jobs gain since late 2020. The jobs revision that came out last week was also a shock. The Bureau of Labor Statistics (BLS) revised away 911,000 jobs for the 12 months ended March 2025.
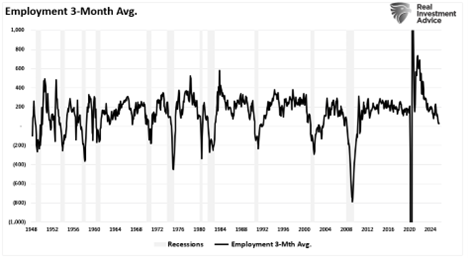
Hiring has been far weaker than thought. Yet the jobless rate is only 4.3%. That is below the 4.5% projected by the FOMC for the end of 2025 and 2026. It is close to the Fed’s neutral unemployment rate of 4.5%. What economists worry about is the trend in hiring (charts below).
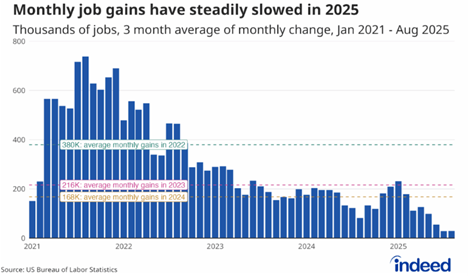
The 3-month moving average is falling quickly (chart below)
And then there’s the weekly initial jobless claims report. Jobs are a lagging indicator. Weekly initial claims are a leading indicator. The weekly number rose to 263,000 last week, the highest level since October 23, 2021.
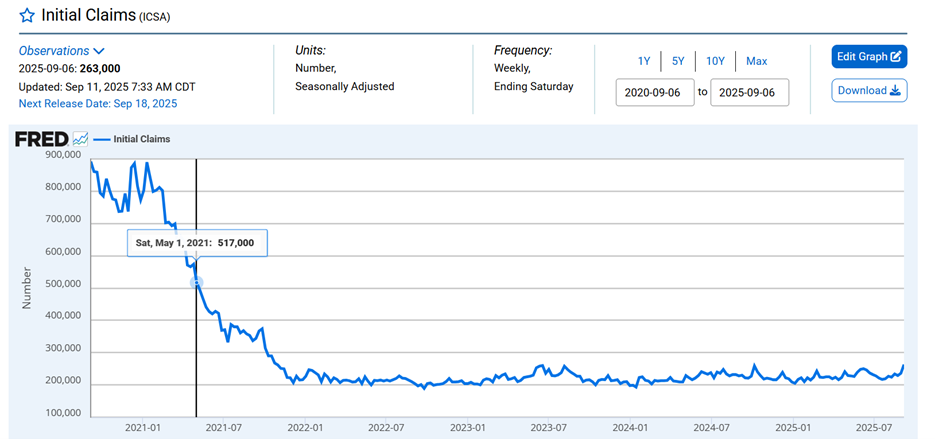
Despite the higher-than-expected claims number, the trend doesn't look alarming at all, at least not yet.
So, the Fed is concerned about the employment market. But cutting the fed funds rate isn’t the answer to slower job growth. Financial conditions are already loose after all. (see last week’s newsletter). Cutting the funds rate isn't going to turn the jobs market around, but it will benefit the government. Dropping interest rates will help the federal government reduce its interest expense. And the U.S. does need to reduce its interest expense. According to a recent Goldman Sachs research note, the U.S. is on track to pay more than 4% of GDP in interest by 2029. That will be second only to Italy.
It’s unlikely that cutting the Federal funds rate will make much of a difference in hiring. But it will hurt consumers. David Kelly, chief global strategist at J.P. Morgan Asset Management, writes in a research note that a cut in short-term interest rates will reduce income for households by far more than their interest expense. He calculates that a one-percentage-point reduction in short-term rates would lower households’ interest income from money-market investments and similar investments by $140 billion annually. By contrast, he figures that a similar rate cut might save them only $30 billion.
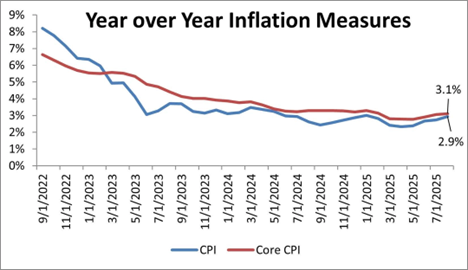
And then there is inflation, which argues against cutting rates. The headline CPI rose by 0.4 percent for August, more than expected. The 12-month rate rose to 2.9 percent, an eight-month high. The core CPI was up by 0.3 percent, raising the yearly rate to 3.1 percent.
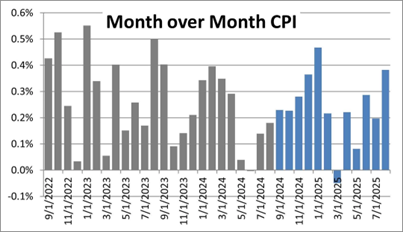
August’s overall inflation was the second highest monthly increase of the last year.
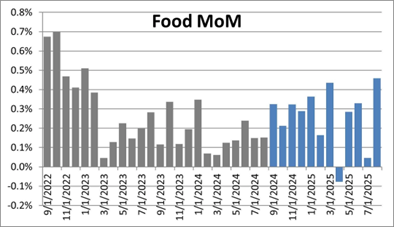
One prominent factor in the headline rise in inflation in August was food prices. Food rose by nearly 0.5% during the month, the highest monthly increase since January 2023.
On the core side, durable goods inflation is starting to heat back up.
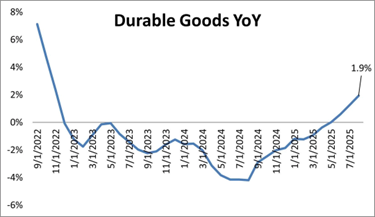
For the second consecutive month, durable goods inflation showed a moderate increase. It rose by 0.4%, the third-highest level in three years. Year-over-year durable goods inflation is still modest at 1.9%. Yet the trajectory over the last few months does not look encouraging.
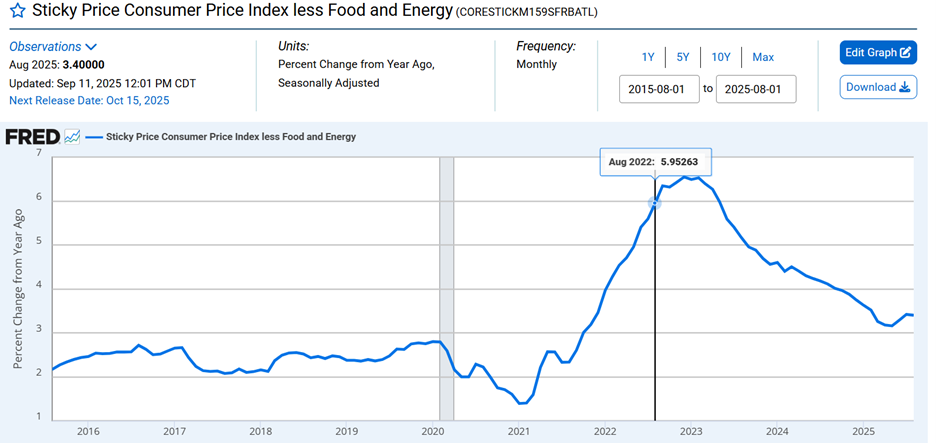
Sticky Consumer Prices are turning back up. (chart above)
Economists estimate the core PCE price index will be 2.9% when the report is released later this month. The core PCE is the Fed's preferred measure of inflation. Given the high PCE price index it's possible bond investors will bail when the Fed cuts in September.
Bond investors did just that last year when the Fed started to cut. Long-term rates rose. A similar "Bear Steepener" could occur again this year. The bond vigilantes might ride after all. TS Lombard strategists Daniel von Ahlen and Andrea Cicione now see more upside risks to U.S. bond yields, according to Barrons. They write in a client note that 4% will probably be the floor for the benchmark 10-year Treasury. The fed-funds futures market’s expectation of a sub-3% overnight rate by late 2026 is too low, they think. Ahlen and Cicione believe it will take a recession for the Fed to drop the funds rate below 3%. Although they concede that anything is possible, given the White House's pressure on the Fed to lower rates.
The White House might pressure the Fed to lower the FFR by more than it should. (It’s questionable whether it should be cutting at all) But it is long-term rates that matter more to the economy. And rising long-term rates would do more harm to the economy than any benefit from a 100 bps cut in the Fed funds rate.
Regards,
Christopher R Norwood, CFA
Chief Market Strategist


