Executive Summary
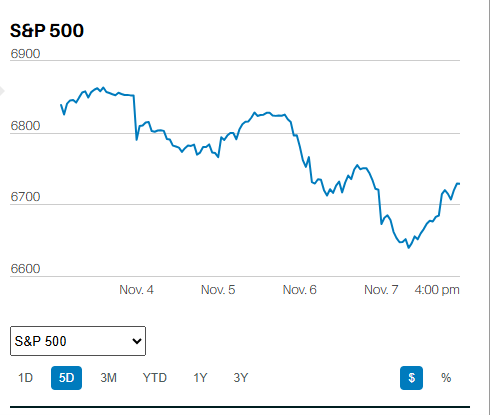
- The S&P 500 fell 0.3% last week to finish at 6,643.66
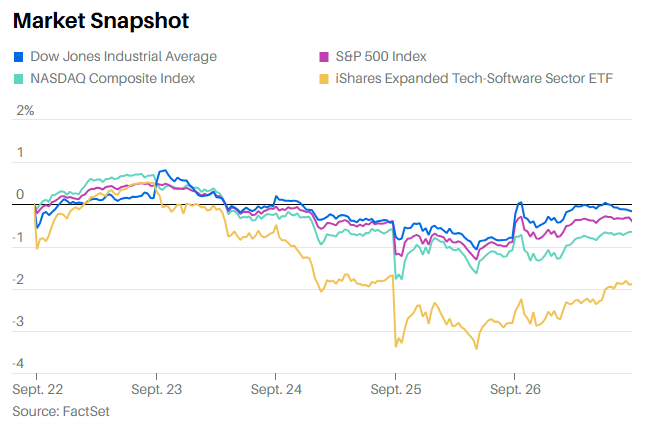
- The Dow, Nasdaq, and Tech sector ended lower as well
- The S&P average annual total return is 7.9% since the 2000 market peak
- The economy grew 3.8% in Q2 (third estimate), up from the prior 3.3% second estimate
- Financial conditions remain loose
- The 10-year Treasury yield has little room to fall from current levels
- The elderly and poor suffer most from the impacts of inflation
- Norwood Economics manages diversified portfolios
- This time is NOT different
- The S&P might see negative returns over the next decade
- Economic growth is the lowest in the past 25 years
- There are no piles of cash sitting on the sidelines
The Stock Market

The S&P 500 fell 0.3% last week to finish at 6,643.66. The Dow and Nasdaq also ended the week marginally lower. Technology fell more than the market.
The S&P 500 is up 37.4% since its April low. It is up 12.96% year-to-date. Its five-year return is 101.42%.
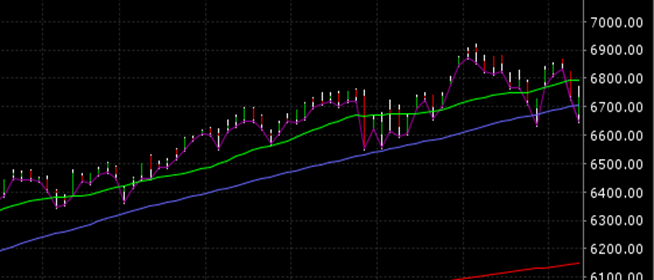
S&P 500 year-to-date Chart
The S&P average annual total return is 7.9% since the 2000 market peak. The below-average return is despite the roaring bull market that began in the spring of 2009. The current bull market has returned approximately 14.85% per year since the S&P bottomed in March 2009. It’s easy to forget that the S&P 500 lost money from 2000 – 2009. The index had a negative total return for the decade from January 2000 to December 2009. Total annualized returns were -0.95% during the “lost” decade. It is the only decade in which the S&P 500 produced a negative total return since data began tracking the index in 1926
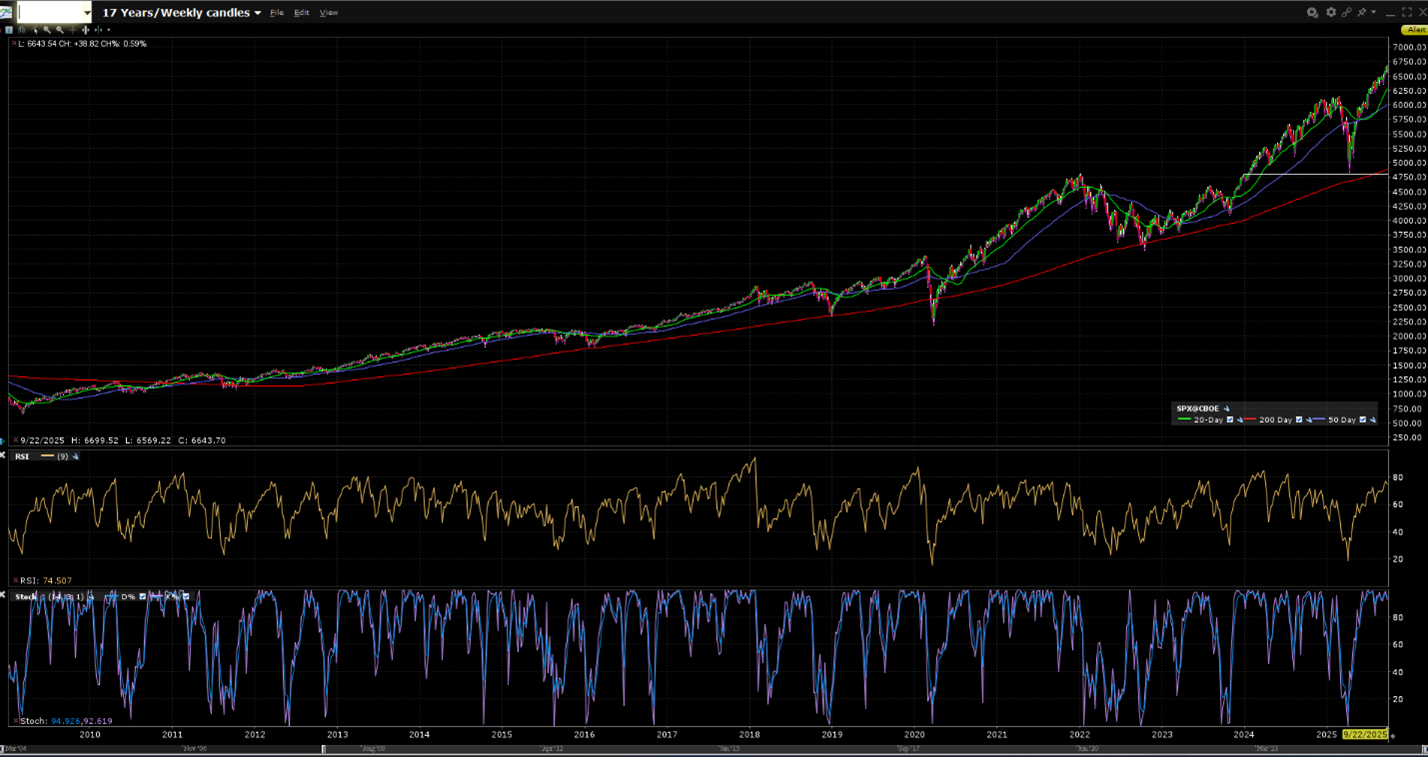
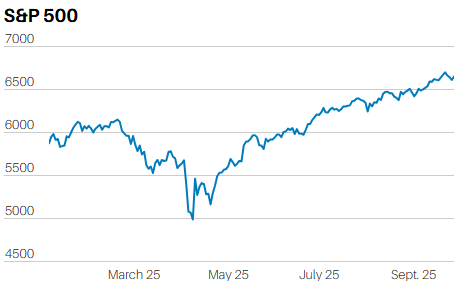
S&P 500 2009 to Present
Last week's economic data first. Then we'll review the math that suggests below-average returns for the S&P 500 during the next decade.
The economy grew 3.8% in Q2 (third estimate), up from the prior 3.3% second estimate. The Atlanta Fed GDPNow forecast is for Q3 GDP growth of 3.9% as of September 26th. The Nowcast for Real Final Sales to Private Domestic Purchasers* is 3.05% as of September 26th.
*(Real Final Sales to private domestic purchasers are an excellent measure of the economy's underlying trend. The report strips out volatile components such as government purchases, exports, and the change in private inventories. It's calculated by summing real personal consumption expenditures and real gross private fixed investment. It offers a better measurement of the underlying trend in domestic demand and economic growth.)
The S&P flash U.S. services PMI beat the forecast, as did the S&P flash U.S. manufacturing PMI. They came in at 53.9 and 52.7, respectively, for September. New home sales easily beat the consensus forecast, with 800,000 new homes sold in August. The forecast was for 649,000. Personal income growth was higher than expected, as was personal spending. In short, the economy seems strong. Meanwhile, inflation remains well above the Fed’s 2% target. The Personal Consumption Expenditure price index (PCEPI) rose 2.7% year-over-year. The core PCEPI rose 2.9%. And financial conditions remain loose, according to the Chicago Fed’s National Financial Conditions Index (NFCI).
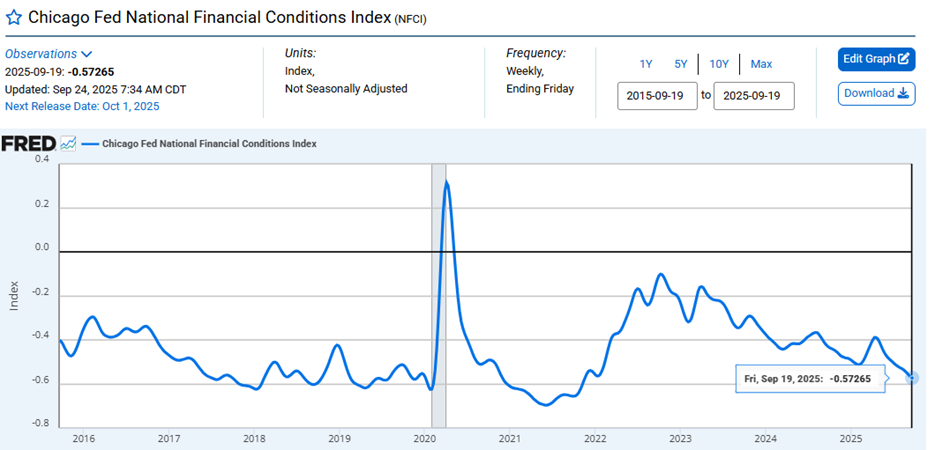
Financial conditions remain loose. (Negative numbers mean looser than average financial conditions. The NFCI is currently negative 0.57).
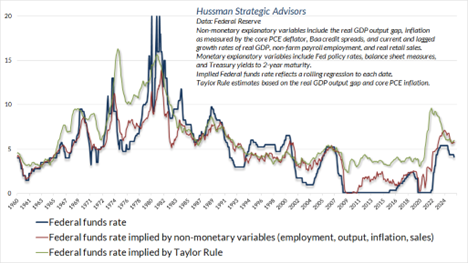
The Fed funds rate is already below the rate mandated by the Taylor rule. It is also below the rate indicated by non-monetary factors. (Chart Below) FFR is the blue line.
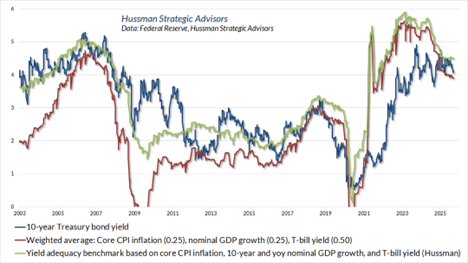
The 10-year Treasury yield has little room to fall from current levels (see chart below). It’s unlikely a Fed easing campaign will result in lower long-term rates. It is the longer-term rates that are most important to businesses and consumers.
To summarize, last week’s economic data was encouraging for the economy. But inflation showed no improvement and remains well above the Fed’s target. The elderly and poor suffer most from the impacts of inflation.
Now back to the math that suggests the S&P 500 will experience another lost decade.
(Norwood Economics manages diversified portfolios. They include international and emerging market stocks, bonds, precious metals, and real estate. Our exposure to the S&P 500 consists currently of 13 S&P 500 stocks. Our clients only own two technology stocks. The allocation is not the result of a top-down call. Rather, it’s the result of adhering to our investment discipline. We look for good companies to buy at a discount. We are price sensitive.)
The rest of the newsletter is devoted to explaining why this time is NOT different. It’s well known on Wall Street that there are no more dangerous words an investor can utter than “This time is different”. Artificial Intelligence will change the world. It will not change economics. There is a mathematical relationship between prices, cash flows, and returns. AI will not alter the mathematical basis behind long-term stock market returns. One must start with the fact that the value of a business is all its future cash flows discounted to their present value. Investors are currently valuing the S&P 500’s cash flow very highly indeed.
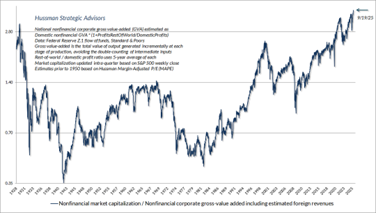
The above chart has nothing to do with Artificial Intelligence. It represents how investors have valued the economy's cash flow since 1926. Right now, investors are willing to pay more for the economy’s cash flow than ever before. Investors have the liquidity to speculate because the Federal Reserve has inflated its balance sheet. The Fed's balance sheet went from $850 billion in 2000 to almost $9 trillion by 2022.
The chart above shows that the Fed’s balance sheet is around 22% of GDP. That’s down from over 36% of GDP, but still well above the 6% to 8% of GDP that was the norm before Quantitative Easing. The huge surplus of Fed liabilities dominates the Fed funds rate.
Dr. John Hussman explained as much in his most recent note:
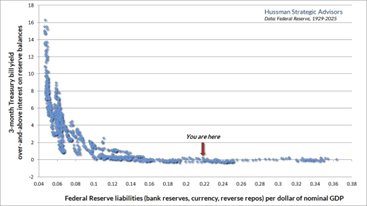
Short-term interest rates will go up or down because the Fed changes the rate of interest it pays banks to hold those reserves. As you can see from the “liquidity preference” curve we discussed earlier (chart above), the Fed’s balance sheet would have to shrink well below 10% of GDP before market forces alone could keep interest rates above zero. Prior to QE, the historical norm was about 6-8% of GDP.
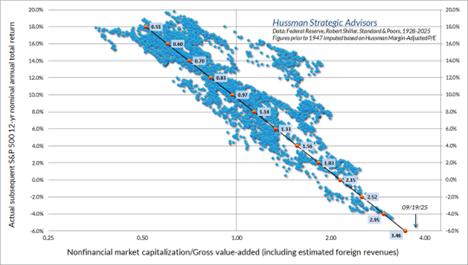
The Fed's immense injection of liquidity into the economy has caused asset prices to rise well above normal valuation levels. The price you pay for an asset determines the return you’ll earn. The chart below estimates negative 6% per year returns for the next 12 years for the S&P 500. That estimate is based on actual past returns associated with prior Mkt Cap/Gross Value Added levels.
There are several rationales that have been put forth by investors as to why “This time is different”.
Artificial Intelligence is going to change the world.
Dr Hussman, in his recent note:
Most of the impact of new technologies is dispersed over time – a great deal of the “surplus” initially observed as profit becomes non-monetary “consumer surplus.” New technologies produce benefits that take the form of convenience, utility, improved customer experience, new forms of activity, and other intangibles. These changes may be reflected to some extent in productivity figures, but they don’t cause a wholesale change in the way that economics work.
One need only examine the last 25 years for confirmation.
Dr. Hussman again:
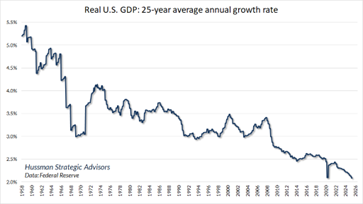
Whenever one mentions AI, the central focus of investors seems to be on visions of enormous future corporate profits and ever-accelerating economic growth. I think that exuberance will prove to be off the mark. Consider the profound impact of the internet, smartphones, social media, the sequencing of the human genome, and all of the life-changing technologies of the past 25 years. One might imagine that economic growth over the past 25 years must have been higher than over any 25-year span in history. In fact, it is the lowest.
If not AI as the support, how about the trillions of dollars “sitting on the sidelines" waiting to come into the market”?
The short answer is that there are no piles of cash sitting on the sidelines. Because there are no sidelines. Someone must always hold every dollar of cash until that “cash” is retired by the Federal Reserve. There is a seller for every buyer. Cash doesn’t “go to the sidelines”. It merely changes hands.
It is one of the most common misconceptions among investors and the financial media. The massive liquidity created by the Fed during the QE years must be held by someone at every moment in time. If you use your “cash” to buy stocks, the seller of the stocks gets that cash. It can’t turn “into” something else. Cash will go away when the Fed shrinks its balance sheet. Cash is created when the Fed expands its balance sheet. Cash can’t turn into something else.
The S&P 500 isn’t going anywhere over the next decade or so. There will be rallies and declines, but the total return is likely to be somewhere around zero. Financial planners should take note. Assuming a historical rate of return for U.S. stocks in the coming decade may leave your clients short in retirement. Investors are dangerously concentrated in the S&P 500. They need to diversify. International and emerging market stocks should do better. Bonds should see a positive return as well, likely the coupon. Diversification is the only free lunch in investing. It increases your risk-adjusted return. Just because the S&P is likely to underperform its average return in the coming decade doesn’t mean money can’t be made in stocks. Find good companies on sale and buy them with a three to five-year time horizon. You’ll likely be happy you did.
(None of this newsletter is intended as specific or appropriate investment advice. Consult a financial planner or advisor for advice that may be appropriate for your situation.)
Regards,
Christopher R Norwood, CFA
Chief Market Strategist