

Executive Summary
- The S&P 500 fell 0.3% last week to finish at 6,481.50
- The CAPE ratio is currently at its second highest reading ever
- Valuation is a lousy timing mechanism, but an excellent predictor of future returns
- Interest rates declined last week
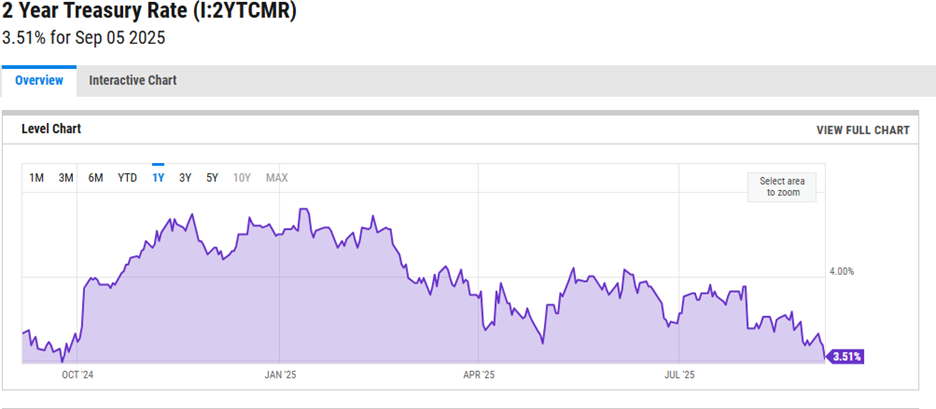
- The 2-Year Treasury yield fell to 3.51% by the close on Friday
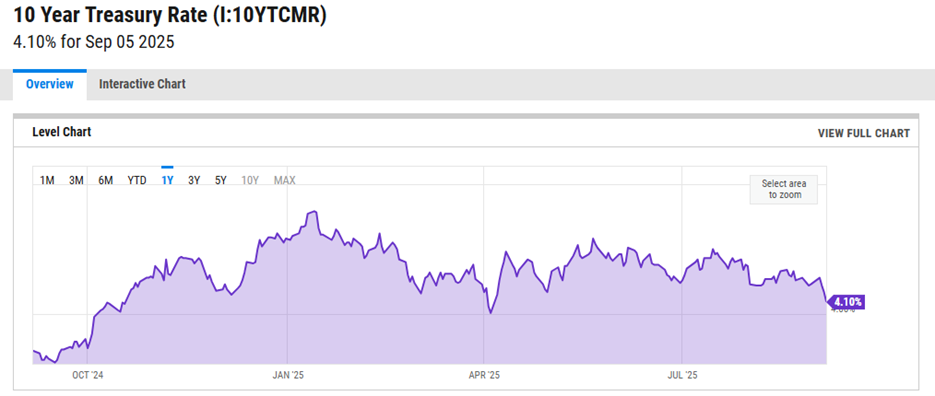
- The 10-Year Treasury yield also fell, ending the week at 4.10%.
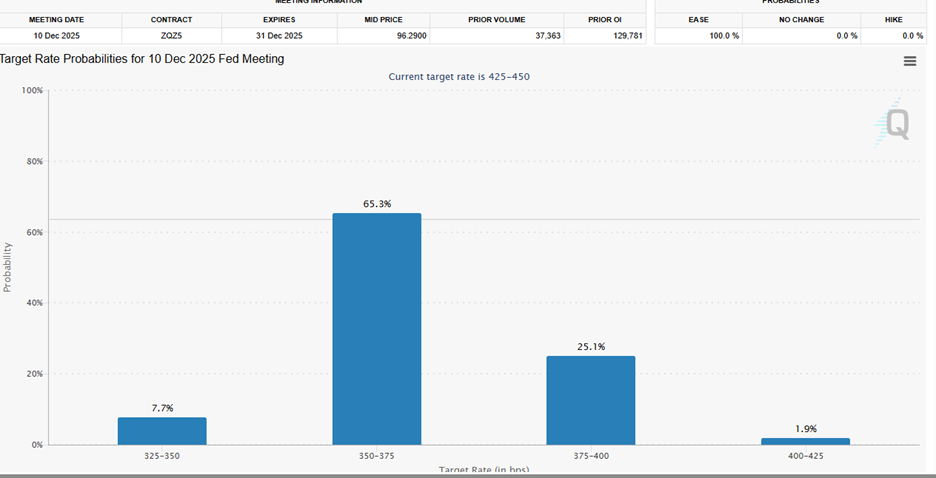
- The CME FedWatch tool has the odds at 73% of a Fed funds rate of 3.50% to 3.75% or lower by year's end
- The weak jobs report on Friday showed that only 22,000 new jobs were added in August
- Unemployment rose to 4.3% from 4.2%.
- The aggregate weekly payrolls index fell to 4.4% in August
- “We’re back in that world of uncertainty," states Art Hogan, chief market strategist at B. Riley Wealth
The Stock Market

S&P 500 5-Day Chart
The S&P 500 fell 0.3% last week to finish at 6,481.50. The S&P is up 10.2% year-to-date. It has returned 34.1% since April 8th, when it bottomed at 4,835.04. The S&P is up 17.7% over the trailing 12 months and 89.13% over the last five years. The U.S. stock market has returned approximately 9.5% annually dating back to 1871. It’s returned 17.8% per year on average over the last five years.
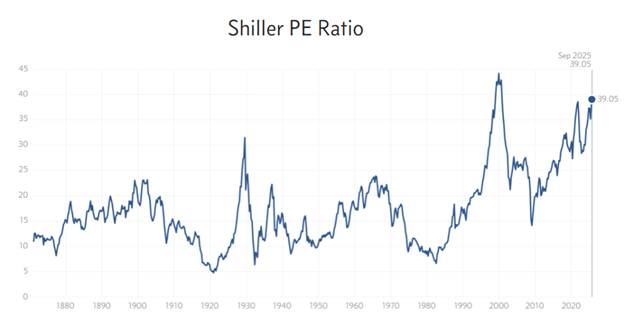
Shiller’s P/E is also known as the Cyclically Adjusted Price to Earnings (CAPE) ratio. It is price divided by the S&P 500's 10-year trailing inflation-adjusted earnings. The CAPE ratio is currently at its second highest reading ever.
Valuation is a lousy timing mechanism. It is an excellent predictor of future returns, though. It is likely the S&P 500 will underperform its long-term average over the coming decade. What type of return can we expect? Below is a chart from Dr. John Hussman that estimates S&P returns over the next 12 years. The red line represents actual 12-year returns. The black line estimates return over the next 12 years. The red line lags the black line by 12 years because the black line is a 12-year forecast. You’ll notice the high correlation for most of the period.
The last time we had such a large divergence between the forecast and actual returns was during the late 1990s dot.com bubble. We can expect actual returns to correct back to the forecast line in a similar fashion to last time. It’s the timing that’s problematic. Note that the 8/11/25 forecast (bottom right corner of the chart) is for a negative 7% per year.
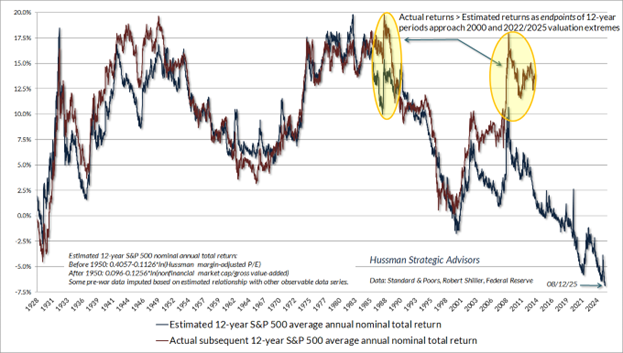
The above chart is not meant to scare investors out of the market. There are good businesses on sale in the S&P 500 and throughout the world. Norwood Economics currently owns 24 individual stocks. The stocks are part of the diversified portfolios Norwood builds for clients. Fourteen of those stocks are U.S. and ten are international. Thirteen of the fourteen US stocks are in the S&P 500. Only two of our stocks are technology stocks. Meanwhile, almost 40% of the S&P 500 is composed of tech stocks.
The above chart is not a call to exit stocks. It is a caution that future returns are likely to be muted. It’s also a warning that the concentrated S&P 500 is likely to be more volatile in the coming years. More volatility and less return is not a setup that investors should ignore.
Interest rates also declined last week. Bond investors reacted to a weaker-than-expected jobs report. As of midday Sept. 5th, the 2-year rate had fallen by 12 bps, while the 10-year rate had fallen by 9 bps. The 3-Month Treasury yield ended the week at 4.05%. It is signaling a quarter-point cut later this month when the Federal Reserve meets. The 2-Year Treasury yield fell to 3.51% by the close on Friday. It signals the likelihood of three rate cuts.
The CME FedWatch tool has the odds at 73% of a Fed funds rate of 3.50% to 3.75% or lower by year's end. Of course, that will depend on future data, especially inflation data. There is a better than even chance that inflation will rise between now and year-end. It's already above the Fed's target rate of 2%.
The 10-Year Treasury yield also fell, ending the week at 4.10%. The 10-year yield looks as if it wants to test 4% in the coming weeks. It’s the long end that matters. The 10-year is heading in the right direction, as is the 30-year. The 30-year Treasury started the week testing 5% and looking as if it was going to break higher. It finished the week yielding a more comforting 4.76%.
The catalyst for falling yields was the weak jobs report that came out on Friday. Only 22,000 new jobs were added in August. The August number came in below the 75,000 forecast. The July number was 79,000. The June jobs report was revised lower as well. June's number fell to negative 13,000. It was the first negative number since December 2020. The three-month moving average has fallen to 29,000.
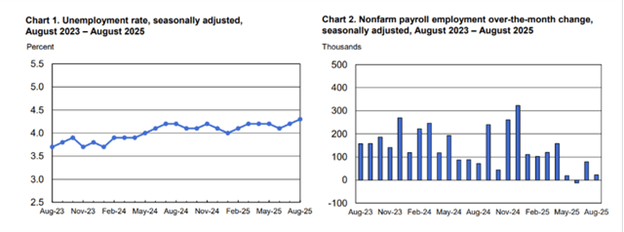
Unemployment rose to 4.3% from 4.2%. The broader U-6 number rose to 8.1% from 7.9%. The U-6 unemployment rate includes the underemployed and also discouraged workers. The U-6 unemployment rate offers a broader view of the labor market.
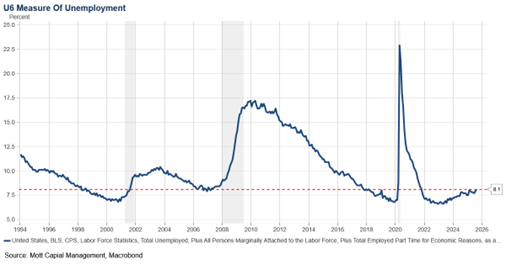
The U-6 unemployment rate at 8.1% is worrisome. The U.S. economy had already entered recession in 2001 by the time the U-6 number had risen to 8.1% (see chart above). The unemployment rate never fell below 8.1% heading into the 2007 recession.
The August jobs report likely confirms a significant labor market slowdown. We write likely because the jobs number is better thought of as a range of values rather than a single data point. Take the August 2025 jobs report. The Bureau of Labor Statistics (BLS) reported a change of +22,000 in total non-farm payroll employment. The 90% confidence interval is +/- 136,000. This means the BLS is 90% confident that the actual change in jobs was somewhere between a loss of 114,000 and a gain of 158,000.
The aggregate weekly payrolls index is part of the jobs report. It fell to 4.4% in August. The weekly payrolls number tracks nominal GDP closely. It appears as if nominal GDP is trending lower (chart below).
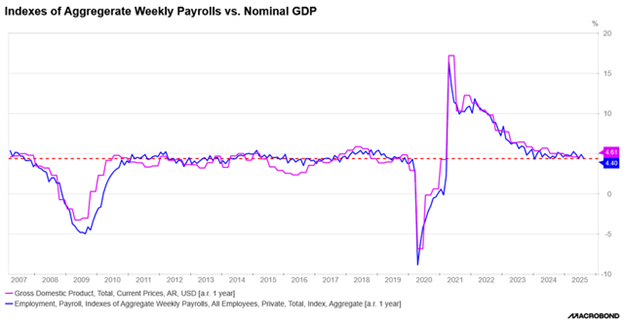
Slowing nominal GDP means slowing revenue. Slowing revenue means falling profit margins (until businesses can cut costs). Falling profit margins mean slower earnings growth. Slower earnings growth in an overvalued stock market raises the risk of a pullback.
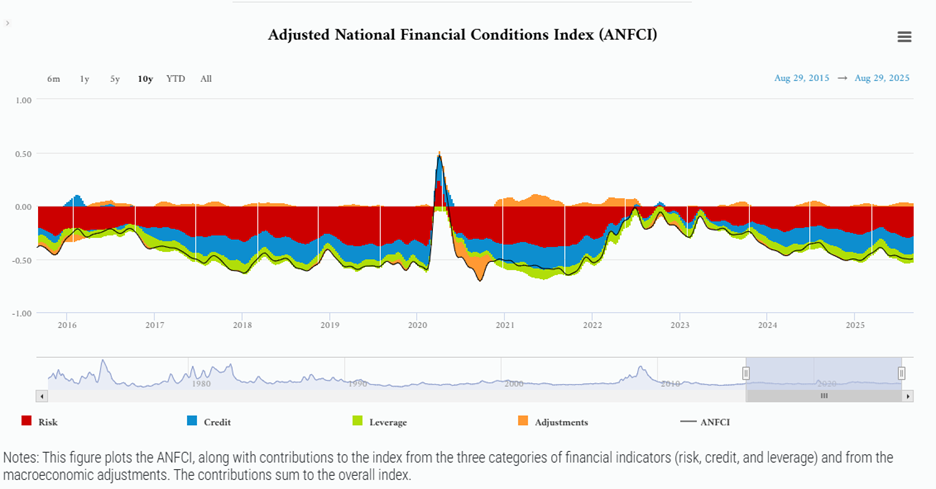
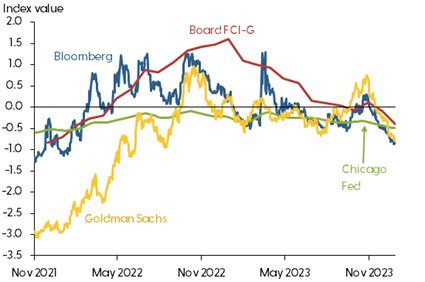
Financial conditions aren’t restrictive. The Chicago Fed’s financial conditions index (below) is negative, which means financial conditions are loose already.
Other financial conditions indices, including Bloomberg’s and Goldman Sachs’, are indicating loose financial conditions (negative numbers in chart below).
Financial conditions aren’t the problem. Uncertainty caused by trade policy is the problem.
Art Hogan is chief market strategist at B. Riley Wealth. Hogan had this to say last week:
“We’re back in that world of uncertainty and when that happens, things freeze up, corporates don’t make decisions, investors get uncertain, and consumers start changing their behavior—and none of that’s going to drive job creation.”
Diane Swonk, chief economist at KPMG added in a note last week that, “Financial conditions as measured by the Fed have eased, while the senior loan officer survey was not notably restrictive.” Swonk went on to add that, “Uncertainty levels its own “tax” on the economy. Businesses are struggling to determine how fluctuating tariff policies will impact their bottom line and consumer demand, both factors that primarily drive hiring decisions."
An appellate court recently ruled against most of the Trump administration’s tariffs. That means uncertainty surrounding trade policy is unlikely to fall any time soon. It could be a while before companies get any clarity, despite the Trump administration asking the Supreme Court for an expedited process.
Risks are rising as the economy slows. It’s worth remembering that Shiller’s PE shows an expensive stock market. In fact, the stock market has been valued at a higher level only once since the late 1800s. There is little margin of safety for investors buying the indexes.
Interesting Charts:
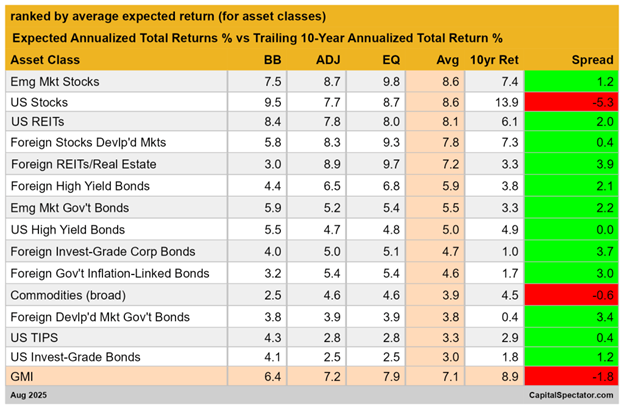
US stocks are expected to underperform their 10-year trailing average by 5.3%, according to the above chart. Norwood Economics expects that US stocks will underperform their trailing 10-year average by closer to 8%.
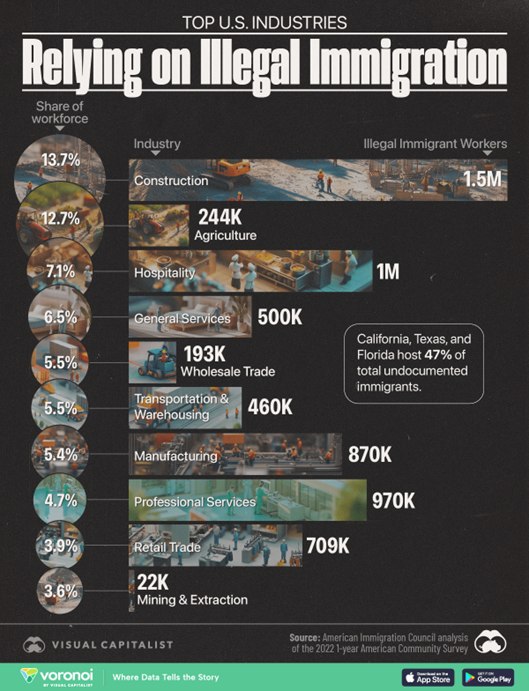
California, Texas, and Florida account for 47% of total undocumented immigrants. The supply of labor is falling. Wage growth is likely to stay above longer-term averages, adding to inflation pressures.
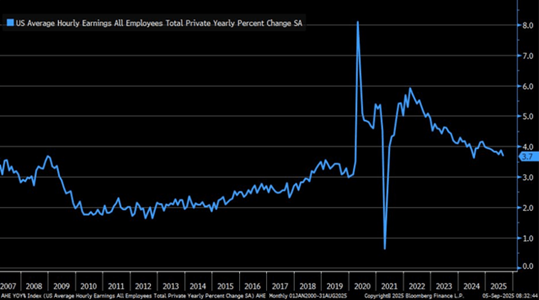
Average hourly earnings declines are flattening out. Average hourly earnings growth is well above pre-COVID levels.
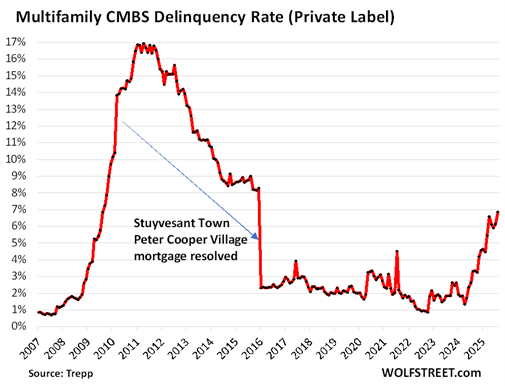
The multifamily CMBS delinquency rate is rising rapidly. It is a sign of stress in the apartment rental market.
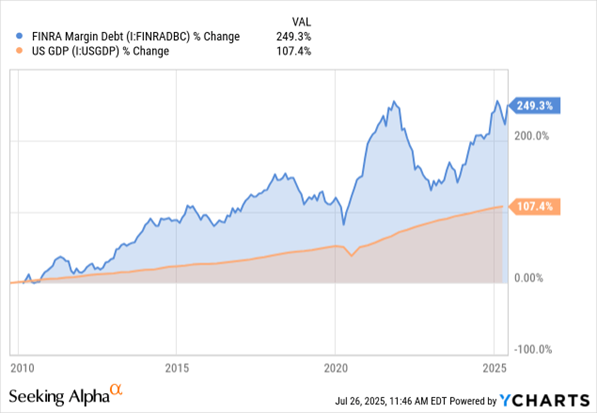
Margin debt recently topped $1 trillion for the first time.
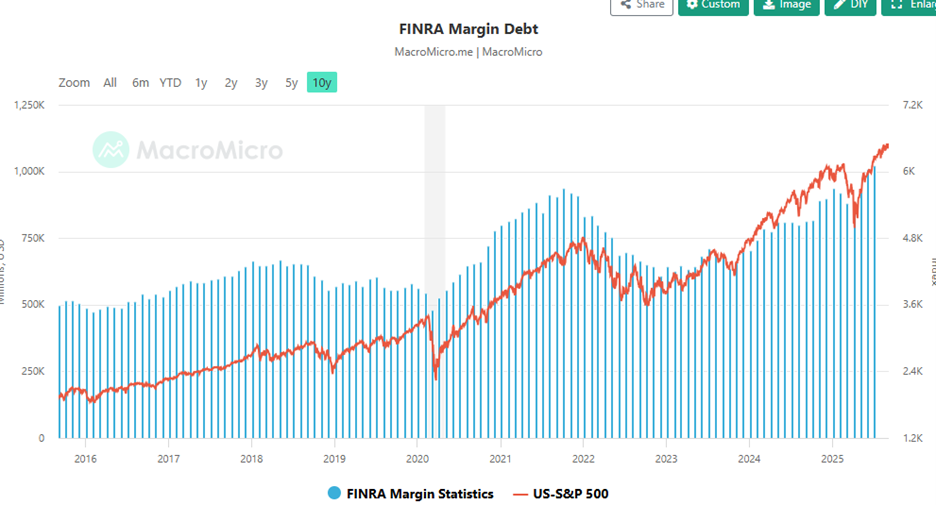
When money is cheap, speculators will speculate.
Regards,
Christopher R Norwood, CFA
Chief Market Strategist


