Executive Summary
- The S&P 500 rose 2.43% last week, climbing to 6,389.45
- Interest rates didn’t move much last week
- The economy is slowing according to the Chicago Fed National Activity Index (CFNAI)
- Real final sales to Private Domestic Purchasers are slowing
- The Institute for Supply Management (ISM) Services index fell from 50.8 to 50.1. The index is only two-tenths away from showing contraction
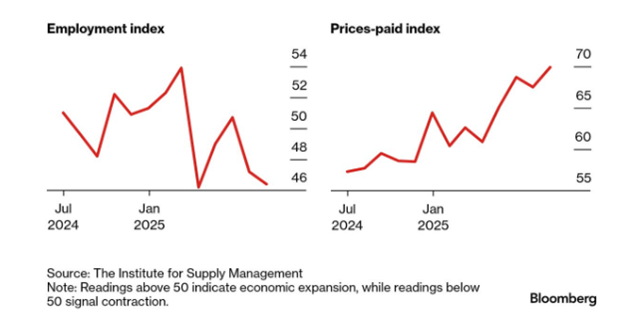
- The employment sub-index of the Services Index report was also weak
- The prices paid sub-index continues to climb
- Norwood Economics manages its clients' diversified portfolios with a focus on the long run
The Stock Market

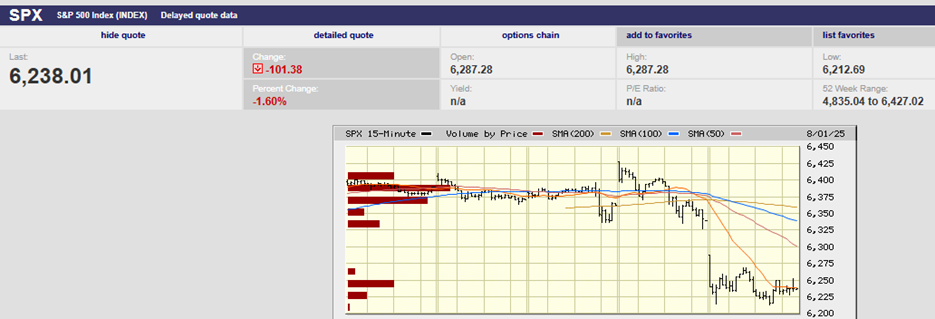
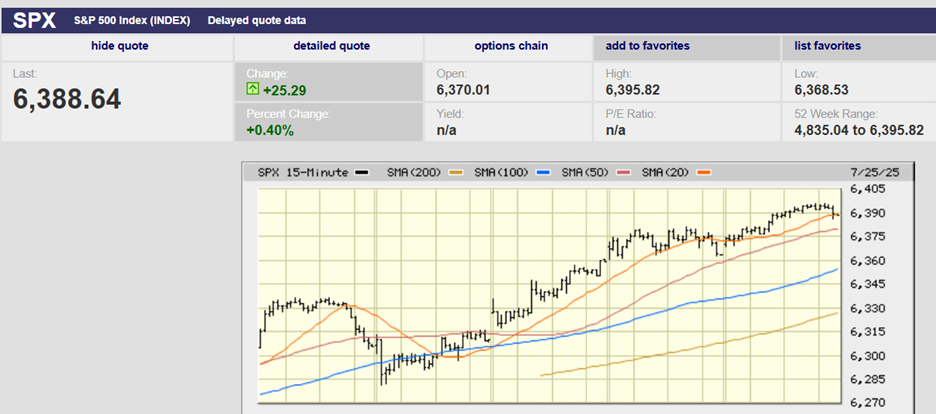
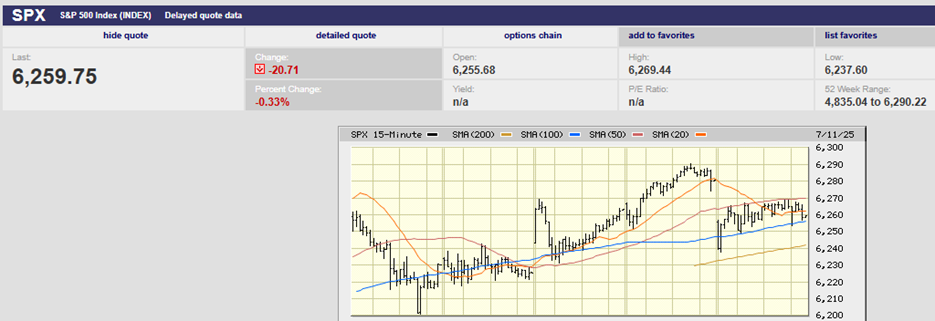
S&P 500 5-Day Chart
The S&P 500 rose 2.43% last week, climbing to 6,389.45. The Nasdaq rose 3.87% and the Dow climbed 1.35%. The S&P 500 has gained 8.63% in 2025. Industrials remain the leading sector year-to-date. They’ve climbed 14.47% so far. Technology has taken over the number two spot. The sector is up 14.36%. Utilities are the third-best-performing sector, with a 13.86% gain in 2025. The S&P is less than 40 points from its record high (chart below). Momentum has been waning, though. A failure to break out to a new high in the coming week might signal a period of consolidation. A 5% to 10% pullback is also possible. A trading range between 6,200 and 6,400 for the rest of the summer wouldn’t be surprising at all.
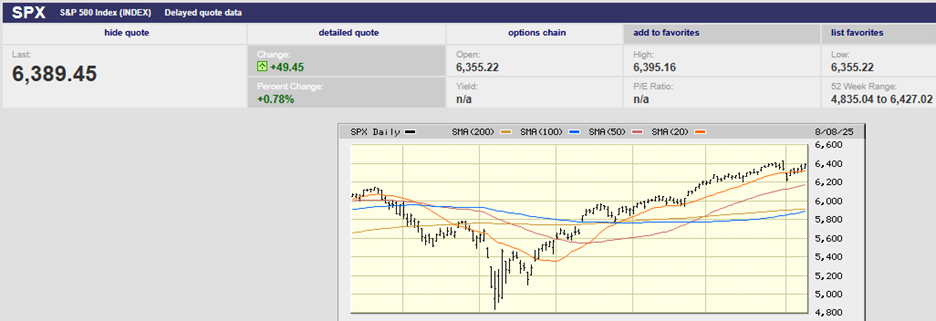
S&P 500 6-month Chart
Interest rates didn’t move much last week. They fell sharply the prior week because of the weak jobs report. The two-year Treasury yield ended Friday at 3.77% up from 3.69% the prior Friday. The 10-year yield finished the week at 4.28%, up from 4.22% the prior week. Bond investors are expecting a fed funds rate cut at the September meeting. The CME FedWatch tool estimates an 88.9% probability of a quarter-point cut. Investors placed odds of a second cut at 57.0% in October. The odds of a third cut in December are at 46.7%. The funds rate is currently at 4.25% to 4.50%.
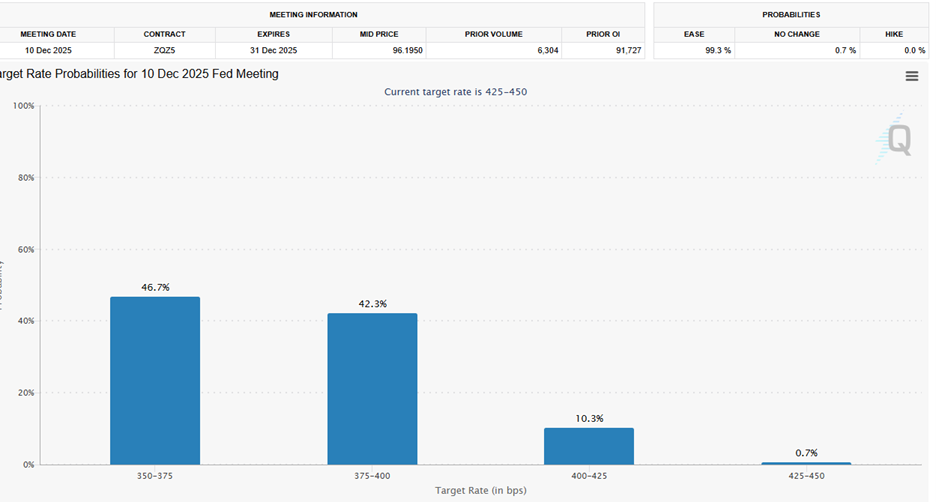
CME FedWatch Tool Odds Through Year-End
The Fed has reason to consider a rate cut in September.
The economy is slowing. It's expected to slow further because of tariffs. The chart below shows the three-month moving average for the Chicago Fed National Activity Index (CFNAI). A negative number indicates the economy is growing below average, as it is now.
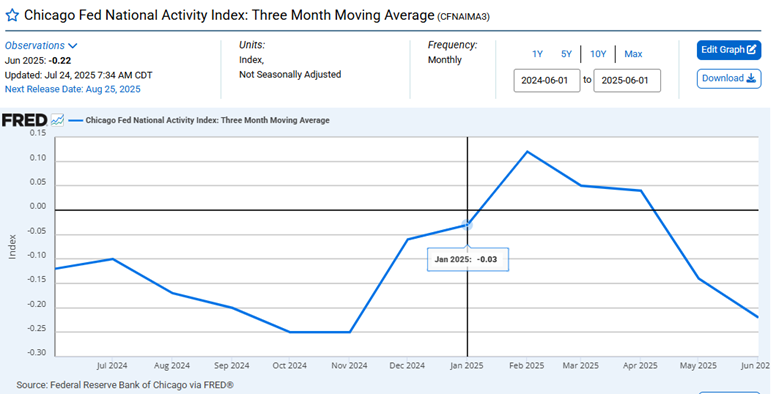
CFNAI 1-year Chart
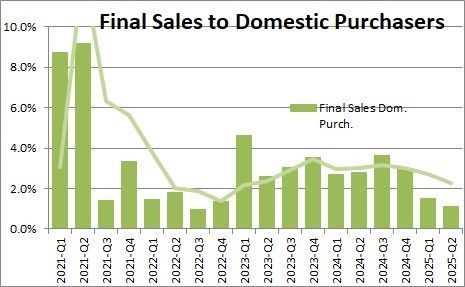
Real final sales to Private Domestic Purchasers are slowing as well (chart below). Real final sales is an important indicator of underlying demand. It measures the core demand part of GDP. Exports, imports, government spending, and changes in inventories are subtracted.
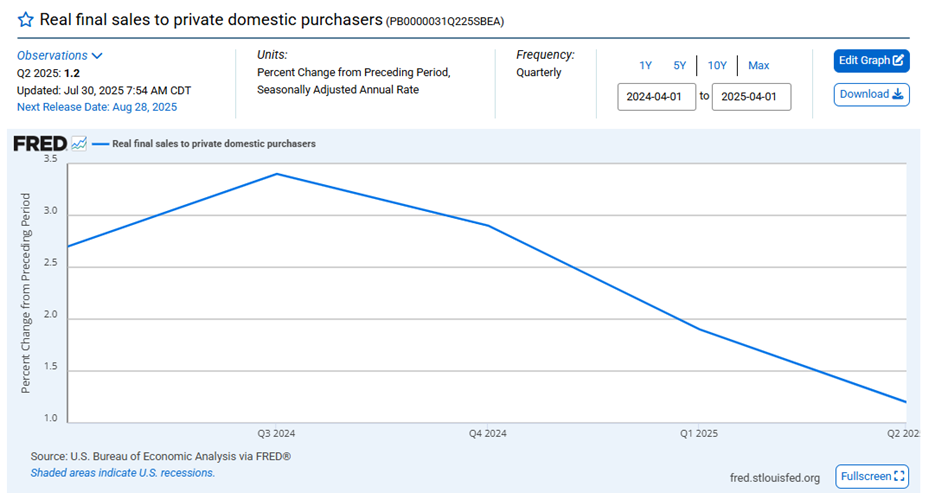
Final sales to domestic purchasers rose 1.5% in the first quarter and 1.1% in the second quarter. The 1.3% average increase in final sales to domestic purchasers in the first half of the year is a good proxy for the trend growth rate for GDP in the first half of 2025. The Fed should be concerned that real final sales to domestic purchasers is slowing (chart below).
More unfavorable economic news came out on Tuesday. The Institute for Supply Management (ISM) Services index fell from 50.8 to 50.1. The index is only two tenths away from contraction. MarketWatch laid the blame on “tariff knock-on effects”. Jeffrey Bartash reported that the index showed higher inflation and lower employment. Remember, many economists fear that stagflation is coming due to tariffs. The ISM Services Index may be signaling that outcome now.
Bartash went on to write:
“The large services side of the U.S. economy barely grew in July as ongoing trade wars raised costs, spurred reductions in employment and forced businesses to delay future plans until the scope of tariffs becomes clear.” It’s disturbing that the new orders sub-index is also close to stagnation, coming in at 50.3. (chart below).
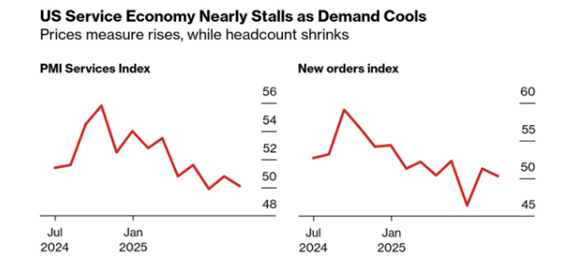
The employment sub-index of the Services Index report was also weak (chart below). It contracted for the second month in a row and the fourth month in the past five. It’s at its weakest level since June 2020, according to Lawrence Fuller of Fuller Asset Management. Meanwhile, the prices paid sub-index continued to climb (chart below).
Fuller went on to write in a note following the ISM Services Index release that:
“This is consistent with what we saw for employment in the ISM Manufacturing Index, and it corroborates the downward revisions by the Bureau of Labor Statistics to its job estimates for June and July.”
The Fed has reason to hold rates steady in September.
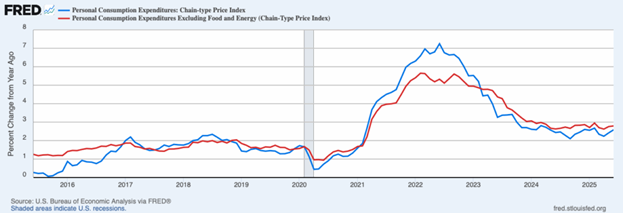
The ISM prices-paid index should worry the Fed and may prevent it from cutting as quickly as bond investors are hoping. The Personal Consumption Expenditures Price Index (PCE) isn’t cooperating either.
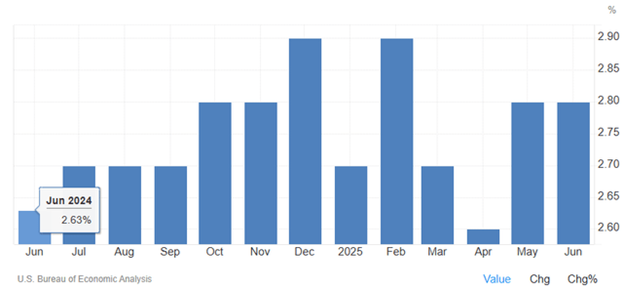
We shared these charts (above and below) with readers last week. The PCE price index is no longer falling and may have started to rise.
The Consumer Price Index (CPI) comes out on Tuesday. The release will mark a “moment of truth on tariffs,” according to Piper Sandler economist Jake Oubina. Core goods prices are expected to show an uptick. The increase would reflect import fees, which should result in a 0.3% rise in core CPI, according to Barron’s. Deutsche Bank economists forecast a year-over-year rise of 2.8% for the headline CPI number. They are forecasting 3.0% for the core measure. Both numbers would represent an increase of 0.1 percentage points. Worse, the CPI may continue to rise in the coming months due to tariffs. RBC Capital Markets economists Mike Reid and Carrie Freestone wrote in a client note that “we do not anticipate next week’s [CPI] data will fully capture the impact of tariffs on consumer prices.”
The coming week could be volatile for both the stock and bond markets. An above-consensus CPI report could lead to a selloff in Treasuries. That in turn might well bleed over into the stock market. The bond market struggled this past week following a series of weak auctions,’ according to James Reilly, senior market economist at Capital Economics. A bad CPI report would only add to bond investor' angst about their bond holdings.
Norwood Economics has started to remind clients that the S&P 500 has come a long way since it bottomed at 3,491.58 in 2022. The index is up over 82% in less than three years. It is up 32% since April. Earnings and interest rates determine stock prices over the long run. The stock market could continue to rise into year-end. It could continue on its merry way for the next couple of years. But those gains would not be because of fundamentals. Earnings growth of 9% to 10% is normal. The S&P 500 price has far outrun earnings growth over the last few years. A period of consolidation would be normal. A pullback of 15% to 20% would be normal. As always, it is the timing that is problematic.
Norwood Economics will continue to manage its clients' diversified portfolios with a focus on the long run. It will also continue to seek out good companies to buy on sale.
Regards,
Christopher R Norwood, CFA
Chief Market Strategist