Executive Summary
- The S&P 500 rose 1.01% last week to finish at 6,449.80
- The stock market keeps hitting new highs
- Market strategists are expecting earnings growth to accelerate in 2026
- Margins remain near record highs
- Corporate profit margins will likely take a hit from tariffs
- Passing tariff costs on to the consumer means raising prices
- Core CPI rose by 0.3% in July
- The PPI jumped 0.9% last month, the largest monthly increase in more than three years
- Buffett says it’s dangerous when the market cap rises to more than 140% of GDP. Currently, the ratio is above 200%.
- The massive increase in the Fed's balance sheet over the last 25 years has led to financial asset price inflation
The Stock Market

S&P 500 5-Day Chart
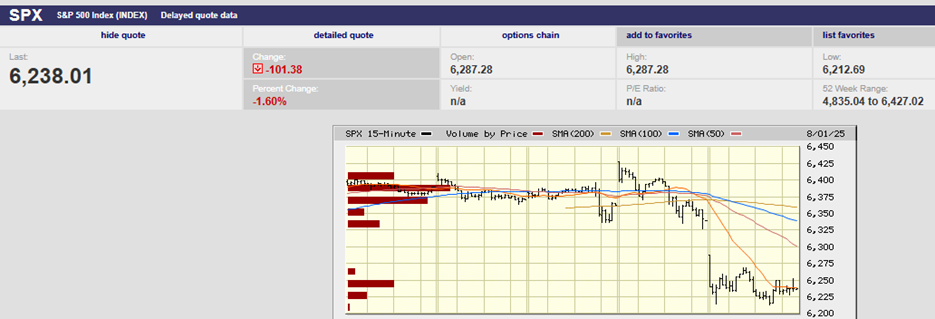
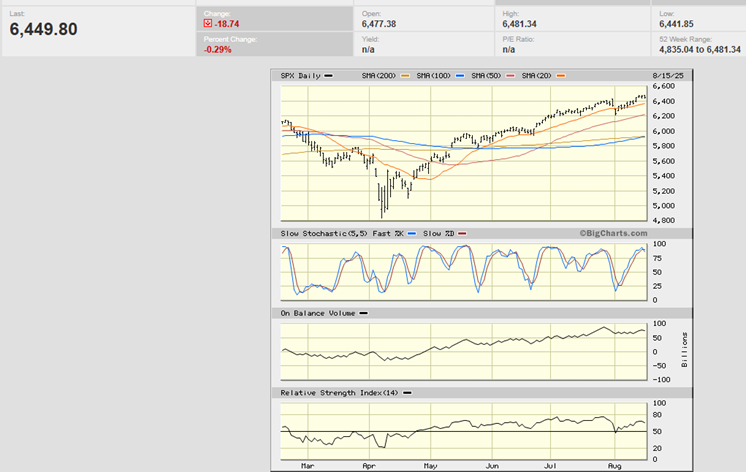
The S&P 500 rose 1.01% last week to finish at 6,449.80. The index set a record high on Wednesday morning in the first 30 minutes of trading, hitting 6480.28. It bested the Wednesday high in the first 15 minutes of trading on Friday, reaching 6481.34. But sellers stepped in again and sent the S&P to a low for the day of 6,441.85. The early selling on Wednesday and again Friday increases the odds of a down week this week. Additionally, the slow stochastic has rolled over, and there are negative divergences in Relative Strength and On-Balance Volume. (see the SPX chart below)
S&P 500 6-month Chart
The stock market is hitting new highs. Yet momentum is slowing per the RSI, Stochastic, and OBV indicators.
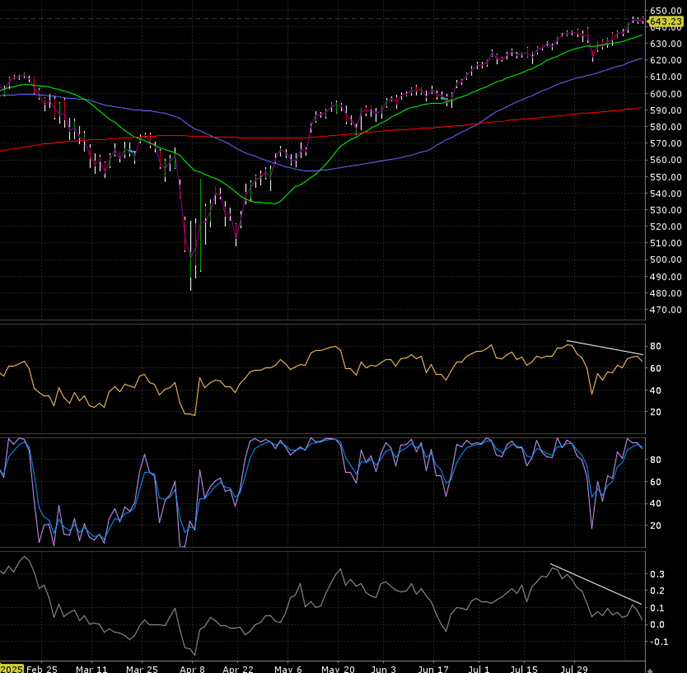
Money flow is the bottom indicator in the SPY one-year chart below. It is also showing a negative divergence.
We’ll see if the coming week brings profit-taking.
The Nasdaq finished the week at 21,622.98, up 0.8%. The Dow closed out the week at 44,946.12, up 1.7%. The S&P is up 9.66% year-to-date. The index is up 16.35% over the trailing twelve months and 91.23% over the last five years. The five-year performance works out to an average annual return of more than 18%. Business valuations do not change that fast.
The S&P has risen between 9% and 10% per year since 1871. It is now trading at more than 24 times 2025 earnings and over 21 times 2026 earnings. The index trades for around 17 times twelve-month forward earnings on average. The consensus forecast for 2026 earnings growth is 13.4%. Earnings growth in 2025 is expected to be 10.1%. Earnings grew 9.7% in 2024 and 1.5% in 2023. Market strategists are expecting earnings growth to accelerate in 2026. That is despite a slowing economy.
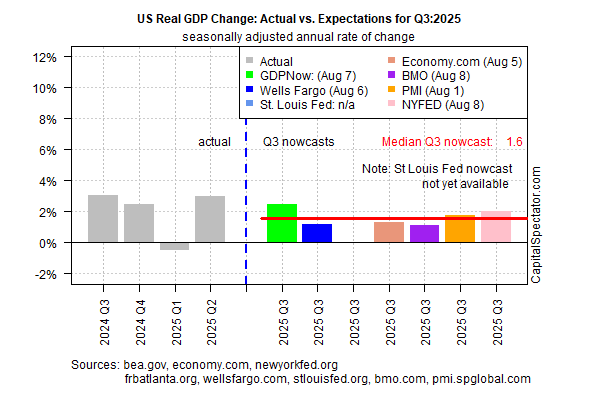
Initial estimates of third-quarter economic activity point to a downshift in output. That’s based on the median for a set of nowcasts compiled by CapitalSpectator.com(chart below). Q3 GDP is on track for a 1.6% rise in output (annualized change), according to the median estimate. The Atlanta Fed GDPNow for Q3 is 2.5% as of 15 August. (green column in chart below).
Margins remain near record highs. Margins are mean-reverting. The mean profit margin over the long run is 6.3%. Profit margins now are 10.7%.
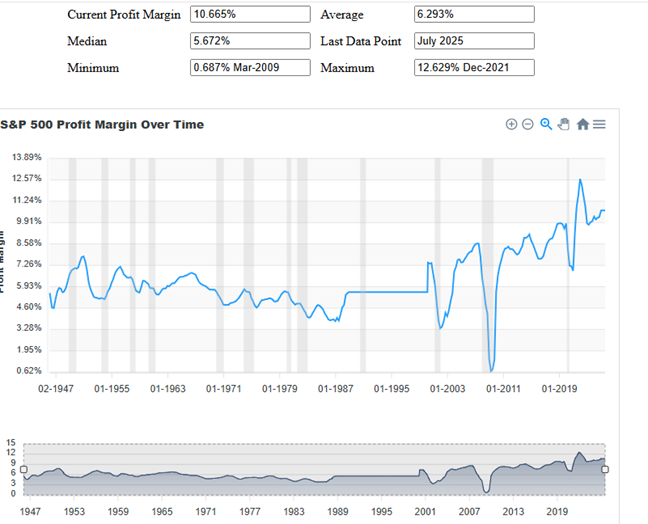
It seems unlikely that profit margins will expand further. A contraction in margins seems more probable. Tariffs make margin compression even more likely.
“Signs of tariff-related pass-throughs are becoming more apparent, and we anticipate the coming months will be pivotal in assessing how well the economy is able to absorb these pressures,” notes Vanguard’s economic team. The effective average US tariff rate is now roughly 18%, according to the Yale Budget Lab. It’s the highest tariff rate since the Great Depression. It's also 15 percentage points above the rate at the start of 2025, according to James Picerno of CapitalSpectator. “The increase in prices [due to tariffs] and the commensurate reduction in purchasing power will likely have a negative impact on US growth,” according to economists at Deloitte and Touche.
Corporate profit margins will likely take a hit from tariffs. Goldman Sachs published an analysis of who’s paying the cost of tariffs through June. US companies incurred 64% of the cost. Exporters paid 14% of tariff costs. U.S. consumers covered 22%. Goldman also estimates that consumers’ share of the cost will increase from 22% to 67%. It's estimate is based on historical precedent. The corporate share is expected to fall to 10%.
Corporations will feel continued pressure from tariffs even as their direct costs fall. Passing costs on to the consumer means a drop in demand (law of supply and demand). Falling demand means fewer goods sold, thus less revenue. Less revenue means lower margins until costs are cut. Passing tariff costs on to the consumer also means raising prices. Higher prices mean higher inflation all else equal.
The economy may already be seeing higher prices because of tariffs. The Consumer Price and Producer Price Indexes were released last week.
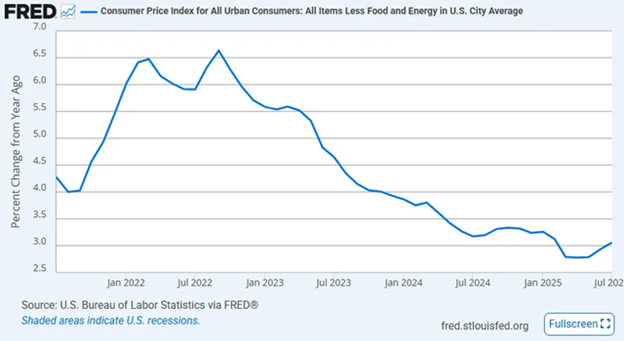
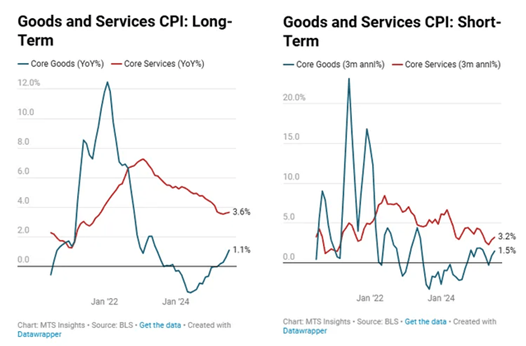
Core CPI, which excludes food and energy, rose by 0.3% in July,. It was the largest increase since January. The annual rate of inflation hit 3.1%.
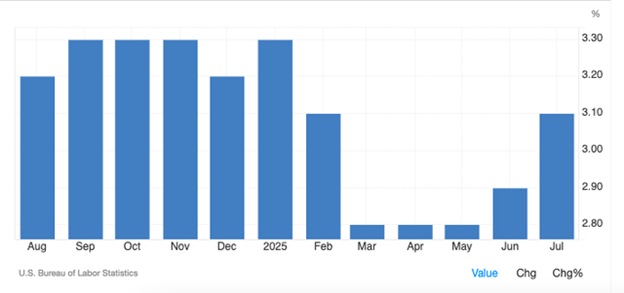
It is looking as if disinflation has bottomed and higher prices may be coming.
What’s more, goods inflation is now positive, at least in part because of tariffs. Goods deflation turning to inflation is a new headwind for inflation.
The producer price index is a measure of wholesale inflation. Wholesale goods and services prices often lead consumer prices (see chart below).
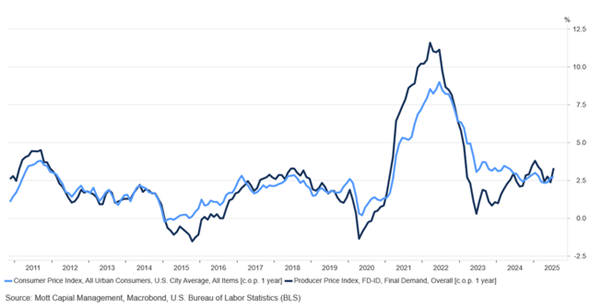
The PPI jumped 0.9% last month. It was the largest monthly increase in more than three years, according to the Bureau of Labor Statistics. The surprise PPI number followed a 0% change in June. The PPI report means businesses are raising the prices they charge one another. Rising input costs will likely lead to higher consumer prices.
“We see risk of the Fed potentially cutting fewer times than market expectations,” wrote Chris Senyek, chief investment strategist at Wolfe Research, in a note on Aug. 14. “We are starting to see that inflationary pressure is bubbling,” said Jennifer Lee, senior economist at BMO Capital Markets. The yearly rate of wholesale inflation climbed to 3.3% from 2.4% — a five-month high. Core PPI rose 0.6% in July. That was the biggest increase in three and a half years. The 12-month increase in the core rate moved up to 2.8% from 2.5%.
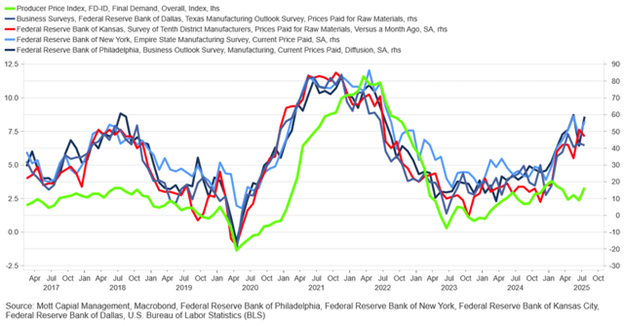
Leading indicators of inflation are also flashing a warning. Business surveys are predicting rising producer prices (see chart below). And producer prices tend to lead consumer prices.
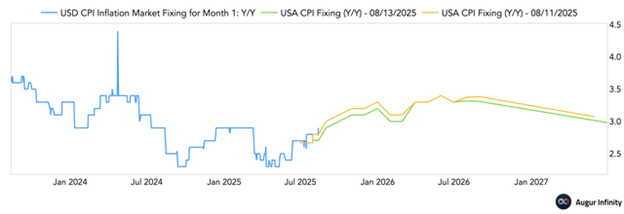
The Swaps market is also signaling that inflation is likely to remain well above the Fed’s 2% target over the next few years.
Higher for longer inflation means higher for longer interest rates. The Fed is expected to cut the Fed funds rate by a quarter point in September. It might or might not, depending on the economic data coming out in the meantime. Uncertainty leads to increased volatility. So does a concentrated portfolio.
The S&P 500’s growing concentration in a handful of mega-cap stocks has reached historic proportions, according to Apollo Chief Economist Torsten Sløk. Apollo calculates that Nvidia has the largest individual stock weighting in the S&P 500 since records began in 1981. The Mag Seven stocks now represent 33.85% of the S&P 500. The twenty largest constituents make up almost half the index at 48.44%. Concentrated portfolios are more volatile. The S&P 500 is a concentrated portfolio. It’s another risk factor to consider when building a diversified portfolio. That the S&P 500 is expensive only heightens the risk even as expected return falls.
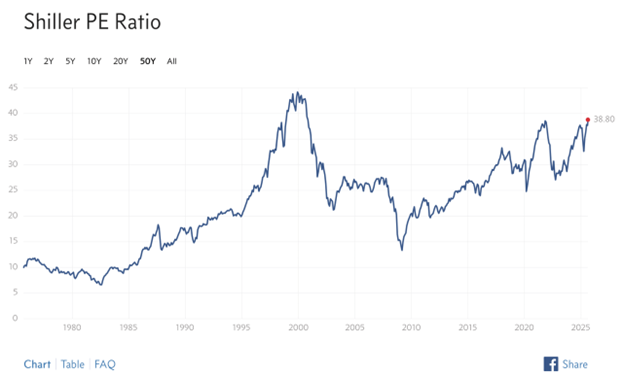
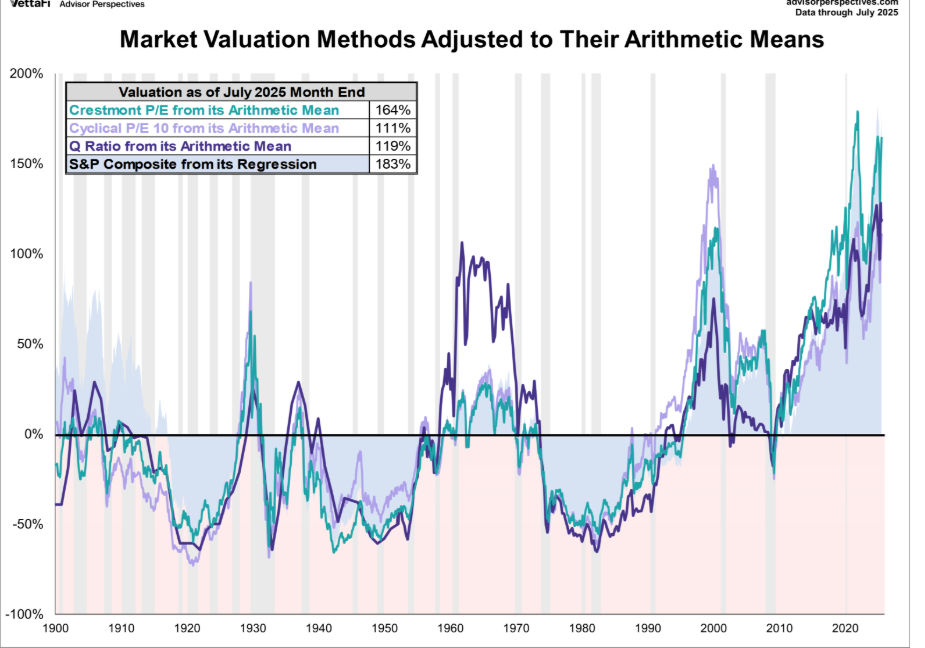
Shiller’s P/E takes the S&P stock market price and divides by 10-year inflation adjusted average earnings. It’s approaching the dot.com bubble level.
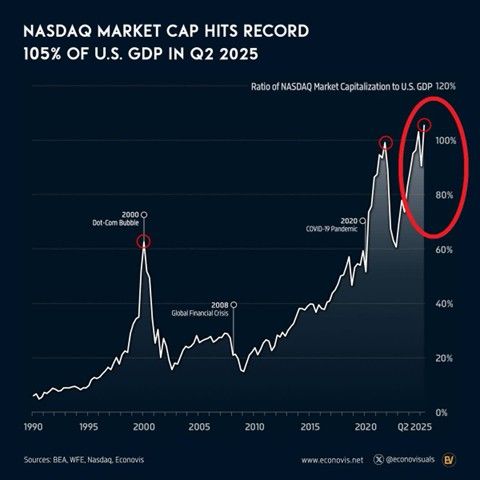
The Nasdaq has hit a record level relative to the U.S. economy.
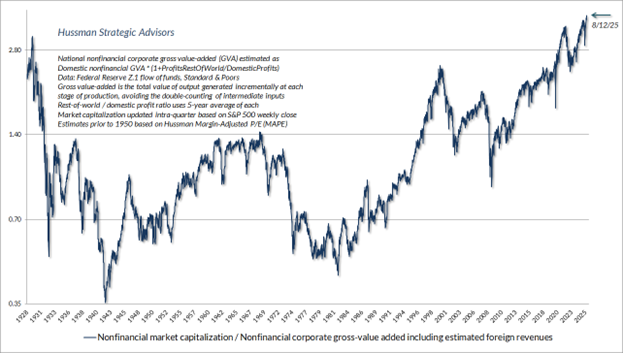
Dr. John Hussman’s version of Total Market Cap/GDP (chart above) is at an all-time high. Hussman substitutes national non-financial corporate gross value added for the total market cap. He uses the chart above to create the chart below.
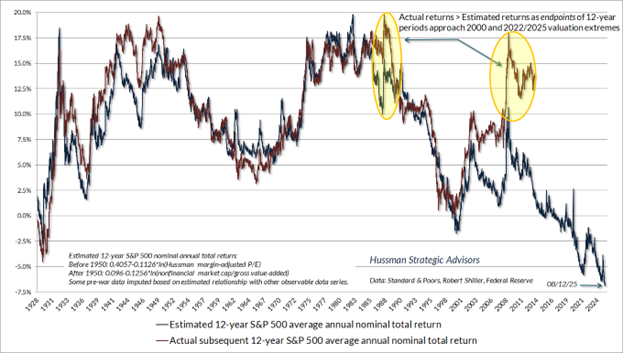
There are half a dozen good predictors of 10- to 12-year returns. The metric above is one of them. It forecasts 12-year returns. Actual returns (red line) trail forecast returns (blue line) by 12 years because it is a 12-year forecast. Warren Buffett’s favorite expected return metric is a variation of Hussman’s chart above. Buffett likes to use Market Cap/GDP. He’s on record as saying that it’s dangerous when market cap rises to more than 140% of GDP. Currently, the ratio is above 200%.
We can apply math as well to calculate long-term returns with reasonable accuracy. (The chart above is just math in picture form after all).
Over the past 10, 20 and 30 years, nominal GDP, S&P 500 revenues, and corporate gross value added have grown by about 4.5% annually. The current S&P 500 dividend yield is about 1.2%. So if valuations remain at current extremes forever, the expected return will be 4.5% + 1.2% = 5.7%. Returns will fall if valuations fall. Valuations almost certainly will fall back to long-run averages at some point. Investors shouldn't count on earning more than 5.7% per year at most. Break-even over the next 12 years isn't out of the question either.
But what's taking the S&P 500 so long to fall back to its long-term average valuation?
The chart above is a log chart, which means zero represents the average. The S&P 500 has been trading well above its long-term average since the late 1990s. Why? The answer is loose monetary and fiscal policy.
The Federal Reserve maintained loose monetary policy as the economy tried to recover from the dot.com bubble. It exploded its balance sheet from $850 billion to $4.9 trillion during the Great Recession. It exploded its balance sheet again during Covid, allowing it to reach almost $9 trillion.
In Dr. Hussman’s words:
“Since 1950, the amount of Fed liabilities had never exceeded 10% of GDP. From 2008 to 2022, the Fed took that percentage from just under 6% of GDP to a wild-eyed, deranged 32% of GDP by early 2022. The Fed has gradually tapered that back to about 22% today.”
The massive increase in the Fed's balance sheet over the last 25 years has led to financial asset price inflation. A major reason why the stock market has been trading above its long-term average valuation for so long.
Loose fiscal policy is the second reason the stock market has traded well above its long-term average valuation for most of the last 25 years.
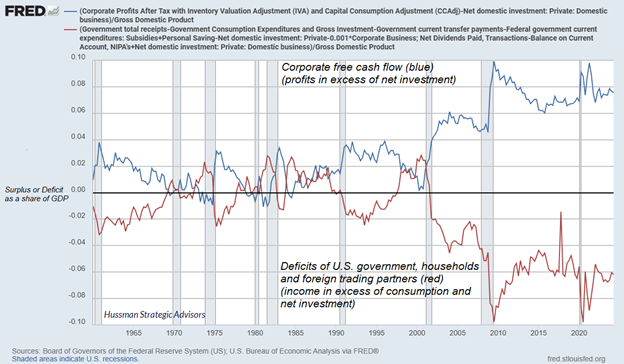
Accounts must balance. When one sector runs a deficit, another sector must run a surplus. The U.S. government has gone on a spending spree that has enriched corporations. It has also enriched consumers who own stocks and houses. Massive budget deficits have resulted in high profit margins and high corporate free cash flow. There is no productivity miracle here. Rather, it’s an accounting identity that must hold true because the books must balance.
Eventually, the ultra-loose monetary and fiscal policies will come to an end. A country can’t grow its deficit faster than its economy indefinitely. As always, it is the timing that is in question.
Warning: Overvaluation is a poor market timing tool. Norwood Economics doesn't recommend trying to time the market. Instead, Norwood Economics stands ready to buy good companies whenever they go on sale. We focus on the long-term while building diversified portfolios for our clients.
Regards,
Christopher R Norwood, CFA
Chief Market Strategist