Executive Summary
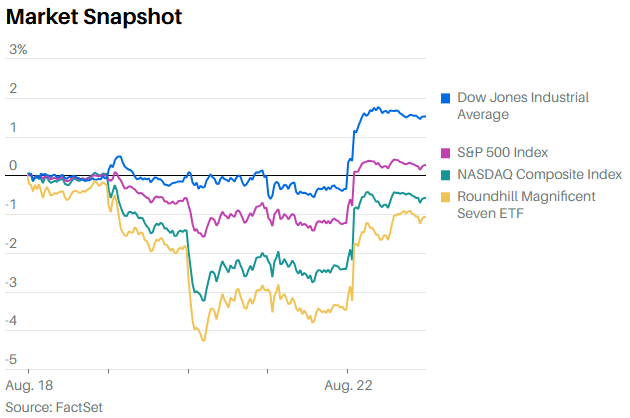
- The S&P 500 rose 0.3% last week to close at 6466.91
- The CME FedWatch tool initially raised the chances of a September rate cut to 84.7%
- The stock and bond markets opted to buy Fed Chairman Powell’s Friday morning speech
- Investors now seem certain that the Fed will start cutting again
- The current five-year breakeven is 2.48%
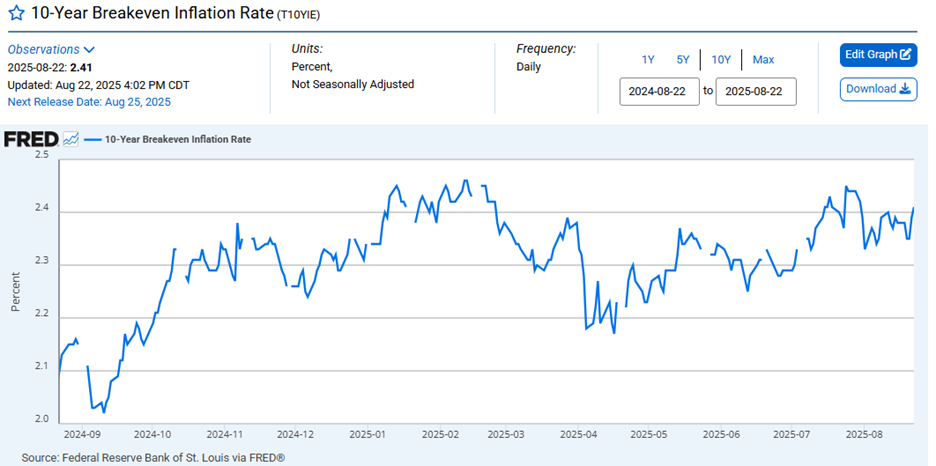
- The 10-year breakeven is 2.41%
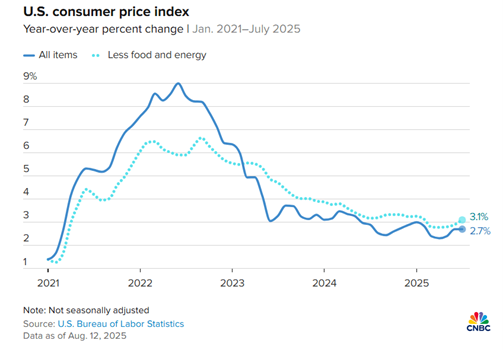
- The core Consumer Price Index (CPI) is 3.1%
- Disinflation appears to be over as the inflation rate is no longer falling
- The St Louis Fed’s Financial Stress Index is negative 0.8153. A negative number means below-average financial market stress
- The real 10-year interest rate is falling. Money is getting cheaper.
- The Fed’s balance sheet is shrinking, but is still 22% of GDP
- An indebted economy can’t withstand high interest rates
The Stock Market

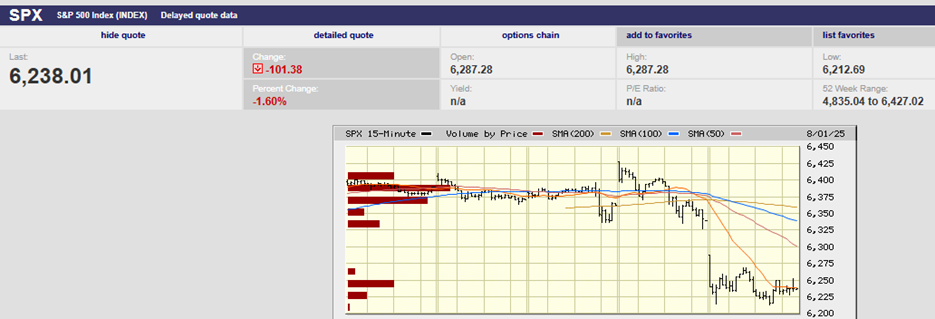
S&P 500 5-Day Chart
The S&P 500 rose 0.3% last week to close at 6466.91. The Dow rose 1.5% and hit a record high. The Nasdaq fell 0.6% for the week despite a big gain on Friday. We wrote last week that, “The early selling on Wednesday and again Friday increases the odds of a down week. The slow stochastic has rolled over, and there are negative divergences in Relative Strength and On-Balance Volume.” The S&P did fall 1.2% through the first four days of the week. Friday changed the trajectory, though.
Fed Chairman Powell’s Friday morning speech bailed the market out. Powell waxed dovish, according to attendees of the Jackson Hole powwow. Stocks and bonds surged as investors responded to the increased chance of a September cut. The S&P 500 scored a 1.5% gain on Friday to make it back into the black for the week.
The CME FedWatch tool raised the chances of a September rate cut to 84.7% on Friday. The probability of a cut backed off to 75.0% by Saturday.
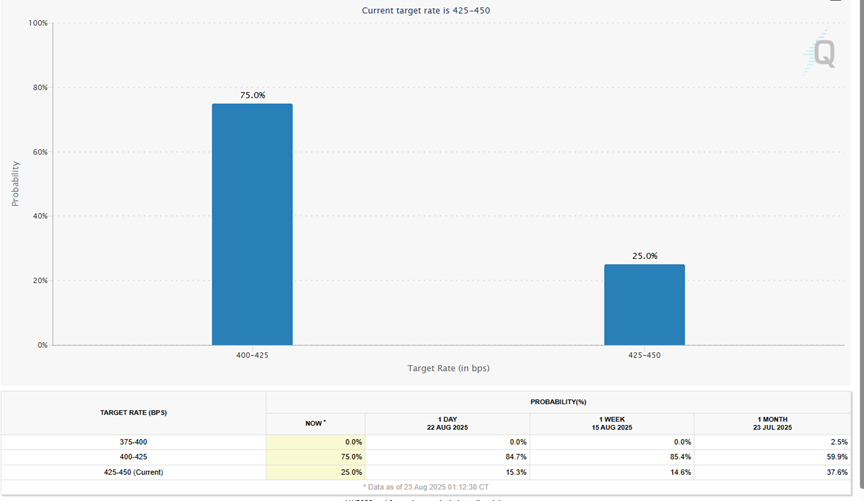
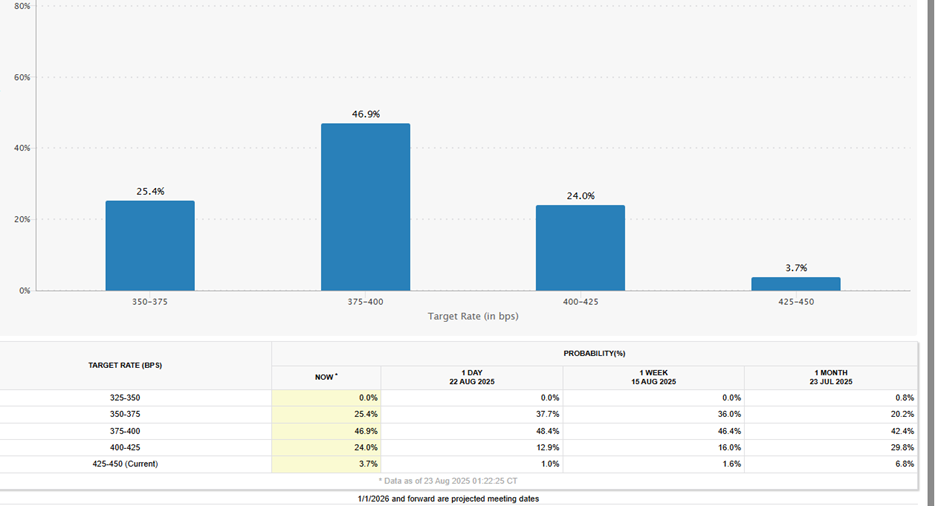
The FedWatch tool has the odds at 72.3% of at least two and perhaps three more cuts by year-end.
The stock market opted to buy the speech. The bond market did as well. The dollar weakened. Big bets were placed or unwound depending on traders’ positioning before the speech. The major moves were driven by Powell’s description of the labor market. According to Barron’s, he described the labor market as being in “a curious kind of balance that results from a marked slowing in both the supply of and demand for workers.” That, Powell said, could lead to “sharply rising layoffs and unemployment.”
Investors now seem certain that the Fed will start cutting again. But is there really a case for cutting? Norwood Economics has its doubts. In the words of Barron’s Randall Forsyth:
“By any measure, the markets are partying hearty, with stocks hitting records, corporate credit spreads at quarter-century lows, plus myriad signs of speculative fervor. Those include margin debt topping $1 trillion for the first time, the revival of initial public offerings (most of which have experienced big opening-day price pops), record options activity, and even the revival of special purpose acquisition companies (SPACs), or blank-check companies for the next big thing. Those are hardly the circumstances suggesting the need for easier money.”
Too loose a monetary policy matters because inflation is the result. A pernicious tax on everyone, but particularly the poor and the elderly.
Norwood Economics provides financial planning to its clients as part of its wealth management services. One of the most important inputs is the expected average inflation rate over the planning period. Most of our clients are in their 50s or older, but that still means planning periods of twenty to forty years. A small change in the inflation assumption makes a big difference in our clients’ ability to meet spending goals in retirement. Our MoneyGuide Pro software is using 2.50% for younger clients currently. It’s using 2.68% for older clients (a shorter planning period, higher inflation rate starting point). Both estimates are likely to be too low. The U.S. debt and ongoing deficits make it likely the U.S. government will allow inflation to remain higher than the Fed’s stated 2% goal.
The current five-year breakeven is 2.48%. (One-year chart below)
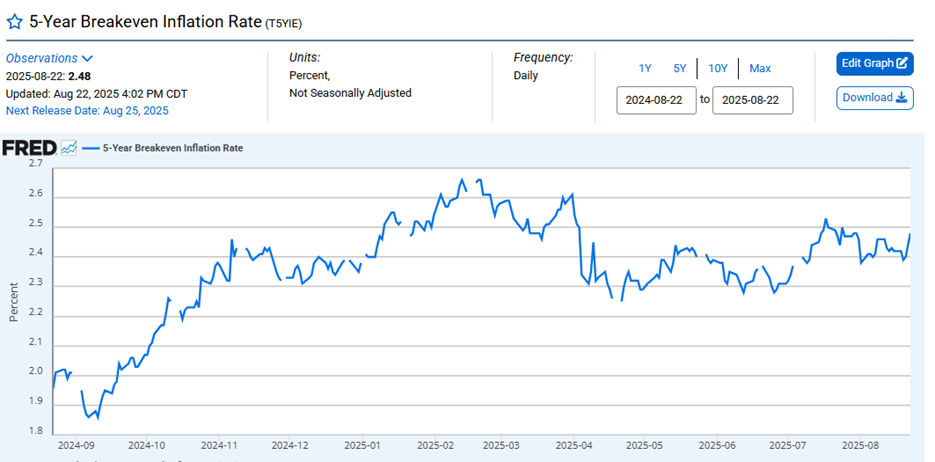
The breakeven rate is the bond markets estimate of average inflation over the five-year period.
The 10-year breakeven is 2.41% (one-year chart below)
The core Consumer Price Index (CPI) is 3.1% on a year-over-year basis.
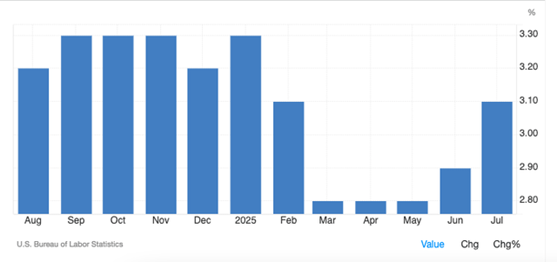
Disinflation appears to be over as the inflation rate is no longer falling.
Yet the Fed looks as if it is moving to cut interest rates in September. A rate cut despite inflation remaining well above the 2% target. What’s more, financial conditions are already loose.
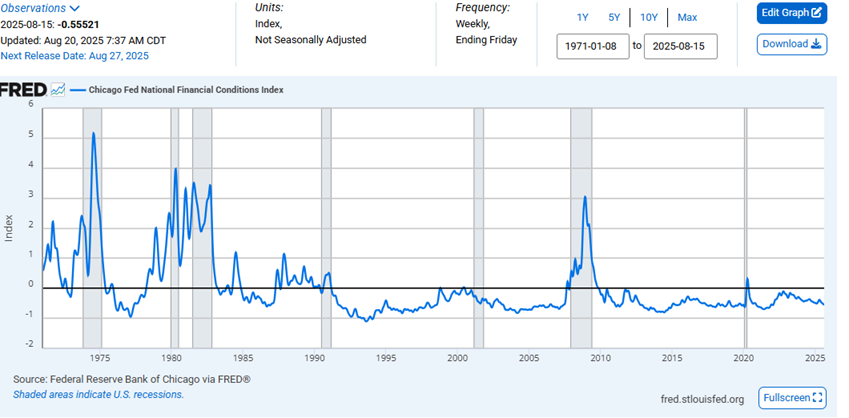
A negative number means financial conditions are looser than average. The Chicago NFCI is negative 0.55521. The NFCI is described by the Fed as, “a comprehensive weekly update on U.S. financial conditions in money markets, debt and equity markets and the traditional and "shadow" banking systems.”
There doesn’t appear to be any financial stress either (chart below).
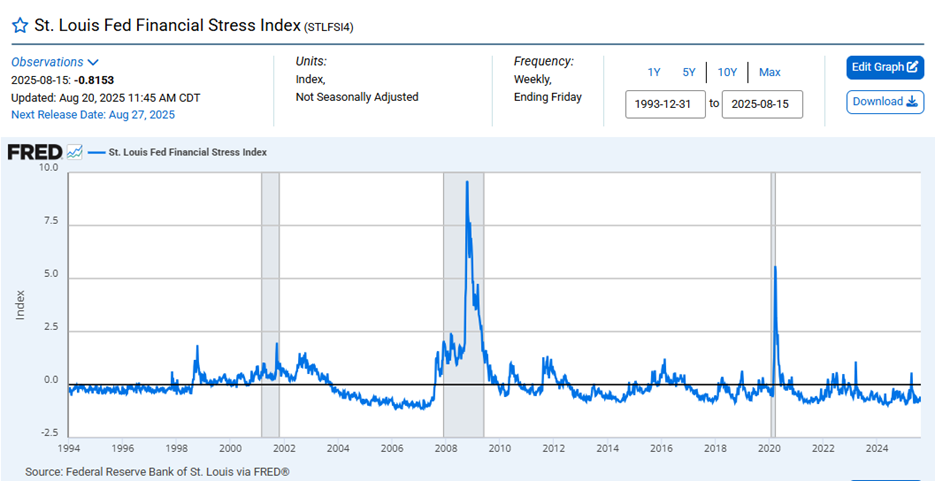
(The St Louis Fed’s Financial Stress Index is negative 0.8153. A negative number means below average financial market stress. The index measures the degree of financial stress in the markets and is constructed from 18 weekly data series: seven interest rate series, six yield spreads and five other indicators. Each of these variables captures some aspect of financial stress.)
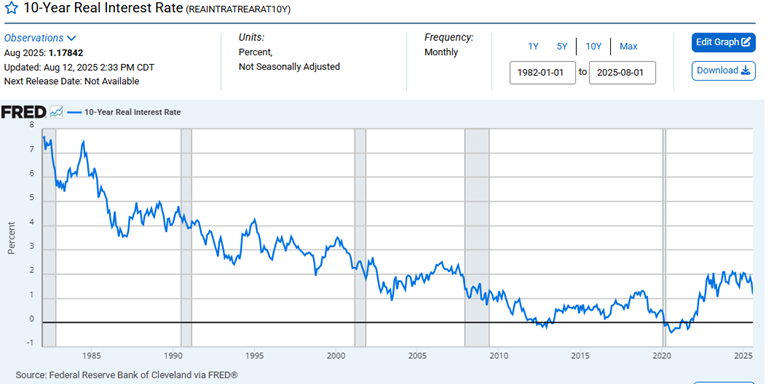
The real 10-year interest rate is falling. The real rate is the nominal rate minus inflation. It is the true cost of money. Money is getting cheaper.
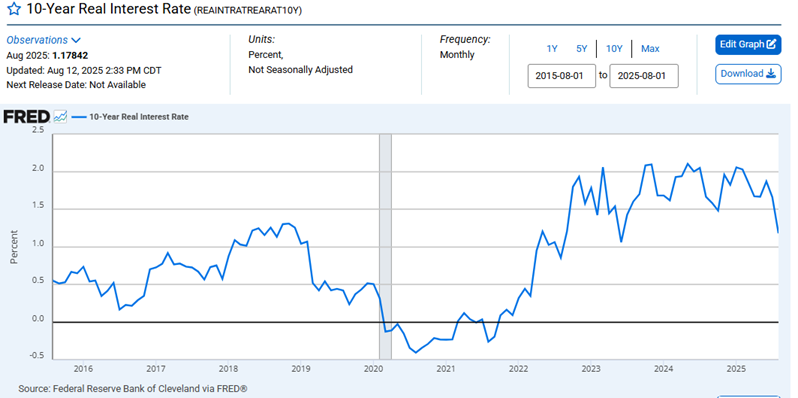
The real rate might look high based on the last 10 years, but it isn’t. (chart below)
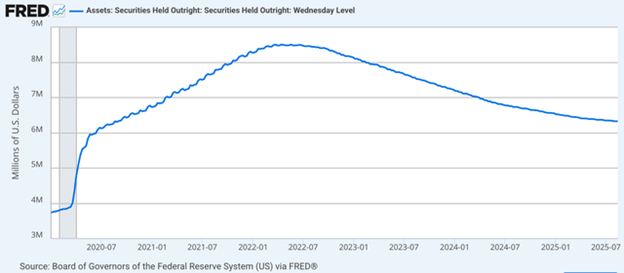
Likewise, the Fed’s balance sheet is still shrinking, but from a high level. We pointed to Dr. John Hussman’s recent comments about Fed liabilities. (The dollar is a liability on the Fed’s balance sheet). “Since 1950, the amount of Fed liabilities had never exceeded 10% of GDP. From 2008 to 2022, the Fed took that percentage from just under 6% of GDP to a wild-eyed, deranged 32% of GDP by early 2022. The Fed has gradually tapered that back to about 22% today.” In other words, there is plenty of liquidity in the system.
The case for rate cuts is weak. There is a real possibility of higher long-term rates if the Fed cuts. Bond investors have yet to cast their vote. Investors would be signaling that inflation isn’t dead. They would be signaling that monetary policy is too loose. The bond vigilantes might ride once again as they did in the 1980s and 1990s. They did already show up for a time last year.
Rate cuts at the short end, accompanied by rising long-term rates, is known as a bear steepener. We saw a bear steepener a year ago when the Fed last cut. The Fed’s 2024 rate cuts had the unusual effect of causing 10- and 30-year Treasury yields to rise rather than fall. A combination of factors caused yields to climb. Those factors included persistent inflation, strong economic data, and a growing U.S. budget deficit.
We may see a bear steepener again in 2025 if the Fed cuts rates in September. Rising long-term rates would hurt the economy and the stock and bond markets. The yield curve is fairly flat right now. The chart below shows the spread between the 30-year and 3-month Treasuries. It’s at a historically tight 0.66%. The chart below also shows that the 30-year tends to peak between 2.4% and 4.5% above the 3-month Treasury yield.
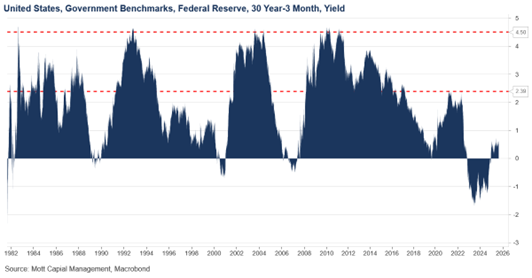
The Fed Funds Futures are pricing a Fed Funds rate of about 3% by the end of 2026. The 3-month Treasury tends to match the fed funds rate. The math shows us that the 30-year Treasury yield should peak in a range of around 5.4% to 7.5%. That is well above the current 30-year yield of 4.89%.
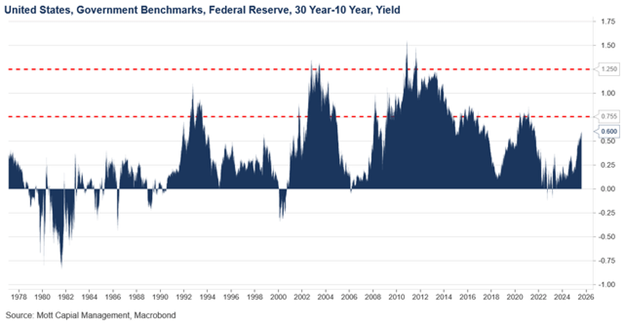
The same type of analysis tells us that the 10-year Treasury yield has room to rise. The spread between the 30-year and 10-year peaks is between 0.75% and 1.25% (chart below). That suggests a range of 4.65% to 6.25% if the 30-year is between 5.4% and 7.5%. The 10-year Treasury yield is currently 4.26%.
Additionally, the 10-year tends to peak between 2% and 3.75% above the 3-month Treasury bill.
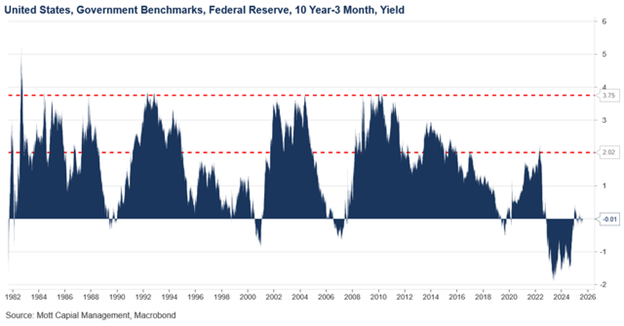
Assuming a fed funds rate of 3% by year-end 2026, the 10-year range should be between 5% and 6.75%. This suggests that the 10-year rate is also currently too low at 4.26%.
The above analysis indicates that Barron’s Forsyth is pointing out a real danger. A danger that would hurt the economy, bond, and stock markets. He wrote:
“After the end of Powell’s chairmanship, the likely combination of an accommodative monetary policy to support an expansive fiscal policy could produce a higher yield on the benchmark 10-year Treasury—higher than anyone in the administration, or on Wall Street, expects.”
An indebted economy can’t withstand high interest rates. The cost of servicing the U.S. debt is already nearing $1 trillion. The Fed’s case for cutting is weak. Investors shouldn't assume the entire yield curve will fall once the Fed starts cutting. A bear steepener will have negative consequences for the financial markets and the economy.
Regards,
Christopher R Norwood, CFA
Chief Market Strategist