Executive Summary
- The S&P 500 rose 1.1% to close the week at 6715.79
- The Nasdaq was down 0.3% last week
- The Dow Jones Industrial Average was up 1.99%.
- The government shutdown materialized on Wednesday
- The Fed is expected to cut the funds rate by another quarter point in October
- Unemployment isn’t rising, and consumers are still spending
- Recession red flags
- The last 18 years have been unusual
- A recession is not Norwood Economics’ base case

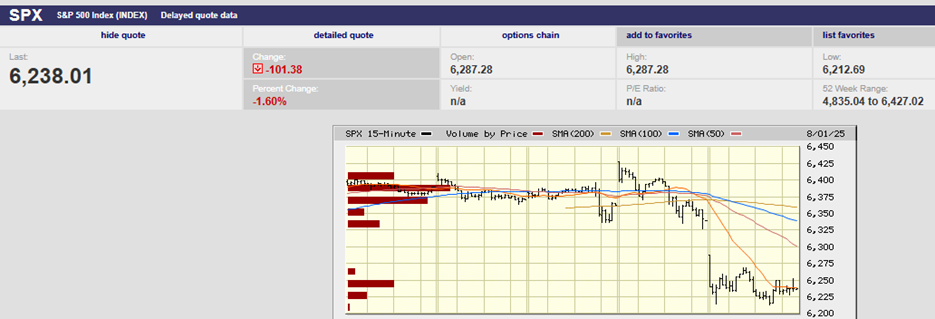
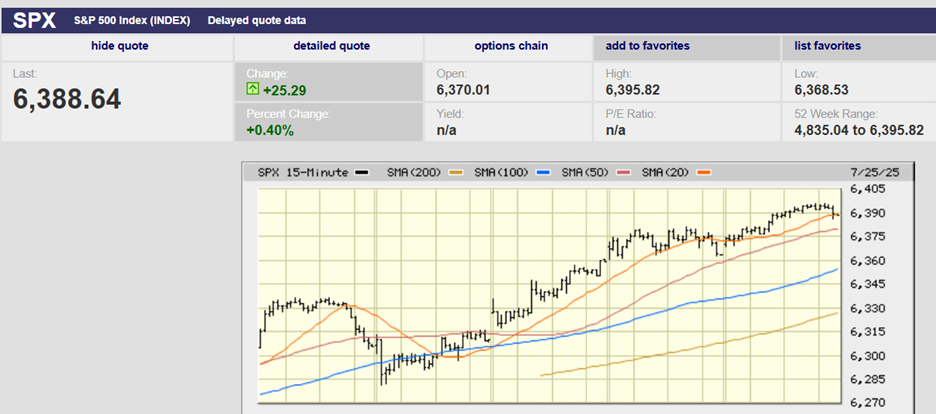
S&P 500 5-Day Chart
The S&P 500 rose 1.1% to close the week at 6715.79. The index is up 14.18% year-to-date.
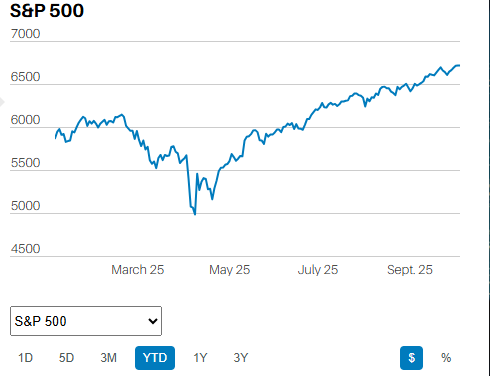
S&P 500 Year-To-Date
It is up 17.82% over the trailing 12 months and 100.56% over the trailing five years.
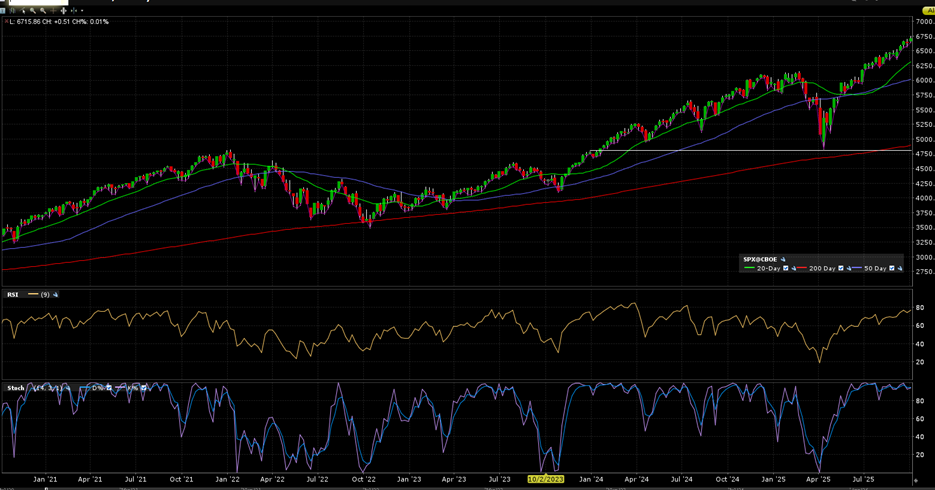
S&P 500 5-Year
The Nasdaq was down 0.3% last week. The Dow Jones Industrial Average was up 1.99%. S&P 500 earnings are expected to rise by 6.4% in Q3 and 9.9% for 2025, according to LSEG. The consensus estimate for 2026 earnings growth remains a lofty 14%.
Another government shutdown materialized on Wednesday. Economists estimate a shutdown will reduce growth in inflation-adjusted real GDP by 0.1 to 0.2 percentage points each week the shutdown persists. Yet the Congressional Budget Office (CBO) calculated that the 2019 shutdown only cost the economy $3 billion for Q4 2018 and Q1 2019. That number amounted to 0.02% of lost annualized GDP.
More importantly, consumption data for August showed solid spending. Also, BofA’s debit and credit data point to continued consumer spending momentum into September. So did Ward’s automotive sales figures. BofA wrote that the data taken together point to 3% annual growth in spending for the third quarter. The bank upped its real GDP estimate to 2.7% from 1.5% last week. The Atlanta Fed's GDPNow model is estimating 3.8% real growth for Q3.
Yet the Fed is expected to cut the funds rate by another quarter point in October despite the above trend growth in the economy. The CME FedWatch tool places the odds of a quarter-point cut at 96.2% as of 4 October. A weakening jobs market is the catalyst for more cuts. The August payroll number came in at 22,000, well below the 73,000 jobs reported in July. Additionally, the three-month moving average for job growth was just 29,000 a month through August. Jobs growth in June and July was reduced as well. June’s job growth fell to 14,000 from 147,000.
Yet unemployment isn’t rising, and consumers are still spending.
The Federal Reserve Bank of Chicago’s latest forecast of the real-time unemployment rate shows little change. Its measure of the September unemployment rate was 4.34%, little different from August’s 4.32%.
The September jobs report was a no-show because of the government shutdown. ADP put out its estimate of private payroll changes as usual. The number was a weaker-than-expected decline of 32,000 for September.
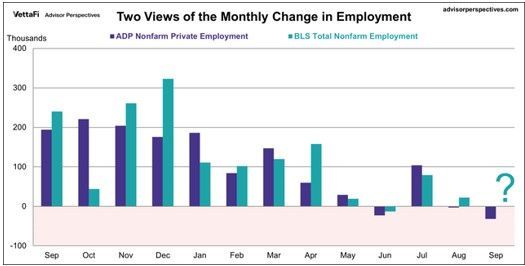
The downturn in ADP’s jobs number wasn’t apparent in other data, though. A newer measure of total U.S. employment, the Revelio Public Labor Statistics (RPLS) report, was released Thursday. Revelio’s report indicated that the economy added approximately 60,000 jobs last month. Revelio is a provider of workforce analytics. Its report showed that the number of employees notified of layoffs declined in September. That conclusion was supported by data from Challenger, Gray & Christmas. Revelio Labs estimates that the BLS would have reported approximately 38,000 jobs gained in September. The estimate was generated using a regression model built on historical correlations between the RPLS and ADP data.
It’s unknown how long the government shutdown will last. The Fed is likely to cut in October. It’s less certain to cut in December, especially if the government shutdown is ongoing. For our part, we’re watching the bond market. Rising long-term interest rates would force the Fed to stop cutting. Norwood Economics thinks it is at least as likely that long-bond rates will rise as fall.
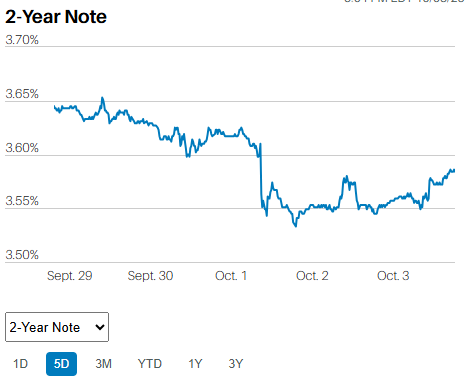
The 2-Year Treasury yield fell to 3.57% last week. It is pricing in two rate cuts in the next few quarters.
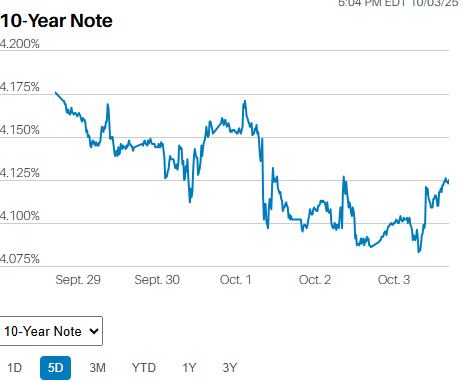
The 10-Year Treasury yield ended the week at 4.12%.
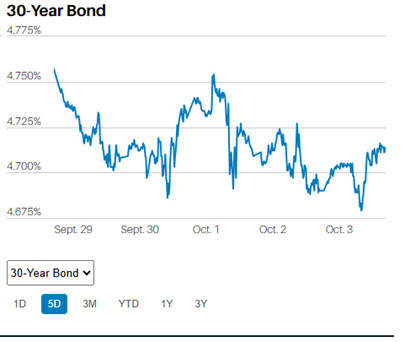
The 30-Year Treasury yield finished the week at 4.71%.
A move back above 5% for the 30-year and into the high 4s for the 10-year would pressure consumers and businesses looking to borrow. The economy is too indebted to withstand higher long-bond yields for long.
Where’s the Recession?
The short answer is in the future. The question is when, not if, we’ll have another recession. Last week, we showed three charts that point to low stock returns in the coming decade. This week, we’ll highlight some of the factors that might lead to a recession in the next 12-18 months.
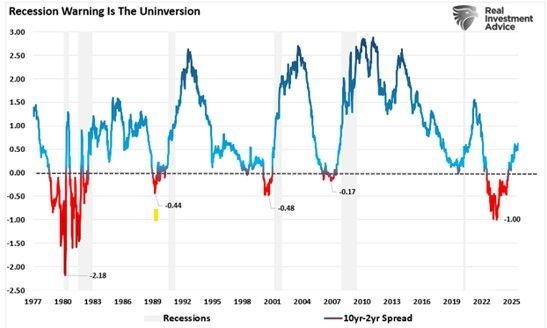
First, the yield curve is un-inverting, a sign that a recession is likely in the next year or so. Since the late 1960s every sustained inversion has been followed by an economic contraction. The inversion that began in 2022 was the deepest and longest we’ve ever experienced.
Manufacturing is a second red flag. Manufacturing has been in contraction for most of the last three years. The ISM Manufacturing Index is a leading indicator. It recorded 26 months in a row below 50 through early 2025. It turned positive for a short period earlier this year before rolling over into contraction again.
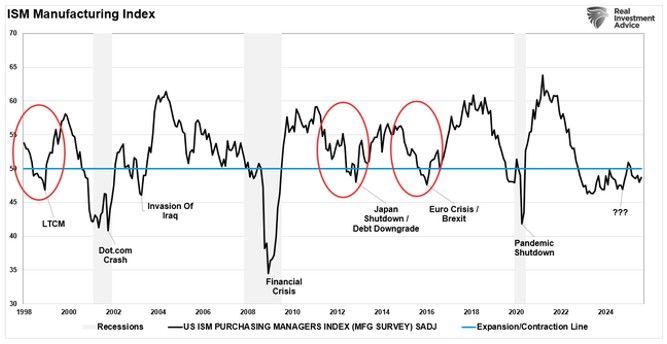
Persistent weakness in manufacturing shows up in corporate earnings, hiring, and consumer confidence eventually.
Crisis-level government spending is another red flag signaling a heightened possibility of recession. The federal government can’t run deficits of 6% to 7% forever. The government is on pace to spend around $2 trillion it doesn’t have in fiscal 2025, according to the CBO. That represents 6.2% of GDP. Spending will have to be reined in. Reduced government spending (whenever it begins) will put pressure on the economy. After all, C+G+I+(x-m) = GDP. G equals Government spending.
The massive amount of liquidity injected into the financial system is the single biggest reason we’ve avoided a recession so far. The Federal Reserve flooded the economy with liquidity during the Great Recession. It did it again during Covid.
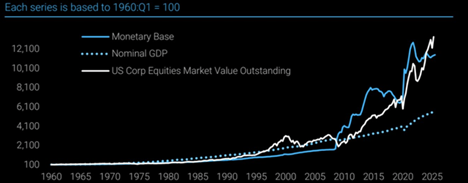
Households and businesses benefited from a zero-interest rate policy in the aftermath of the Great Recession. They also benefited from excess savings built up during the pandemic. Increased wealth from housing and the capital markets allowed consumers to keep spending. So did a tight labor market, which kept nominal wages elevated.
The ZIRP era is over though. The Fed is shrinking its balance sheet. It’s attempting to drain the excess reserves that were created in response to not one but two crises.
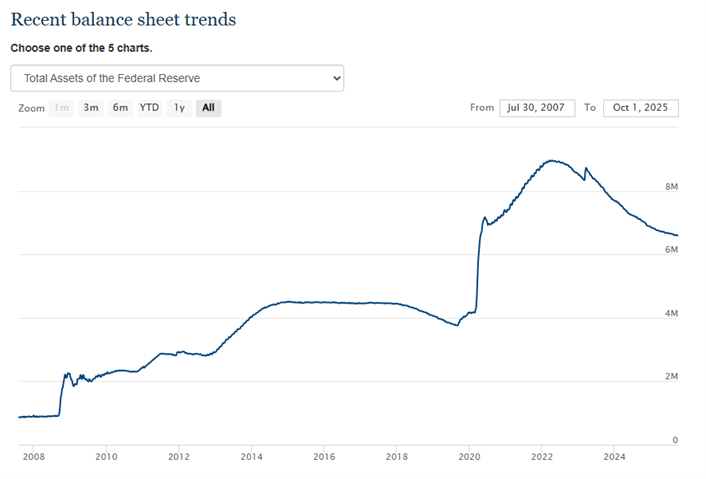
The Federal Reserve Balance Sheet
Reducing the supply of the monetary base will raise the cost of money over time. As the cost of money goes up, so do the odds of a recession when factored in with the other red flags.
The last 18 years have been unusual. Not one but two existential threats manifested themselves. First, the Great Recession, which was caused by the banking system teetering on the brink. Then came a once-in-a-century pandemic that shut down the world. The government’s response to both crises has led to an economy with too much debt and too much monetary base. They are connected, of course. The liquidity is there because of the Fed’s ZIRP policy. It is also there because of the government’s massive deficit spending. The challenge now is how to reduce deficit spending while continuing to drain excess reserves from the financial system. Reducing both the monetary base and deficit spending without throwing the economy into recession is the challenge. The Federal Reserve and the federal government must walk a fine line. The odds of a recession over the next few years are higher than normal. The likelihood of a policy mistake is higher than normal as well. Still, a recession is not Norwood Economics’ base case. A slow-growth economy is more likely if the public policy makers don’t make any major mistakes.
(None of this newsletter is intended as specific or appropriate investment advice. Consult a financial planner or advisor for advice that may be appropriate for your situation.)
Regards,
Christopher R Norwood, CFA
Chief Market Strategist