

Executive Summary
- The S&P 500 rose 1.2% last week to finish at 6,664.36
- The S&P 500 is up 13.31% year-to-date
- The S&P is expensive
- The Fed updated its “Dot Plot”
- The 10-year yield rose last week despite the Fed’s rate cut
- The Fed is signaling at least two more rate cuts by year's end
- A pullback of 10% or so wouldn’t be unusual, but there’s no data signaling recession yet
- The top ten most expensive S&P 500 companies make up over 39% of the market cap
- UBS economists estimate a 93% chance that the US will slip into a recession this year
- Investors should review their portfolios before the next bear market
The Stock Market

S&P 500 5-Day Chart
The S&P 500 rose 1.2% last week to finish at 6,664.36. The Nasdaq climbed 2.2% to 22,631.48, and the Dow finished up 1.1% to 46,315.27. Oil futures fell to $62.72 per barrel by Friday, while gold rose to $3719.40 per ounce. The S&P 500 is up 13.31% year-to-date.
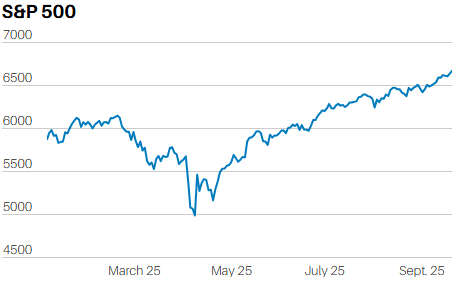
The S&P 500 is up 37.8% since the 7 April low. It has returned 100.77% over the trailing 5 years. S&P 500 earnings in 2025 are forecast to increase by 10.4%. Earnings are forecast to rise 13.8% in 2026. The price-to-earnings ratio based on 2026 earnings is 22 times. The average price-to-earnings ratio, based on 12-month forward earnings, is approximately 17. The S&P is expensive, and earnings growth expectations are high.
See last week’s newsletter for more on market valuation and why stocks rise over the long run.
Gold is up 39% year-to-date. Oil futures are down 14.2% year-to-date.
The Federal Reserve surprised no one by cutting the fed funds rate by 0.25% on Wednesday. It’s widely believed that the Fed will cut at least two more times in 2025. The CME FedWatch Tool has the odds at 91.9% that the Fed will cut another quarter point at its October meeting. The odds of a December cut are currently 78.6%. Yet, the case for rate cuts is not at all clear.
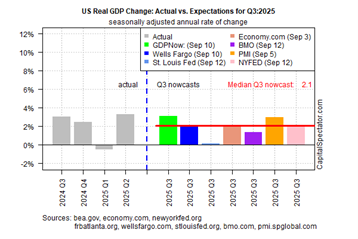
Financial conditions are loose already. (Norwood Economics has detailed that fact in past newsletters). The GDPNow forecast estimates 3.3% growth in Q3. A collection of GDPNow models estimates Q3 GDP of 2.1%.
The stock market is hitting record highs (a leading indicator). Gold is hitting record highs, perhaps sniffing out more inflation in the pipeline. Unemployment is low at 4.3%. Consumer spending is still strong, with retail sales growth of 0.6% in August. Credit spreads are near record tights, indicating plenty of liquidity for corporations.
And the chart below suggests that inflation is not whipped yet. It also suggests that the labor market is weakening. Stagflation is possible in the coming quarters.
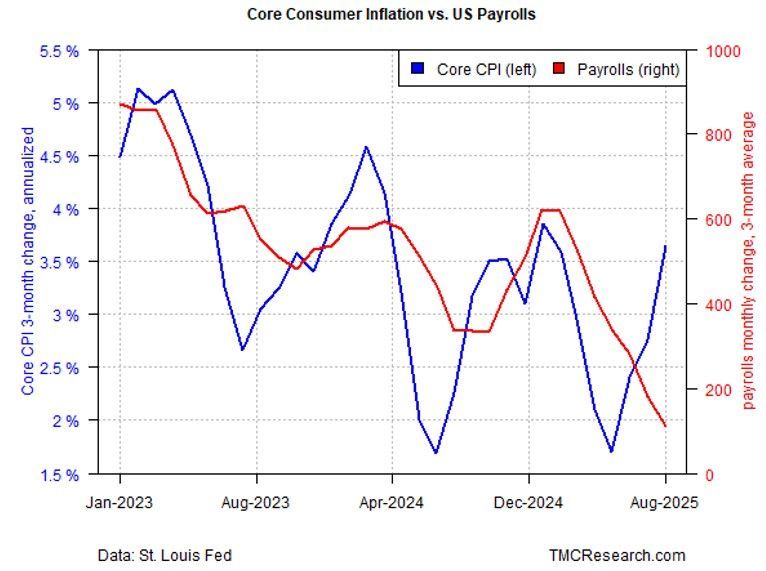
The core CPI has accelerated in each of the three-month updates through August (blue line above). But the average 3-month change for non-farm payrolls (red line) has been sliding since February. It fell in August to the weakest level since late 2020, according to market strategist James Picerno.
Meanwhile, the Fed did update its “Dot Plot” at last week’s meeting. The Summary of Economic Projections (SEP) gives investors more clarity on monetary policy. Or at least that is the intent. The median forecast for GDP growth for 2025 was 1.6% rising to 1.8% in 2026. Unemployment is expected to rise to 4.5% by year's end before falling back to 4.4% in 2026. Anything under 5% is generally considered full employment. The core Personal Consumption Expenditures Price index (PCE) is expected to rise to 3.1% by year's end. The Fed sees core PCE falling back to 2.6% in 2026 and reaching its target of 2.0% by year-end 2028. The Fed is guessing on all three data points. It's well known that the Fed's forecasts are usually off, often by a significant amount.
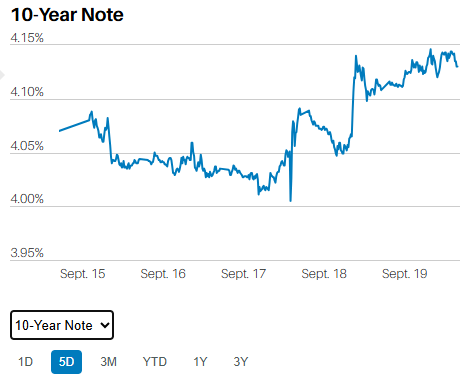
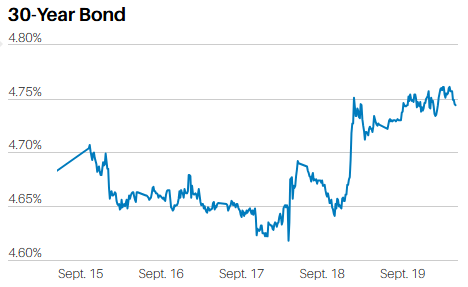
We have cautioned investors to watch the longer end of the bond market as the Fed resumes its rate cut cycle. Last year, the Fed cut rates by 1%. It cut 0.5% in September 2024, followed by quarter-point cuts in November and December of 2024. Long bonds rose in response. The 10-year Treasury yield bottomed at 3.65% before rising as high as 4.8% on January 14th, 2025. The 30-year bottomed at 3.7% on Friday, September 20th, 2024, before rising as high as 4.9% in January 2025. The 30-year bond broke above 5% for a short period in July 2025 and spent the next three months testing the 5% level. It failed to break above 5% though and now yields 4.75%.
The Federal Reserve had great freedom to lower rates during the low inflation that followed the Great Recession. It would cut the fed funds rate, and the entire yield curve would fall. Last year was different. This year might be different as well.
The 10-year yield rose last week despite the Fed’s rate cut.
The 30-year yield rose as well.
There is a real possibility that the long end of the yield curve will fail to cooperate with the Fed’s rate cut program. Rising long bond yields would force the Fed to halt rate cuts once again. Large fiscal deficits and rapidly rising debt levels are at least partially to blame for rising yields at the longer end of the yield curve. Diminishing trust in the U.S. as a haven for foreign capital is also likely a factor. The Fed is signaling two to three more rate cuts by year's end. The long end of the yield curve may not react well to more Fed rate cuts. It may be forced to stop cutting once again despite not having reached its “R star” target of 3.0%. (R-star, or the real neutral rate of interest, is the unobservable, theoretical real interest rate that would prevail when an economy is at full employment and stable inflation, meaning monetary policy is neither expansionary nor contractionary.) Yes, I just rolled my eyes. Good monetary policy based on unobservable, theoretical real rates. Does anyone else think that's a pipe dream?
Loose monetary and fiscal policy likely means the stock bull market has further to run. Momentum is strong. A pullback of 10% or so wouldn’t be unusual, but there’s no data signaling recession yet. Nor is there any evidence that the market is running out of steam. It is a dangerous time for investors, even so.
Much of what follows is courtesy of Danielle Parks, CFA, reader’s digest version:
The S&P 500 has averaged a 5-year annualized earnings growth rate of 7% since 1950. Today, S&P 500 pricing assumes a forward 5-year annualized earnings growth rate of 15% (Rosenberg Research). The S&P 500 is trading at more than 23x 5-year forward earnings expectations, according to Parks. That’s around 28% above the longer-term historical average of 18x.
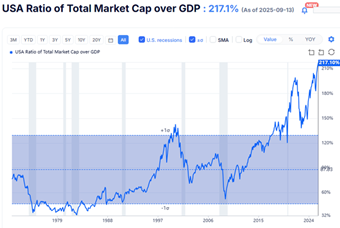
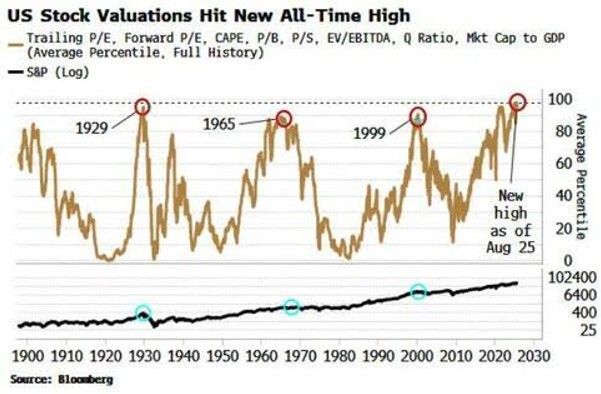
Based on all eight of the most reliable valuation measures (Trailing P/E, Forward P/E, CAPE, price to book, price to sales, EV/EBITDA, Q Ratio, and Market Cap to GDP), the stock market today is the most richly valued since at least 1900, according to Parks. The current value of the S&P 500 is comparable only to the infamous bubbles of 1999, 1965, and 1929 (see red circles).
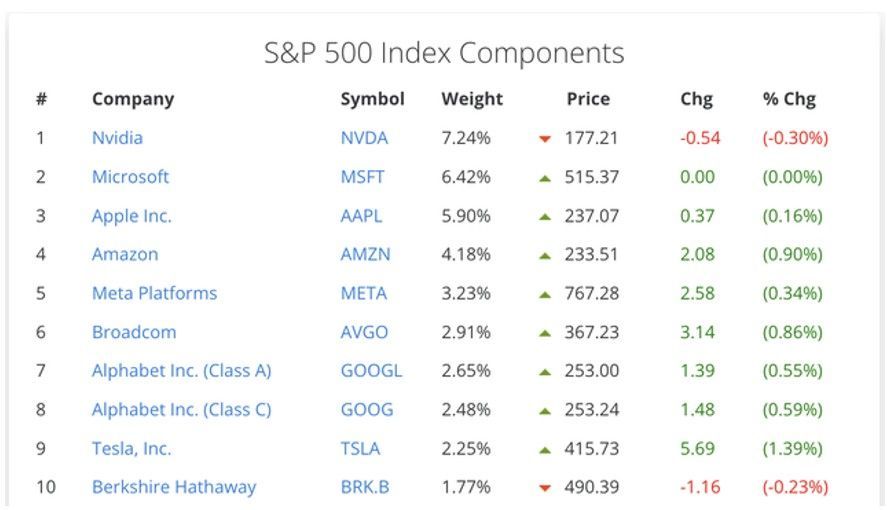
And then there is the concentrated nature of today’s S&P 500 index. According to Parks, the top ten most expensive S&P 500 companies make up over 39% of market cap. The top ten made up less than 30% at the last tech bubble peak in March 2000, Parks points out. The top 5 most expensive (all tech companies) make up 27% (this was 12% in the 1965 secular market peak).
It’s an expensive and concentrated market. And the America public is gorging on stocks.
Those over the age of 55 own an estimated 80% of all stocks and stock funds, according to Parks. Households have an estimated 72% of their financial assets in stocks with just 7% in bonds, and 20% in cash (Rosenberg Research). The stock market will turn down eventually. It always does. Many individual investors will discover that risk is real when the next bear growls.
“Recession risks are growing,” says Pimco economist Tiffany Wilding. She, like many others, does not have a major slowdown as her base case. She does believe that “the economy is more vulnerable to any kind of negative shock.”
“The tariffs are certainly hurting, but they’re not quite bad enough to get us to that recession,” says Samuel Tombs, chief US economist at Pantheon Macroeconomics.
“The labor market is more vulnerable today than at any point in this expansion,” says Ryan Sweet, chief US economist at Oxford Economics. He believes the US will avoid a recession. He also believes that the economy is susceptible to a slowdown. Sweet points to the sudden weakness in the labor market as a growing risk.
UBS economists, by contrast, have a darker view of the near-term outlook, according to Barron’s. They estimate a 93% chance that the US will slip into a recession at some point this year. Moody’s chief economist Mark Zandi said the alarm bells are ringing. He thinks the odds of a downturn in the next 12 months are “uncomfortably high.”
Investors should review their portfolios. They should examine how diversified they are. They should ask themselves how big a loss they can tolerate. The time to adjust your portfolio is before the bad stuff hits. Far too many investors will get caught out when the next bear prowls. They'll learn the hard way that rightsizing risk in their portfolio is crucial to long-term investing success.
Regards,
Christopher R Norwood, CFA
Chief Market Strategist


