Executive Summary
- The S&P 500, Nasdaq & the Dow Jones fell last week
- President Trump tanked the market Friday with a post about trade talk troubles with China
- The S&P 500 still has a lot of momentum, though
- Bond investors aren’t expecting a recession any time soon
- The Atlanta Fed GDPNow tool is estimating 3.8% real GDP growth for Q3
- The AI boom is increasingly dependent on circular cash flows
- The U.S. stock market has a lot of exposure to AI
The Stock Market

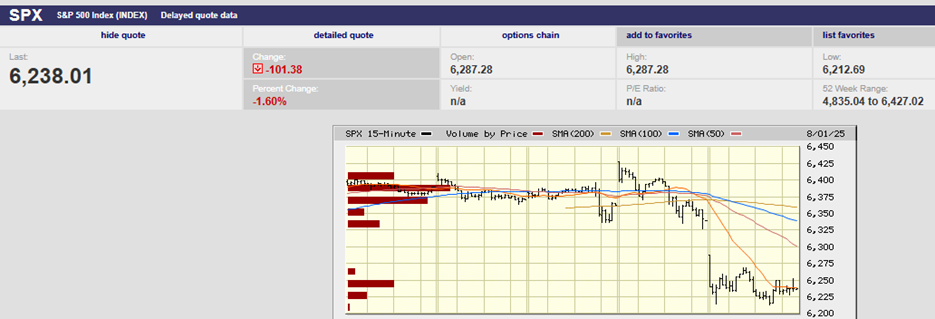
S&P 500 5-Day Chart
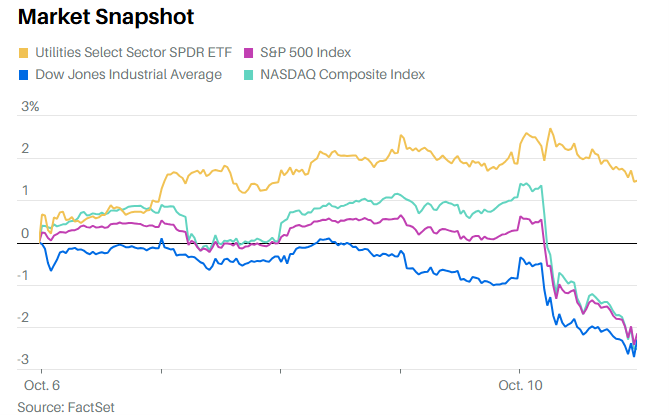
The S&P 500 fell 2.4% last week to close at 6552.51. It lost 2.71% on Friday as President Trump posted about trade talk troubles with China. The Dow fell 2.7% and the Nasdaq lost 2.5% last week.
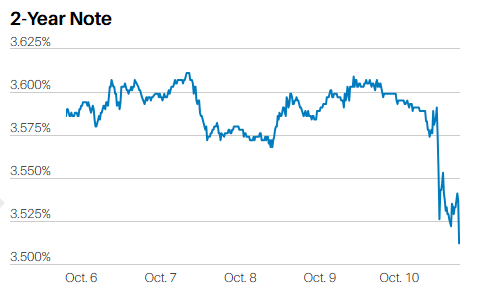
The 2-Year Treasury yield finished the week at 3.51%.
The 10-Year fell to 4.04%.
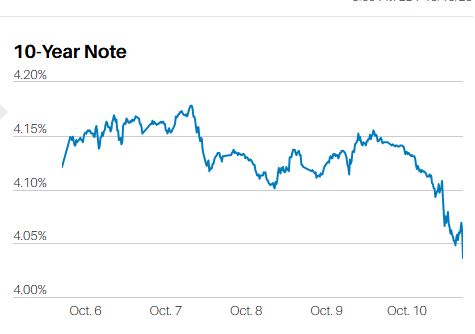
The 10-Year Treasury could fall below 4%, but likely only in the short term. The 10-Year yield is likely to move higher over the longer term as bond investors demand a higher term premium. Higher term premiums compensate investors for the increased risk of inflation.
The S&P 500 has been on a tear. A period of consolidation would be normal, a sideways period. So would a 5% to 10% pullback.
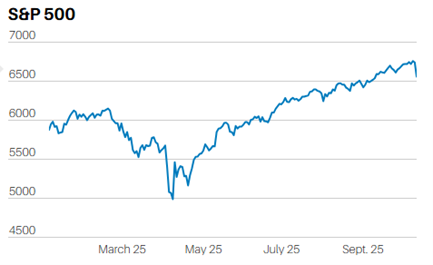
The S&P 500 YTD
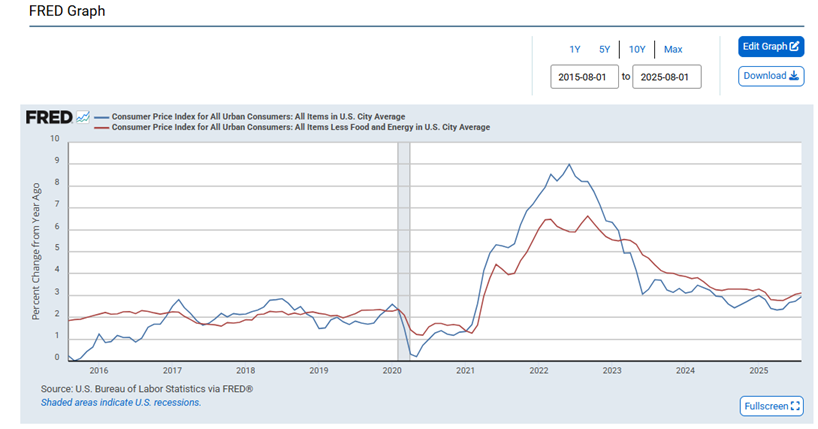
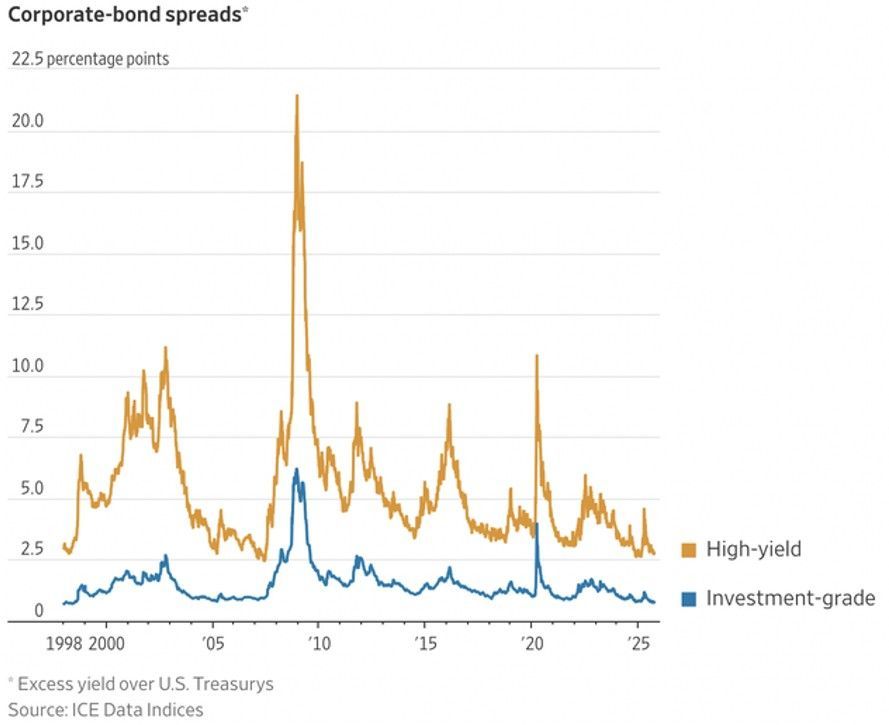
But a deeper correction seems less likely. The stock market has some serious momentum. Corporate interest rate spreads are near all-time lows. Bond investors aren’t demanding much yield over Treasuries. That is a sign they aren’t expecting a recession any time soon.
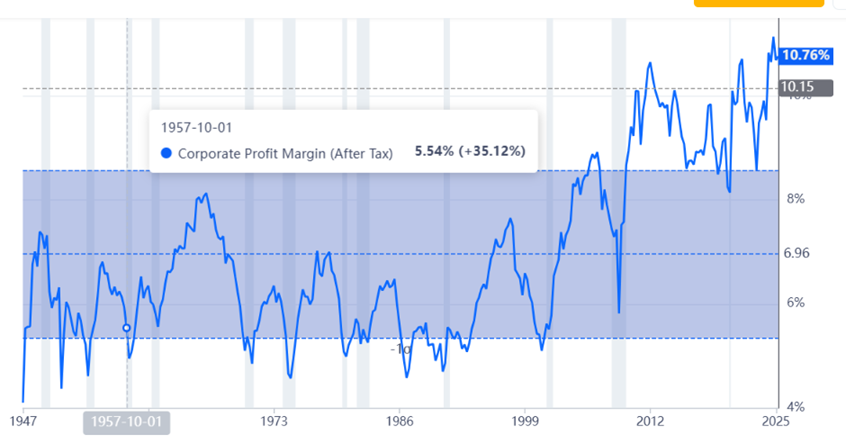
As well, the economy seems to be growing above trend. The Atlanta Fed GDPNow tool is estimating 3.8% real GDP growth for Q3. Analysts project 6.4% annual sales growth for the S&P 500 from the end of 2025 through 2027, according to FactSet. Analysts expect earnings growth of 14% over that period. Earnings growth outpacing sales growth implies higher margins, which is unlikely. Margins are already at record highs.
Earnings estimates will fall. But in this invest-for-the-short-term world, that’s a problem for next year. The Fed is set to cut again in both October and December. The CME FedWatch tool is putting the odds of a quarter-point cut at 98.3% and 91.7% respectively.
The big news last week was the Friday sell-off following Trump’s post. Monday will see either a continuation of the sell-off or a sharp rebound. It will depend on the rhetoric over the weekend. China is blaming Trump for escalating the trade war. It has announced it will retaliate if Trump follows through with the 100% tariffs. As of Sunday afternoon, it doesn't look promising for an upmarket Monday.
Meanwhile, the AI boom is ongoing. Ominously, “vendor financing” is back, or at least a version. NVIDIA is investing in its customers so that they have the money needed to buy NVIDIA chips. CoreWeave is Nvidia’s largest investment. CoreWeave purchases large quantities of Nvidia GPUs. Nvidia invests in CoreWeave, and CoreWeave sends the money back in exchange for chips. A circular flow of cash. Vendor financing with a twist.
Nvidia is also providing OpenAI with $100 billion, according to Barron’s. Some of the money will doubtless go towards buying Nvidia chips. Meanwhile, OpenAI has received an equity stake in AMD in exchange for buying AMD chips.
OpenAI and Oracle recently struck a deal as well. OpenAI must buy large amounts of computing power from Oracle. The contract is valued at $300 billion over a five-year period starting in 2027. OpenAI has negative cash flow. It doesn’t expect cash flow to turn positive until 2029. Much of the money OpenAI will use to buy Oracle computing power will come from investors. That's assuming OpenAI can continue to find investors for its money-losing business. OpenAI has raised $64.1 billion so far, some $40 billion in 2025 alone. The Oracle contract is at risk should funding dry up. Not good for Oracle, not good for the entire AI buildout.
And OpenAI needs all the outside money it can get, a lot more money. It has deals to build 16 gigawatts of data centers, according to Barron’s. Based on Wall Street estimates, they are likely to cost about $750 billion. Altogether, OpenAI is now on the hook for roughly $1 trillion of spending. That's roughly 3.4% of 2024 U.S. gross domestic product, or about a quarter of all nonresidential private investment. Again, OpenAI is expecting to have negative cash flow for years to come. It's starting to sound a bit like 1999.
Adam Levine of Barron’s wrote this about OpenAI’s commitments:
OpenAI has committed to building 16 gigawatts of data centers through its deals with Nvidia and AMD. The last two nuclear reactors built in the U.S., Georgia’s Vogtle 3 and Vogtle 4, each generate 1.1 gigawatts. The reactors were originally budgeted at $14 billion over eight years. The final tally exceeded $30 billion, and they took 15 years to build. It would require 15 of these reactors to power OpenAI’s ambitions.
There are many obstacles to the “Great AI Buildout”. First, there isn’t enough power available. Power will be a bottleneck for OpenAI and the rest of the AI players for years to come. Then there is the possibility returns on AI investments will remain negative for years to come also. The hyperscalers might stop spending hundreds of billions if profits prove elusive. Investors might punish them if they can't earn a reasonable return on investment. Dwindling free cash flow and compressed margins aren't usually rewarded by Wall Street.
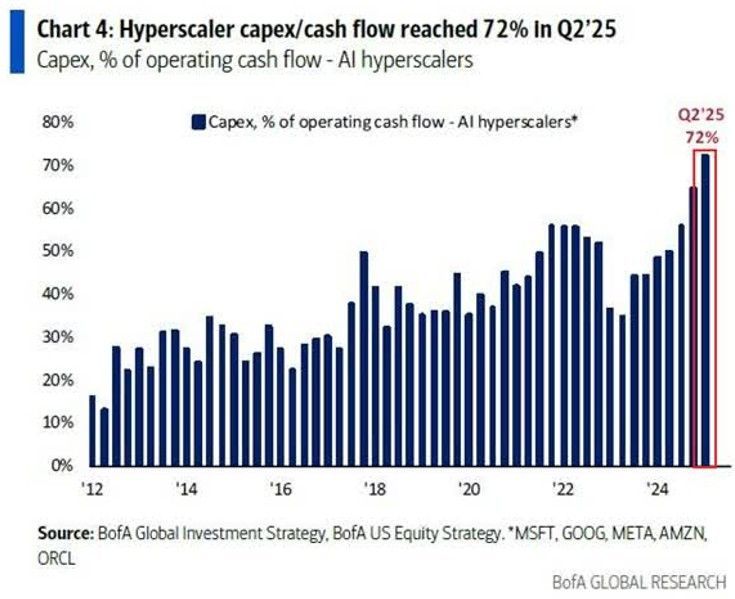
Currently, the hyperscalers are “all in” on the big AI bet. (see chart above).
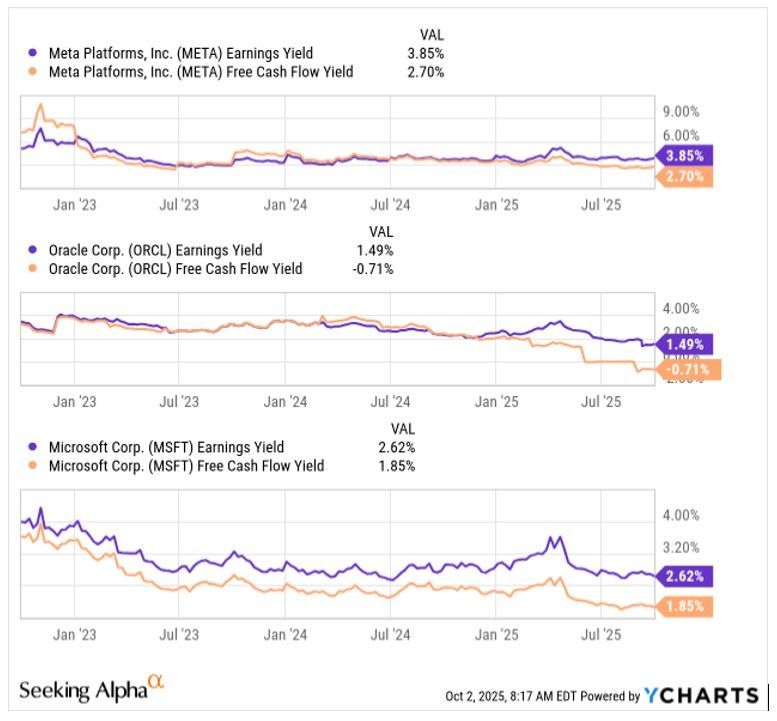
And their stocks are highly valued based on earnings yield and FCF yield (see chart below).
The massive AI capex of the last few years will start showing up in earnest on income statements soon. All the big spending hyperscalers will see a rapid increase in depreciation. Depreciation impacts reported earnings. ORCL is a good example. Revenues grew 12% year-over year. Net income was flat, though. The culprit was depreciation, which was up 68% year-over-year. (see chart below).
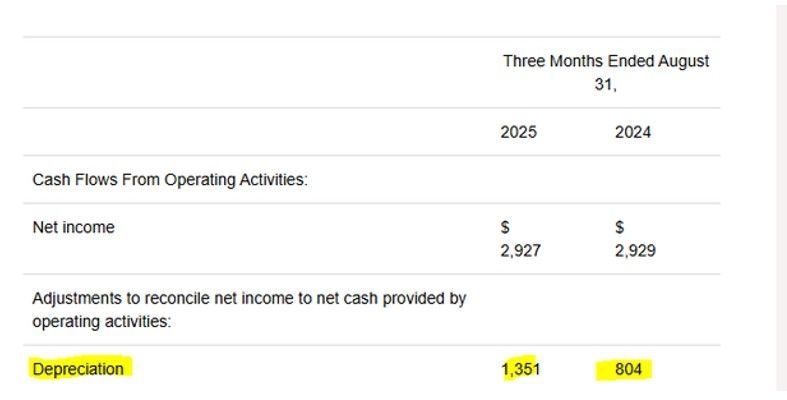
Depreciation is a non-cash charge that accounts for assets wearing out over time. Those assets must be replaced. Depreciation is a real expense. Technology has a shorter shelf life than most other types of assets. Capital expenditures must keep up.
The hyperscalers and companies like OpenAI are spending heavily. They believe that profits will follow. They also believe there's a first-mover advantage. The C-suite folks see it as a race. First mover at all costs. The motivation is the pot of gold at the end of the rainbow. But is there a pot of gold? Nvidia and Taiwan Semiconductor are indeed immensely profitable, but they’re selling picks and shovels. What about the companies that hope to profit from the actual use of AI? So far, there is little evidence that big profits will start to flow any time soon.
Currently, Large Language Models (LLMs) are loss-making. What’s more, prices are falling. One analyst described the GPT-5 launch last week this way:
“The revenue concentration comes into sharp focus as OpenAI launched GPT-5 this week with dramatically lower pricing that could undercut Anthropic's premium positioning. Early comparisons show Claude Opus 4 costs roughly seven times more per million tokens than GPT-5 for certain tasks, creating immediate pressure on Anthropic's enterprise pricing strategy and potentially threatening its hard-won dominance in AI coding.”
The analyst also pointed out that there is international competition. He specifically mentioned the Chinese AI company DeepSeek. He wrote in last week’s note that:
OpenAI is expected to blow through $8-$14 billion in 2025 and 2026 while charging 25 times DeepSeek's output price.
A lot is riding on loss-making OpenAI’s spending plans materializing. And it's not just the AI industry that needs to cross its fingers. The U.S. stock market is as concentrated as it's ever been. That concentration centers increasingly around AI.
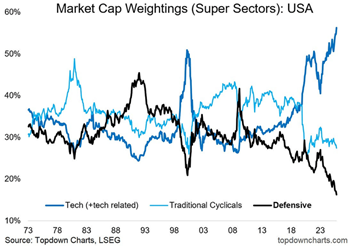
What happens if OpenAI and a handful of interrelated companies find themselves unable to execute on their spending plans? One possible consequence is an ugly correction in the Tech sector that would have a big impact on the entire S&P 500. (see above chart).
(None of this newsletter is intended as specific or appropriate investment advice. Consult a financial planner or advisor for advice that may be appropriate for your situation.)
Regards,
Christopher R Norwood, CFA
Chief Market Strategist