The Jobs Report Friday Could Spark a Rally or Sell-off
Christopher Norwood • September 2, 2025

Executive Summary

  • The S&P 500 finished down 0.1% at 6,460.26 last week
  • The S&P is up 9.8% on the year. Industrials and Communication Services are leading the way
  • Personal income rose in line with expectations for July, climbing 0.4% up from 0.3% the prior month
  • A weak payroll number on 5 September means a Fed rate cut on 17 September
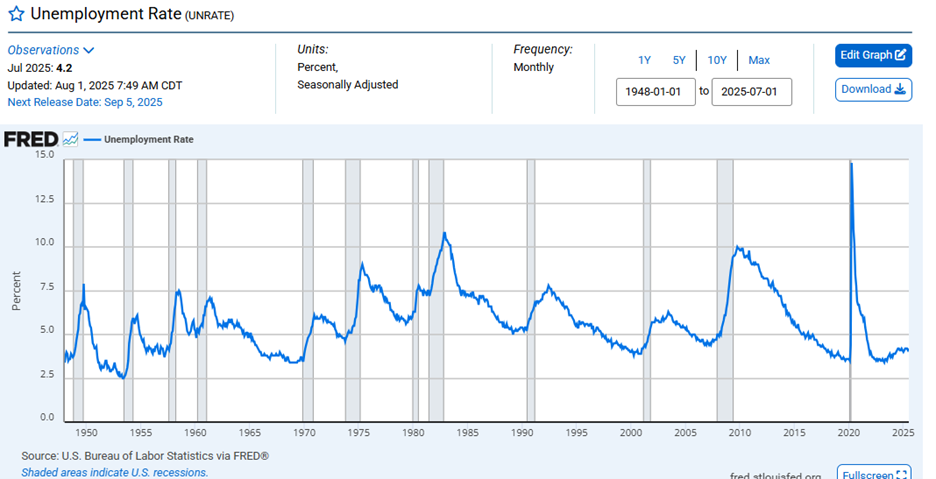
  • Unemployment is expected to rise, but it is still low relative to history
  • Wage growth close to 4% will make it hard for inflation to fall to 2%
  • The predictions market has the odds of a recession at 8%
  • The ICE BofA US High Yield Index spread is near all-time lows
  • A bear steepener is increasingly likely. A bear steepener is when the yield curve falls at the short end but rises at the long end

S&P 500 5-Day Chart


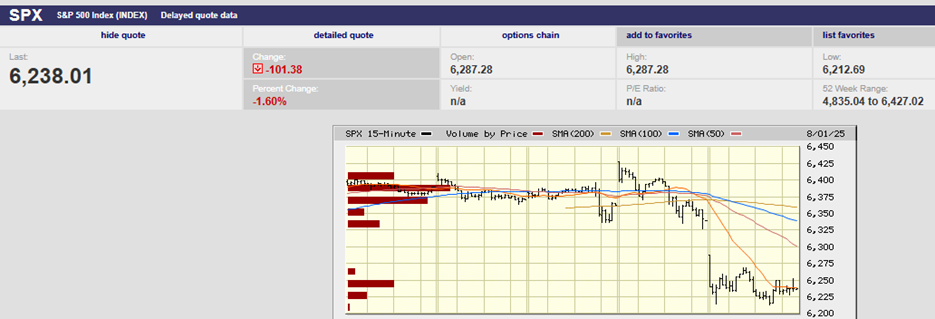
The S&P 500 finished down 0.1% at 6,460.26 last week.  The index peaked for the week at 6,508.23 on Thursday. It gapped down at the open on Friday, giving back all its weekly gains by Friday’s close.

The S&P is up 9.8% on the year. Industrials are leading the way with a return of 15.37% year-to-date. The top stock in 2025 in the industrials sector is GE Vernova, which used to be part of GE. It’s up 86.35% in 2025. GE Aerospace is the second-best performer, up 65.0%. Communications Services are the next best sector with a gain of 15.06%. Communications services include Netflix, Meta, and Alphabet. Netflix is the top-performing stock in the communications services sector. It's up 35.56% year-to-date. AT&T is third with a gain of 28.63% year-to-date.


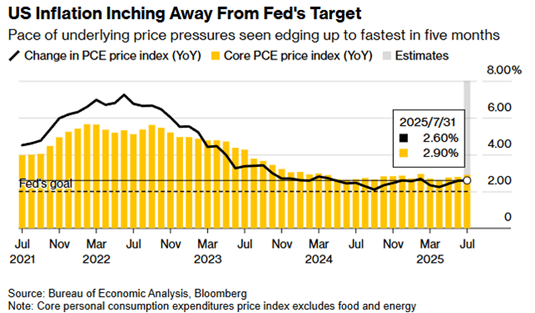
Friday’s selloff might have been due to the economic data released before the open. The most important data was the Personal Consumption Expenditures Index (PCE). The index rose 0.2% in July, down from a 0.3% rise in June. The year-over-year number was 2.6%, unchanged. The core PCE number rose 0.3% in July, as expected. The year-over-year number rose to 2.9% from 2.8%, also as expected. The Fed’s target is 2.0%. It doesn’t appear as if the PCE data was the culprit, given the lack of negative surprises.


Personal income rose in line with expectations for July, climbing 0.4% up from 0.3% the prior month. Personal spending rose 0.5%, up from the prior month’s 0.4%, but again in line with expectations. It doesn’t appear as if the rest of the data out Friday morning gave investors a reason to sell either. Let’s call it good old-fashioned profit-taking.


The payrolls number on 5 September should shed light on the Fed’s rate decision on 17 September. A weak report will make a rate cut a foregone conclusion. The CME FedWatch tool places the odds of a quarter-point cut at 86.4%, up from 84.7% a week ago. The Jobs report on Friday is expected to show an increase of 75,000 in August, up from 73,000 the prior month. A stronger-than-expected jobs report could spark a sell-off. Investors are leaning hard into a rate cut. A strong jobs report would create doubt. Investors hate uncertainty.


Unemployment is expected to rise to 4.3% from 4.2%. Anything under 5% is low relative to history, though.

Also, producer and consumer inflation data come out before the Fed meeting. Producer data comes out on the 10th. Consumer inflation data is reported on the 11th. Hourly wages are forecast to rise by .3% in August and 3.7% year over year. Hourly wages rose 3.9% year-over-year last month. Wage growth close to 4% will make it hard for inflation to fall to 2%.


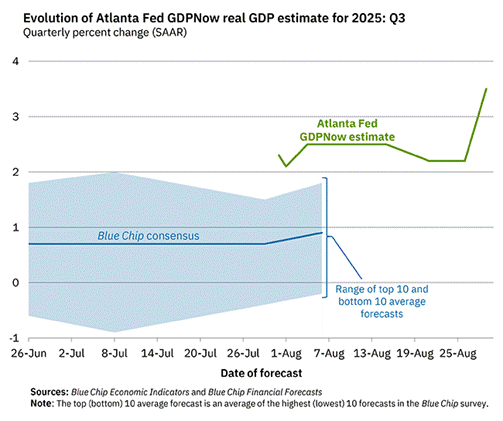
The recent economic data doesn’t provide a reason to cut the Fed funds rate. Second quarter GDP was revised up last Thursday to 3.3%. The original number reported was 3.0%. The Atlanta Fed’s GDPNow tool is estimating Q3 growth of 3.5%, well above trend.

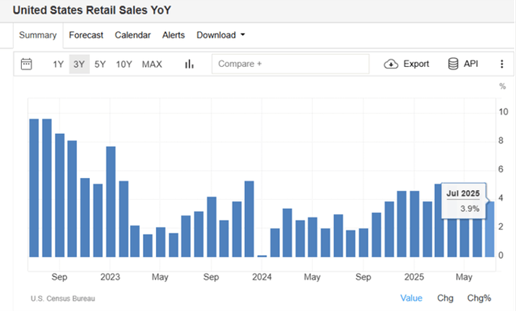
Retail sales in July were up 3.9% on a yearly basis.

Consumers continue to spend. Imagine the Fed cutting interest rates with the current data. Unemployment is below 5%, GDP growth is above 3% and the stock market is hitting all-time highs. It looks as if we don’t need to imagine it. Instead, we seem to be about to witness it.


Meanwhile, the odds of a recession have fallen throughout the year. The predictions market has the odds at a measly 8%.

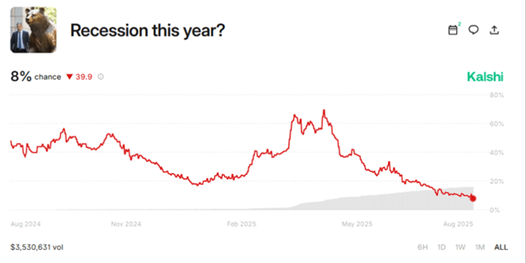
(Kalshi is an CFTC-regulated exchange dedicated to trading on the outcome of future events. From inflation, to fed rates, to unemployment, to will the government shut down, Kalshi allows people to trade on a broad range of topics.) 


Absent a recession, it's unlikely that the labor market will weaken much in the next few quarters. It’s also unlikely that the inflation rate will continue to fall in the next few quarters.

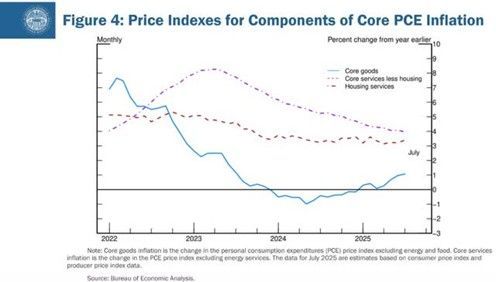
On the contrary, it appears as if the Fed’s favorite measure, core PCE, is set to continue rising. It hit a five-month high with last week’s report, rising to 2.9% on an annual basis from 2.8%.

Fixed-income investors are better than equity investors at sniffing out inflation. They are also better at gauging economic activity. Interest rate movements suggest bond investors have their doubts about inflation. They also don’t seem worried about a recession.

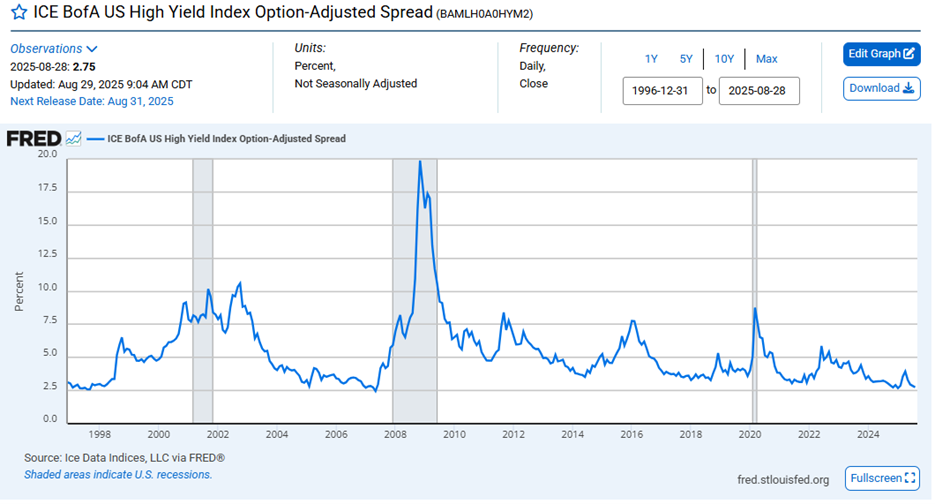
The ICE BofA US High Yield Index is near all-time lows. The index measures the spread between high-yield bond yields and the equal maturity Treasury. Tight spreads mean bond investors are not expecting economic stress any time soon. The ICE BofA Index is a leading economic indicator.

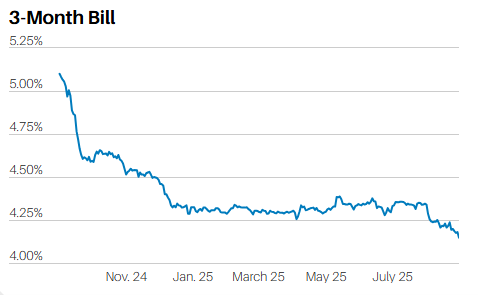
The 3-month Treasury is signaling that bond investors expect a rate cut in September. The chart above shows the 3-month yield falling below 4.25% in August.

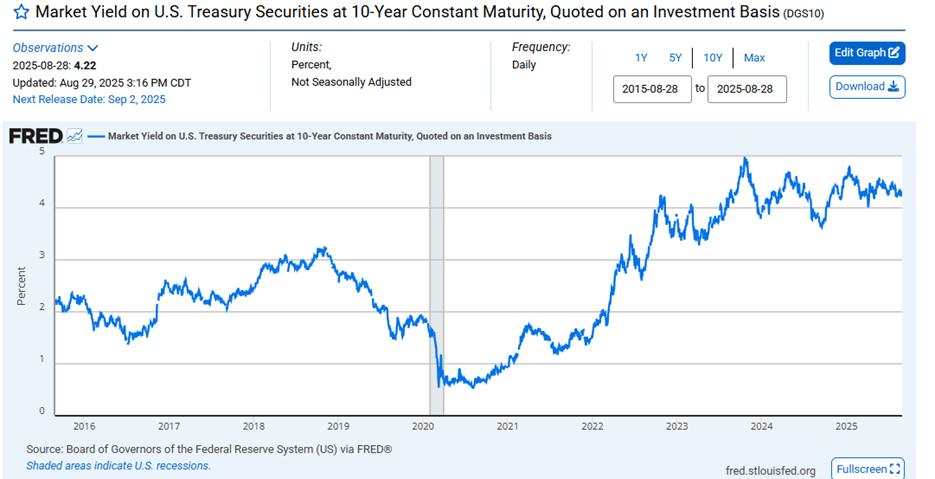
The 10-Year Treasury yield has traded for the most part in a range between 4.0% and 5.0% since the second half of 2023. Bond investors do not appear willing to bid up 10-year prices. The 10-Year yield finished Friday at 4.23%

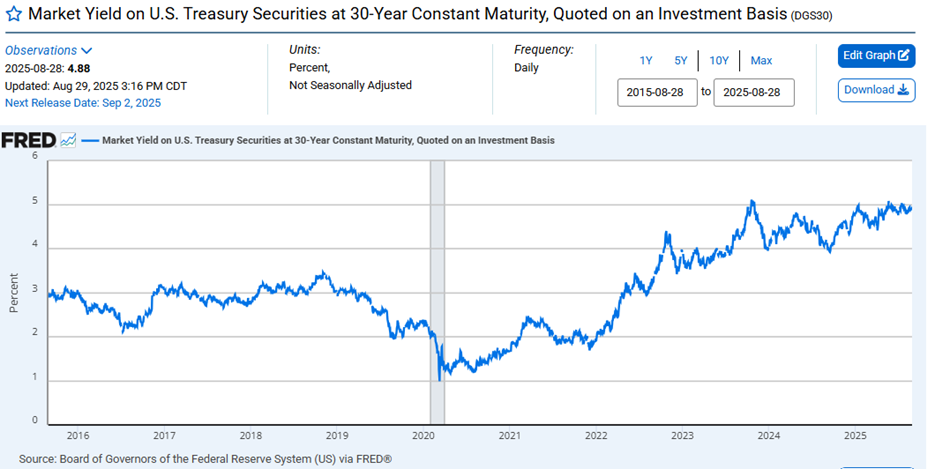
The 30-year Treasury yield is testing 5% again. It appears bond investors are expecting yields at the longer end of the curve to move higher. How the long end of the yield curve acts if/when the Fed cuts will be key to monetary policy in 2026. The 30-year finished Friday at 4.93%.


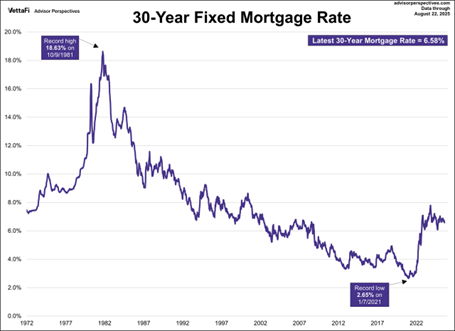
We wrote last week about the possibility of a bear steepener. A bear steepener occurs when the yield curve falls at the short end but rises at the long end. And it is longer-term rates that have the most impact on economic activity. The 10-year is particularly important since it is tied to the 30-year fixed mortgage rate. The 30-year fixed is currently around 6.58% (chart below)

Investors would do well to keep an eye on the long end of the yield curve in the coming months. A break above 5% for the 30-year and a move back toward 5% for the 10-year would likely pressure stock prices. Bond investors are historically better than equity investors at predicting interest rate movements and economic activity. They seem to be leaning toward higher long-term rates for now. And that is a risk for the equity market.


Regards,


Christopher R Norwood, CFA


Chief Market Strategist

By Christopher Norwood August 25, 2025
Executive Summary The S&P 500 rose 0.3% last week to close at 6466.91 The CME FedWatch tool initially raised the chances of a September rate cut to 84.7% The stock and bond markets opted to buy Fed Chairman Powell’s Friday morning speech Investors now seem certain that the Fed will start cutting again The current five-year breakeven is 2.48% The 10-year breakeven is 2.41% The core Consumer Price Index (CPI) is 3.1% Disinflation appears to be over as the inflation rate is no longer falling The St Louis Fed’s Financial Stress Index is negative 0.8153. A negative number means below-average financial market stress The real 10-year interest rate is falling. Money is getting cheaper. The Fed’s balance sheet is shrinking, but is still 22% of GDP An indebted economy can’t withstand high interest rates  The Stock Market
By Christopher Norwood August 18, 2025
Executive Summary The S&P 500 rose 1.01% last week to finish at 6,449.80 The stock market keeps hitting new highs Market strategists are expecting earnings growth to accelerate in 2026 Margins remain near record highs Corporate profit margins will likely take a hit from tariffs Passing tariff costs on to the consumer means raising prices Core CPI rose by 0.3% in July The PPI jumped 0.9% last month, the largest monthly increase in more than three years Buffett says it’s dangerous when the market cap rises to more than 140% of GDP. Currently, the ratio is above 200%. The massive increase in the Fed's balance sheet over the last 25 years has led to financial asset price inflation The Stock Market
By Christopher Norwood August 11, 2025
Executive Summary The S&P 500 rose 2.43% last week, climbing to 6,389.45 Interest rates didn’t move much last week The economy is slowing according to the Chicago Fed National Activity Index (CFNAI) Real final sales to Private Domestic Purchasers are slowing The Institute for Supply Management (ISM) Services index fell from 50.8 to 50.1. The index is only two-tenths away from showing contraction The employment sub-index of the Services Index report was also weak The prices paid sub-index continues to climb Norwood Economics manages its clients' diversified portfolios with a focus on the long run The Stock Market
By Christopher Norwood August 4, 2025
Executive Summary The S&P 500 fell 2.4% last week to end at 6,238.01 The S&P 500 is up 6.06% year-to-date Foreign Stocks in developed countries are leading among major asset classes Foreign stocks are inexpensive compared to U.S. stocks The jobs report was weak with a 258,000 downward revision for May and June Unemployment is likely to rise if job growth doesn’t accelerate Rapid-fire tariff changes make it difficult to predict the impact of tariffs on the U.S. economy Tariffs are a tax that someone has to pay Initial jobless claims are a leading indicator Inflation remains elevated Three more chances for the Federal Reserve to cut rates this year Stagflation is a feared outcome of the new tariff regime Uncertainty remains extraordinarily high Interesting Charts The Stock Market
By Christopher Norwood July 28, 2025
Executive Summary The S&P 500 rose 1.5% last week to finish at 6388.64 The impact of tariffs is expected to become more noticeable in the second half of the year The S&P price has outpaced profit growth The economy is still growing, but more slowly Initial jobless claims show that the labor market remains strong Gasoline demand is down, suggesting the rate of consumer spending growth is slowing The Fed meets this week but isn’t expected to change the funds rate  Two Fed governors may dissent on Wednesday. It has been 30 years since that happened The market continues to rise despite the uncertainty
By Christopher Norwood July 21, 2025
Executive Summary The S&P 500 rose 0.6% last week to finish at 6,296.79 The 2-Year trended lower, ending the week yielding 3.88% The 10-year Treasury yield ended the week at 4.44% Investors are nervous about tariffs and their impact Tariffs are coming directly out of the pockets of the US businesses that import the goods Rising inflation expectations only increases the chances of higher inflation and interest rates Continue to buy good companies on sale
By Christopher Norwood July 14, 2025
Executive Summary The S&P 500 fell 0.3% to close the week at 6,259.75 We would rather own the German economy than Nvidia Consumer spending is weakening The consumer price index report will be released on Tuesday Economists believe that tariffs will cause prices to rise Economists believe that tariffs will slow the economy The jobs market is stable. The unemployment rate is low. Earnings estimates are falling more than is normal There are still good companies on sale The Stock Market
By Christopher Norwood July 7, 2025
Executive Summary The S&P 500 rose 1.7% in a holiday-shortened week, finishing at 6,284.65 Volatility continues to fall from its elevated levels in early April The S&P is up 6.76% year-to-date. Industrials are leading the way, up 13.40% Price determines returns when buying an asset  Diversify away from a concentrated U.S. large-cap stock portfolio Job growth has been holding steady for almost a year now Analysts have been raising earnings estimates recently 90-day tariff suspension ends on Wednesday The Stock Market The S&P 500 rose 1.7% in a holiday-shortened week. The Nasdaq rose 1.6%. Both indexes set new record highs with the S&P reaching 6,284.65 on Thursday afternoon. The jobs report out Thursday spurred the S&P higher. The index gapped up at the open, closing Thursday up 0.83% (see chart below). The S&P 500 is up 26% from the selloff low on April 8, while the Nasdaq has surged 34.9%.
By Christopher Norwood June 30, 2025
Executive Summary The S&P 500 rose 3.4% last week, climbing to 6,173.07 The Magnificent 7 are outperforming the S&P 493 by over 18% since April The Cboe Volatility Index (VIX) fell as low as 16.11 last week Investors seem unconcerned about tariffs and war Treasury interest rates are starting to fall The Fed has little reason to cut if unemployment isn't moving higher The stock market is at record highs Corporate bond spreads are tight, meaning credit is abundant The dollar has fallen by around 10% in 2025 Inflation is expected to move higher because of tariff The Stock Market The S&P 500 rose 3.4% last week. The Israeli-Iranian ceasefire was credited with the surge to the upside. The index had lost 0.7% over the prior two weeks.
By Christopher Norwood June 23, 2025
Executive Summary The S&P 500 gained 0.3% last week, climbing to 5,967.84 The index is having trouble staying above 6,000 Technical indicators are turning somewhat negative The Federal Reserve kept the overnight rate at 4.25% - 4.50% The updated “dot plot” shows a divided Fed Seven members indicate no rate cuts in 2025 Eight members forecast two rate cuts in 2025 The Fed is forecasting a slower economy in 2025 and 2026 The hard data is starting to point to a slowing economy Inflation is still well above the Fed’s 2% target