Executive Summary
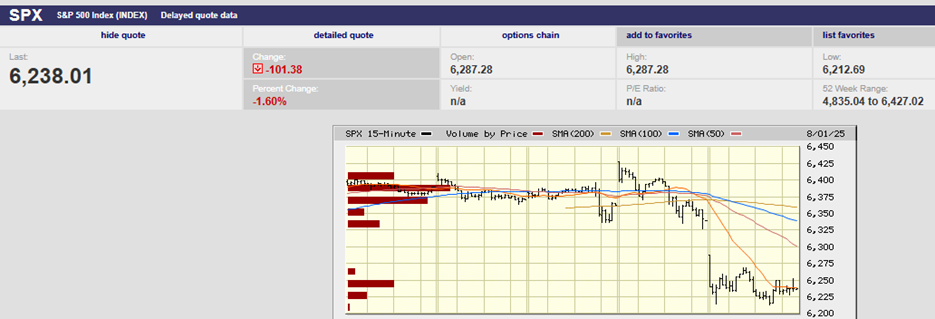
- The S&P 500 fell 2.4% last week to end at 6,238.01
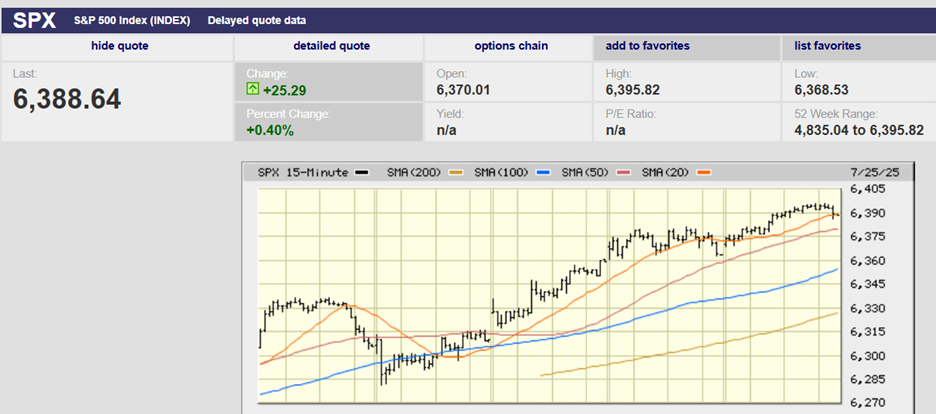
- The S&P 500 is up 6.06% year-to-date
- Foreign Stocks in developed countries are leading among major asset classes
- Foreign stocks are inexpensive compared to U.S. stocks
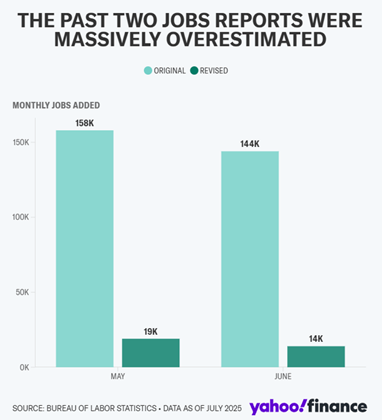
- The jobs report was weak with a 258,000 downward revision for May and June
- Unemployment is likely to rise if job growth doesn’t accelerate
- Rapid-fire tariff changes make it difficult to predict the impact of tariffs on the U.S. economy
- Tariffs are a tax that someone has to pay
- Initial jobless claims are a leading indicator
- Inflation remains elevated
- Three more chances for the Federal Reserve to cut rates this year
- Stagflation is a feared outcome of the new tariff regime
- Uncertainty remains extraordinarily high
- Interesting Charts
The Stock Market
S&P 500 5-Day Chart
The S&P 500 fell 2.4% last week to end at 6,238.01. The Dow fell 2.9% and the Nasdaq dropped 2.2%. It was the worst week for the stock market since May, according to Barron’s. Interest rates also fell last week. The 2-Year Treasury yield ended the week at 3.69%, down from 3.94%. The 10-Year Treasury yield finished Friday at 4.22%, down from 4.39%.
The S&P 500 is up 6.06% year-to-date. Industrials are the best-performing sector with a gain of 13.65%. Utilities come in a close second with an increase of 13.36%. The technology sector has gained 10.56% in 2025.
Foreign Stocks in developed countries are leading among major asset classes. Emerging markets are doing well too. The U.S. stock market is trailing foreign stocks of developed countries by double digits in 2025.
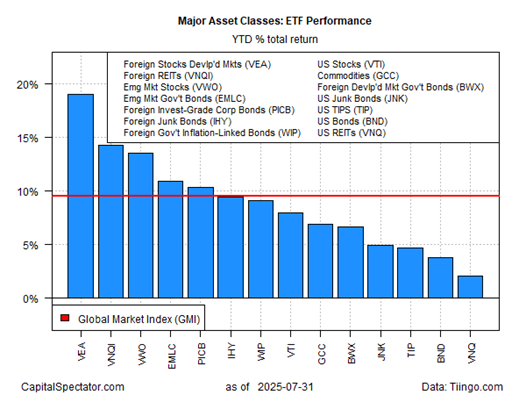
Foreign stocks are inexpensive compared to U.S. stocks and could outperform for years to come. Same with emerging market stocks. Diversification is the only free lunch in investing, allowing higher risk-adjusted returns. The last six months or so are a case in point.
The U.S. stock market took it on the chin Friday. The jobs report was weak. Nonfarm payrolls rose 73,000 in July, about 30,000 jobs shy of the consensus forecast. The real surprise was a 258,000 downward revision in the totals for the prior two months. Fewer jobs were added over the past three months than in any three month period since June 2020, according to Barron’s. The private sector added only 4,000 jobs in July, excluding healthcare and education, Evercore strategists noted.
“Bottom line, let’s be honest here, volatile and costly trade policy has stalled decision-making on the part of companies with many hitting the pause button on hiring,” wrote Peter Boockvar, an independent economist and market strategist.
The adjustments to May and June were large. There was an 87% downward revision to the May number. The June number saw a 90% downward revision. The absolute figures for the two months now stand at 19k and 14k.
It’s estimated that the U.S. must create around 100,000 jobs monthly to absorb new entrants to the labor pool. The U.S. economy is averaging 35,000 new jobs per month over the trailing three-month period. Unemployment is likely to rise if jobs growth doesn’t accelerate.
There is a caveat though. The jobs report number comes with a large confidence interval. The BLS pointed out last week that the confidence interval for the payroll number was plus or minus 136,000. That means the latest report could have shown a 209,000 increase or a 63,000 decrease, with a 90% probability. Fuzzy data is yet another problem for a data-dependent Fed.
Investors may be overreacting to the jobs report. Then again, they may not be overreacting. The high uncertainty surrounding tariffs makes forecasting more difficult than usual. (It isn't easy to forecast economic growth and interest rates in the best of times.) The tariff turmoil raises the difficulty level exponentially. For instance, Mexico and Canada are two of America’s largest trading partners. Mexico recently received a 90-day reprieve on new tariffs. Canada, conversely, saw a hike in general tariffs to 35% from 25%. Meanwhile, Brazil’s tariff rate was recently raised to 50%. The rapid-fire changes are dizzying. They make it difficult to predict the impact of tariffs on the U.S. economy.
The White House left baseline tariffs of 10% in place as the 1 August deadline arrived. The 10% tariff rate included countries with which the U.S. has a trade surplus (????). The Trump administration has set tariffs at 15% on those countries with which the U.S. has a small deficit. Tariffs range as high as 41% on countries with which the U.S. has a large trade deficit.
Tariffs are a tax that someone has to pay. It appears for now that U.S. companies are picking up most of the bill. The cost pressures are evident in a $30 billion drop in corporate tax revenue, writes Joseph Carson, former chief economist of AllianceBernstein. The federal government is garnering extra revenue from tariffs. U.S. firms are covering the cost, resulting in lower tax payments. It’s an offset to the tariff revenue that the Trump administration may not have considered.
Progress with trade negotiations remains uncertain. Most trade deals are light on details. There are different interpretations in some cases. Vietnam and the U.S. have reportedly come to terms. Yet neither side released documentation. And there are reports that Vietnam believed that it had agreed to a much lower rate, according to Barron's.
What is known is that Trump’s trade war has increased potential tariffs on U.S. imports by six times. The effective average tariff rate has risen from 2.3% to 18.3% so far. It is the highest effective rate since 1935. That assumes all announced tariffs are implemented. What is also known is that the U.S. has collected $55 billion in tariff revenue, much of it paid by U.S. companies. Those taxes will impact earnings.
Rising employment costs will also impact corporate earnings. Average hourly earnings have accelerated to 3.9% year-over-year. The Employment Cost Index (ECI), Powell’s favored labor cost gauge, was up 3.6% in the second quarter from a year earlier. The ECI is the most comprehensive labor cost gauge. Hitting the Fed's 2% inflation goal will be more difficult with the ECI at 3.6%.
The June unemployment report was released last week. There was a tick up in the rate. It could be the start of a rising trend, but there’s no real evidence of that yet. The unemployment rate has been stable over the trailing 12 months (chart below). And initial jobless claims are averaging 221,000 over the past four weeks. That's a historically low level. Initial jobless claims are a leading indicator.
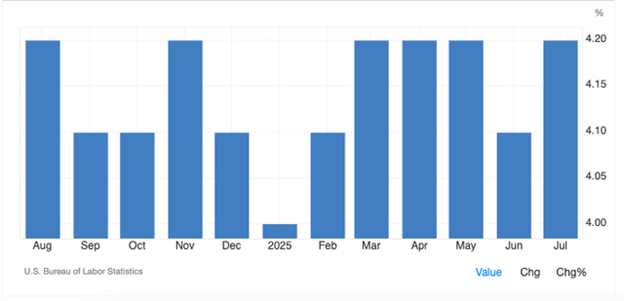
Unemployment Rate
The unemployment rate rose to 4.2% from 4.1% the prior month. The unemployment rate level signals that labor market conditions remain firm. Or as Chairman Powell said during his press conference following the Fed meeting, “The unemployment rate shows that the job market is in balance, as both the demand and supply of jobs have been declining in tandem.” A jobless rate in the low 4% range indicates the Fed is close to its maximum employment mandate. Inflation, however, remains elevated.
The CME FedWatch tool reacted Friday to the jobs report. Investors now place the odds of a quarter-point cut in the Fed funds rate at 80.3% for September. The odds of a rate cut were 37.7% a day earlier. The futures market is pricing in at least two rate cuts by year end.
It’s far from certain that the Fed will begin cutting in September, though. It’s also uncertain that interest rates at the long end of the yield curve will fall if the Fed does start cutting. Last year, Fed rate cuts saw the 10- and 30-year Treasury yields rise.
Longer-term rates might rise because inflation is rising. The June PCE report revealed that the PCE Price Index rose 0.3%, stronger than expected. The core PCE Price Index rose 0.3% as well. The PCE Price Index rose 2.6% year-over-year, above the consensus forecast of 2.5%. Core PCE year over year rose 2.8%, above the 2.7% forecast.
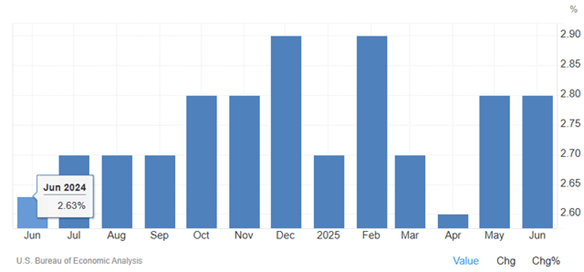
Core PCE
"Over the past six months, core PCE inflation has run at a 3.2% annual rate, up from 2.2% last fall," noted Michael Darda, chief economist and market strategist at Roth Capital Partners. Inflation may well rise to 3% by year-end. Base effects (last year's unusually low second half numbers) are the reason. Rising inflation would make it difficult for the Fed to justify a rate cut in September.
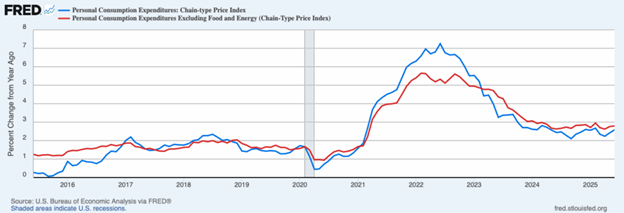
PCE and Core PCE Price Index
One of the feared outcomes of the new tariff regime is stagflation. Rising prices and a slowing economy are a toxic mix. Disinflation does appear to be slowing along with the economy. Personal Consumption Expenditures make up 70% of the economy. Real Personal Consumption Expenditures are slowing. (Chart Below).
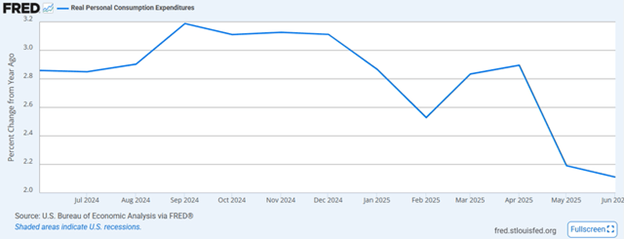
Real Personal Consumption Expenditures
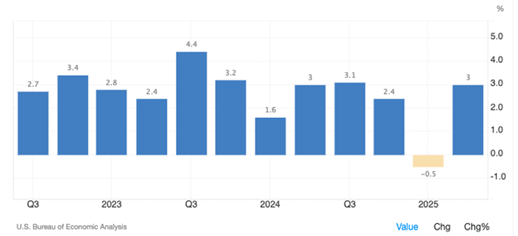
The second quarter GDP report was released on Wednesday (chart below). The economy grew 3.0% in Q2. Much of that was a drop in imports. Consumer spending makes up 70% of the economy. Consumer spending rose only 1.4%. Third quarter GDP is likely to be closer to 1.5% than 3.0% given the consumer spending number.
Uncertainty remains extraordinarily high. The economy is slowing. Inflation may be leveling off or even rising. The impact of a sharp increase in tariffs hasn’t been recognized by the stock market, at least not yet.
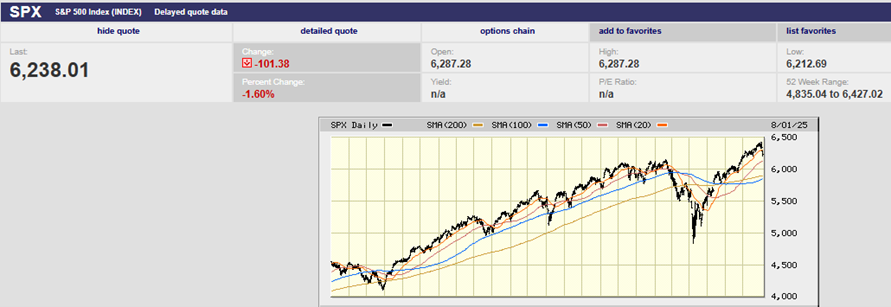
S&P 500 2-Year Chart
Volatility is likely to rise in the coming months. The economy is likely to slow. Corporate earnings estimates are likely to fall. What the stock market does is anyone’s guess. Pundits are still scratching their heads as the S&P continues to motor higher.
Interesting Charts:
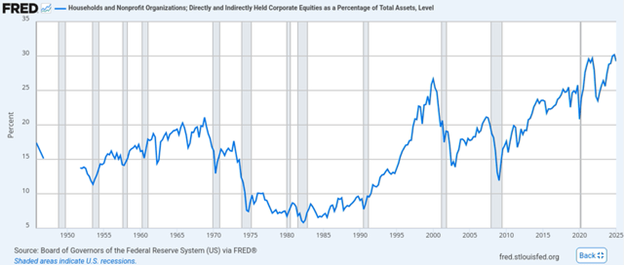
Households have record exposure to the U.S. stock market.
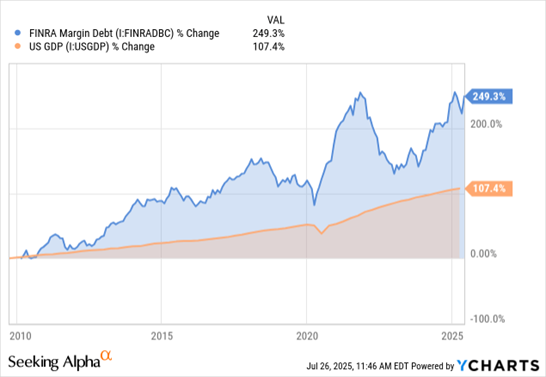
Leverage is high.
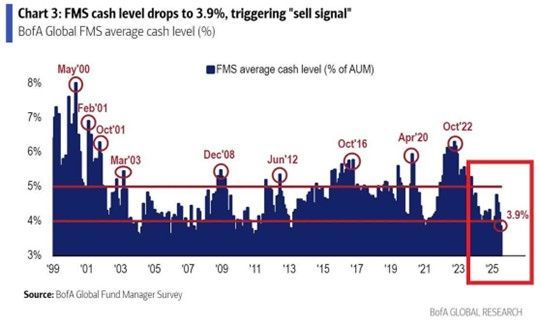
Money managers are fully invested.
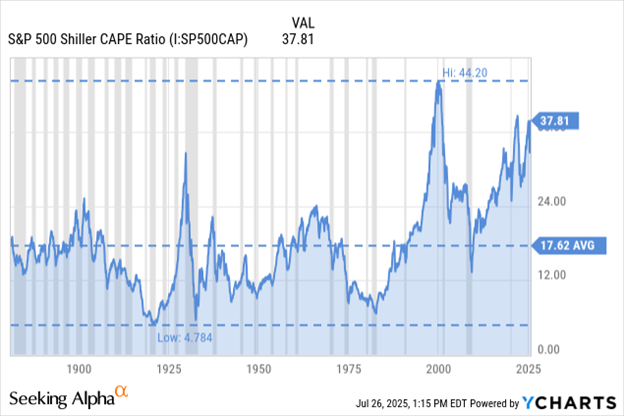
Money managers are fully invested despite an expensive stock market.
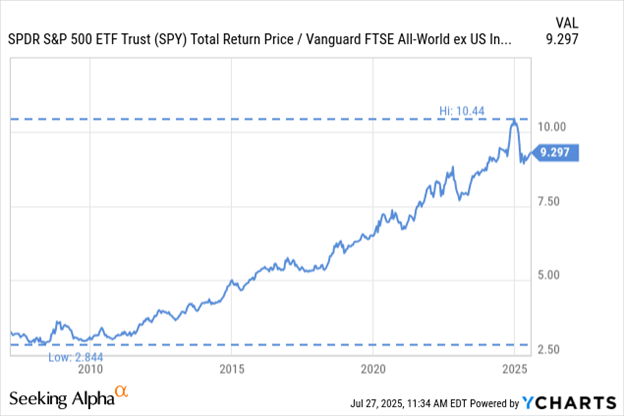
The U.S. stock market is no longer outperforming the rest of the world. (A falling line indicates underperformance)
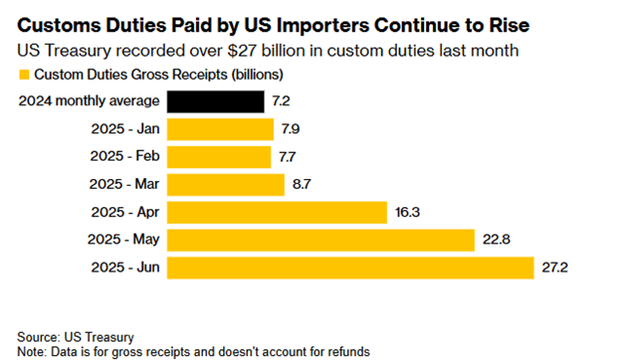
Perhaps the U.S. stock market is underperforming because of the tariff taxes corporations are paying.
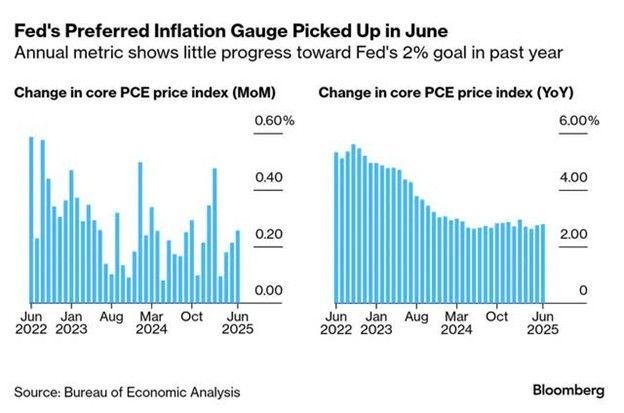
Inflation is no longer slowing.
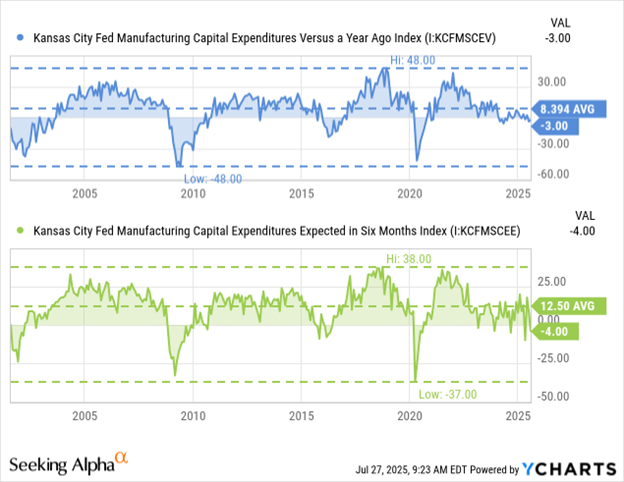
Manufacturing activity is slowing
Regards,
Christopher R Norwood, CFA
Chief Market Strategist