Executive Summary
- The S&P 500 rose 1.7% in a holiday-shortened week, finishing at 6,284.65
- Volatility continues to fall from its elevated levels in early April
- The S&P is up 6.76% year-to-date. Industrials are leading the way, up 13.40%
- Price determines returns when buying an asset
- Diversify away from a concentrated U.S. large-cap stock portfolio
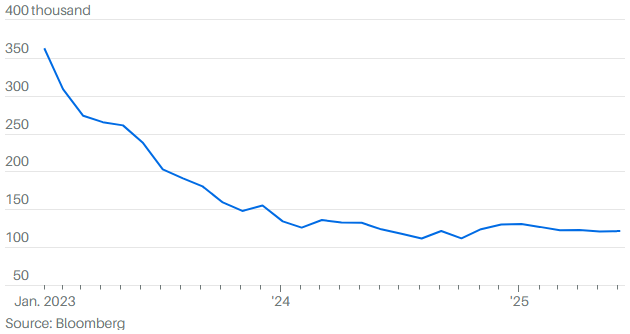
- Job growth has been holding steady for almost a year now
- Analysts have been raising earnings estimates recently
- 90-day tariff suspension ends on Wednesday
The Stock Market
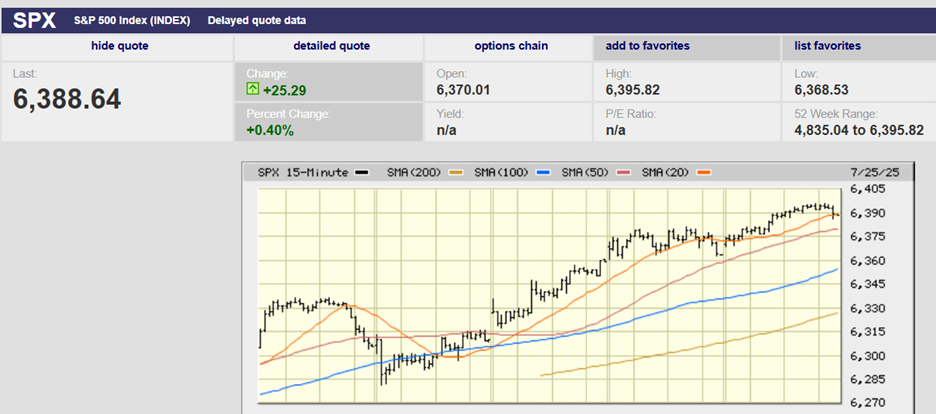
The S&P 500 rose 1.7% in a holiday-shortened week. The Nasdaq rose 1.6%. Both indexes set new record highs with the S&P reaching 6,284.65 on Thursday afternoon. The jobs report out Thursday spurred the S&P higher. The index gapped up at the open, closing Thursday up 0.83% (see chart below). The S&P 500 is up 26% from the selloff low on April 8, while the Nasdaq has surged 34.9%.

S&P 500 5-Day Chart
Volatility continues to fall from its elevated levels in early April. Low volatility equates to complacency among investors. (The VIX is also known as the Fear Gauge). Low volatility is always followed by high volatility. The question is what triggers the rise in volatility.
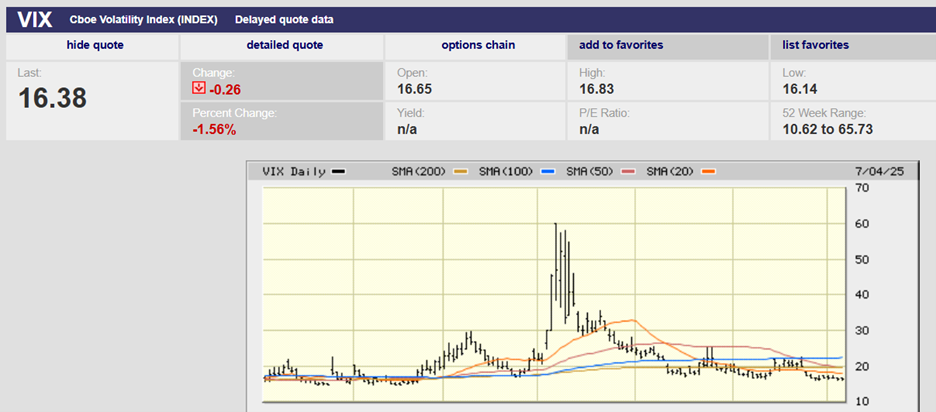
VIX 6-Month Chart
The S&P is up 6.76% year-to-date. Industrials are leading the way, up 13.40%. Howmet Aerospace, GE Vernova, Uber, and GE Aerospace are the top-performing industrial stocks in the S&P in 2025. Communication Services (CS) is the second-best-performing sector. Netflix, Take-Two Interactive, and TKO Group are the top-performing stocks in the CS sector. AT&T is the fourth-best performer in the CS space. Consumer Discretionary and Health Care are the only two sectors with losses on the year. Health Care is down 1.50%. Consumer Discretionary is down 1.40%. CVS is up 50.21% year-to-date in Health Care. Centene Corp and UnitedHealth Group are the two worst performers. Royal Caribbean is the top performer in the Consumer Discretionary sector. Deckers Outdoor is the worst performer. Tesla is the third worst performer in Consumer Discretionary, down 22% on the year.
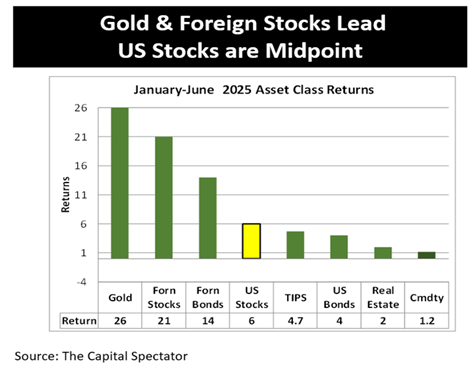
The U.S. stock market continues to lag gold and foreign assets. Foreign stocks and bonds trail only gold in 2025 (chart below).
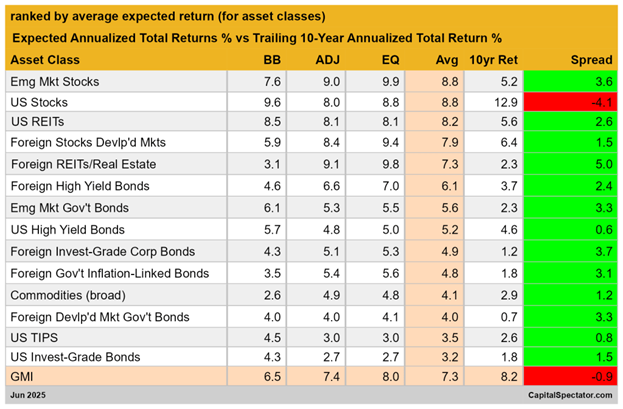
James Picerno is the director of analytics at The Milwaukee Co. He is the author of three books on quantitative analysis. The Milwaukee Co. is forecasting that U.S. stocks will underperform their 10-year trailing returns by 4.1% per year over the next decade. (see chart below, note average expected, 10-year returns, and spread). That said, Picerno still expects U.S. stocks to average 8.8% (along with emerging markets) in the coming decade. Vanguard is forecasting U.S. stock returns closer to 5% annually in the coming decade.
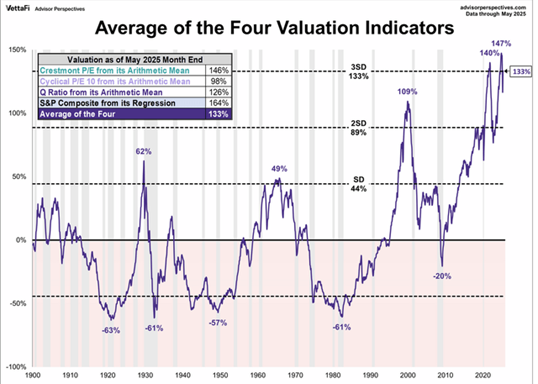
Of course, price determines returns. Pay too much for an asset and you will earn a below-average return. Buy an asset on sale and you will earn an above-average return. The U.S. stock market is trading at extreme valuations. The chart below is log-normal. Zero represents the average valuation based on several different valuation metrics. The U.S. stock market is close to three standard deviations away from its average valuation. Again, price determines return. The U.S. market is priced to earn less than average over the next decade based on the metrics used to create the chart.
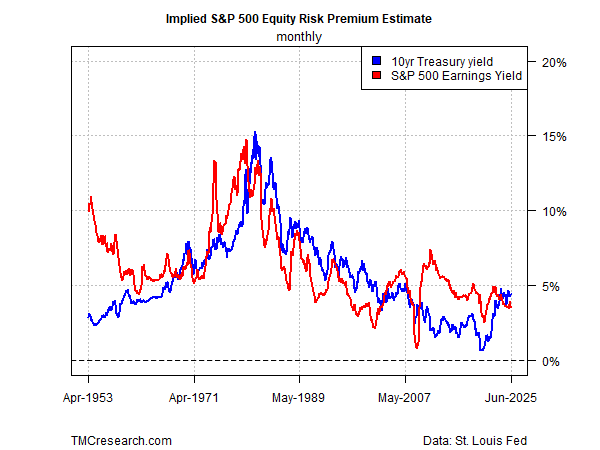
The S&P 500 earnings yield (inverse of price-to-earnings) has fallen below the 10-year Treasury yield (chart below). Ten-year Treasuries are an attractive alternative to U.S. stocks.
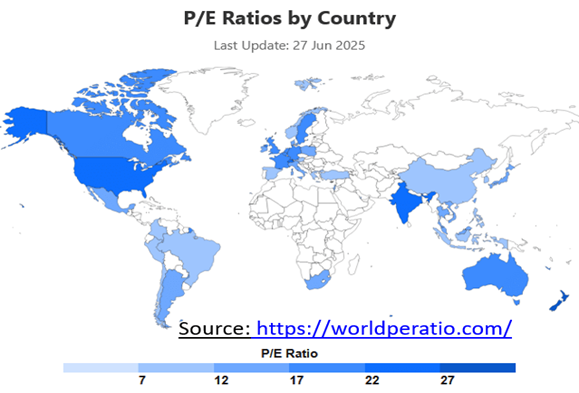
International stocks are an attractive alternative to U.S. stocks, as well. U.S. stocks are some of the most expensive in the world.
GMO maintains a 7-year real return forecast for the various asset classes (chart below).
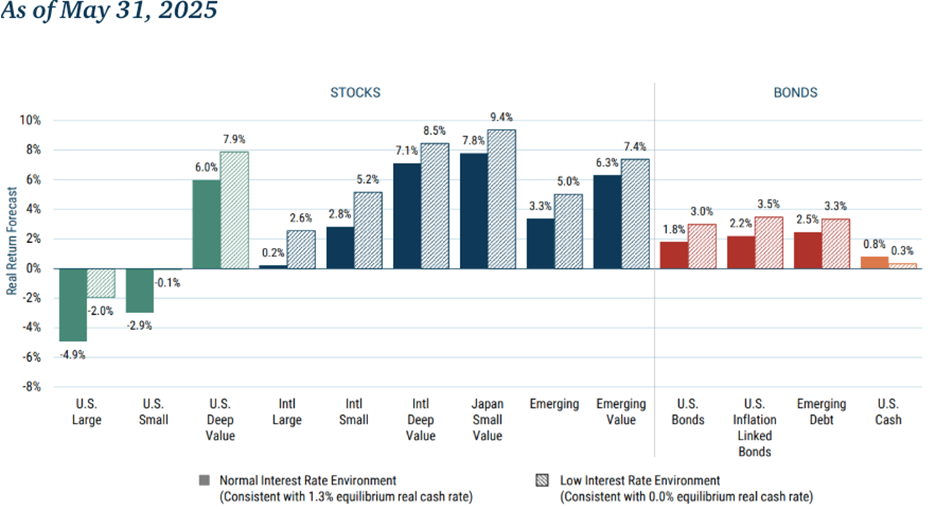
It is no surprise that U.S. large-cap stocks are forecast to have a negative real return over the next seven years. U.S. large cap is also expected to trail all other asset classes.
Diversification away from a concentrated U.S. large-cap stock portfolio (S&P 500) is likely critical to good returns in the next decade.
Bond yields rose last week. Thursday’s jobs report saw the 2-year, and 10-year Treasury yields climb sharply.
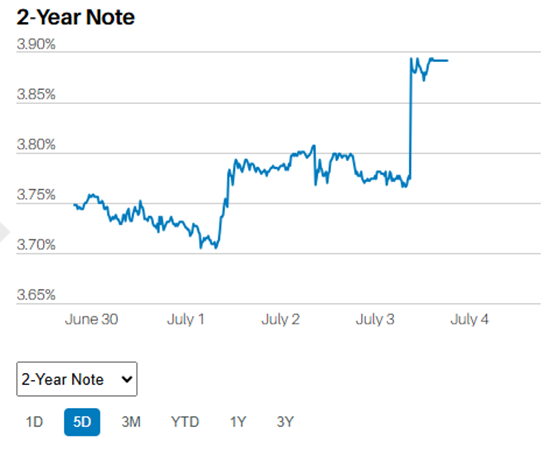
2-Year Treasury 5-Day Chart
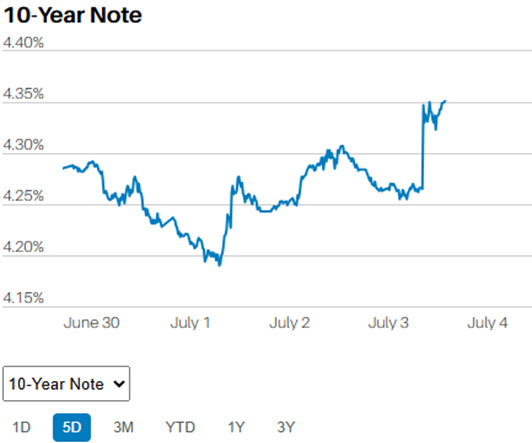
10-Year Treasury 5-Day Chart
The jobs report out Thursday surprised to the upside. Investors sent stocks higher and sold bonds. The Bureau of Labor Statistics (BLS) reported 147,000 nonfarm jobs were added in June. The consensus forecast from economists surveyed by Bloomberg was 106,000. Revisions to prior reports were positive, totaling 16,000 to the upside. Jobs growth has been holding steady for almost a year now. (chart below)
This is paragraph text. Click it or hit the Manage Text button to change the font, color, size, format, and more. To set up site-wide paragraph and title styles, go to Site Theme.
The coming week could see more volatility. The 90-day tariff suspension ends on Wednesday 9 July. Tariffs are currently raising about $30 billion a month, according to Barron’s. Tariff income for the government would total around $400 billion annualized at the current rate. Torsten Sløk, chief economist at Apollo Global Management, pointed out last week that the big numbers aren’t showing up in the inflation data. The $400 billion makes up about 20% of the $2 trillion in S&P 500 company profits. Slok also pointed out that analysts have been raising earnings estimates recently.
Something doesn’t add up. Tariffs are taxes that must be paid. Either the importing company pays the tax, impacting earnings. Or consumers pay the tax, causing consumer prices to rise. Tariffs are flowing into government coffers. Yet neither companies nor consumers are feeling the impact so far. That can’t last. Earnings conference calls should shed light on who’s paying the tariffs, Sløk says. Earnings season begins in a few weeks. Meanwhile, the 90-day tariff suspension ends on Wednesday.
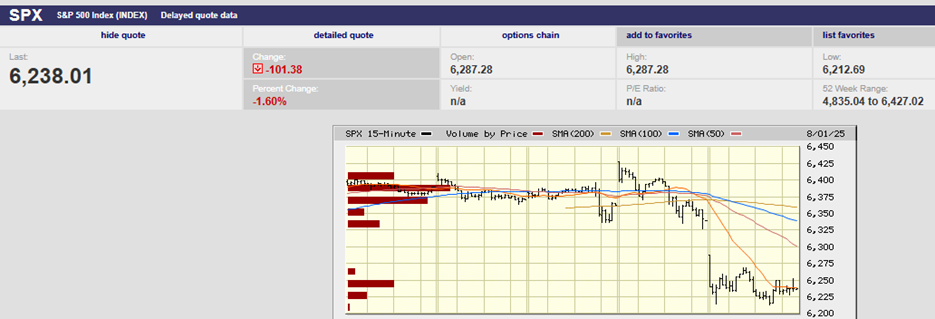
The Volatility Index is likely to rise in July.
Regards,
Christopher R Norwood, CFA
Chief Market Strategist