Executive Summary
- The S&P 500 rose 2.9% last week to finish at 5,686.67
- The Dow was up 3% last week, and the Nasdaq rose 3.4%
- The counter-trend rally is ongoing
- Investors are extremely bearish due to worries about the trade war
- Political prediction markets are back
- Exploding imports are not a sign of weakening demand
- The April jobs report was better than expected
- The Trade War continues
- Capital is flowing into international and emerging markets
- The US dollar will likely continue to weaken
The Stock Market
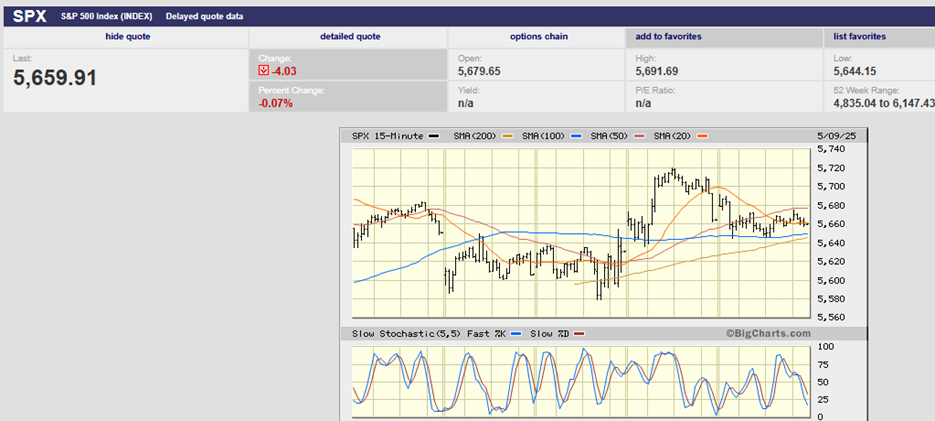
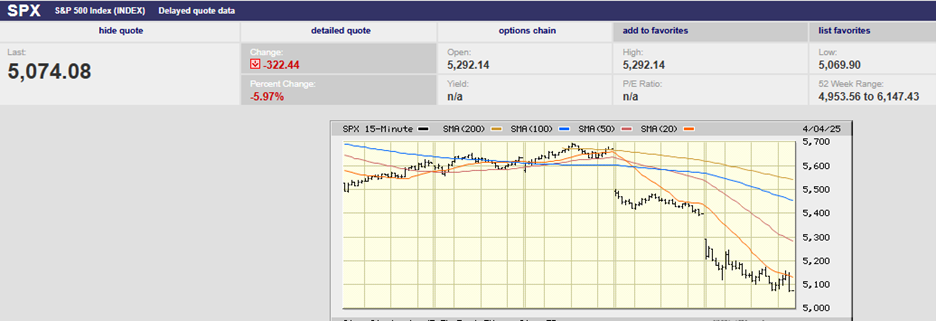
S&P 500 5-Day Chart
The S&P 500 rose 2.9% last week to finish at 5,686.67. The index has risen nine days in a row, its longest streak since 2004. The winning streak was extended despite a weak GDP number on Wednesday that saw the S&P gap down at the open. The S&P is up 10.2% over the last nine trading days. It is down 3.31% in 2025.
The Dow was up 3% last week, and the Nasdaq rose 3.4%. Pundits and the media credited comments from the White House as the catalyst for last week's gains. Others cited the good earnings reports from Microsoft and Meta as fuel for the ongoing rally.
“Equity markets seem to expect no recession from tariffs, but rate cuts anyway,” says Steven Blitz, chief U.S. economist at TS Lombard. That's despite expected tax cuts and a jobless rate below full employment. It can all happen, but it isn’t likely to happen. Blitz is looking at the market’s rally based on fundamentals and scratching his head. The technical explanation is straightforward.
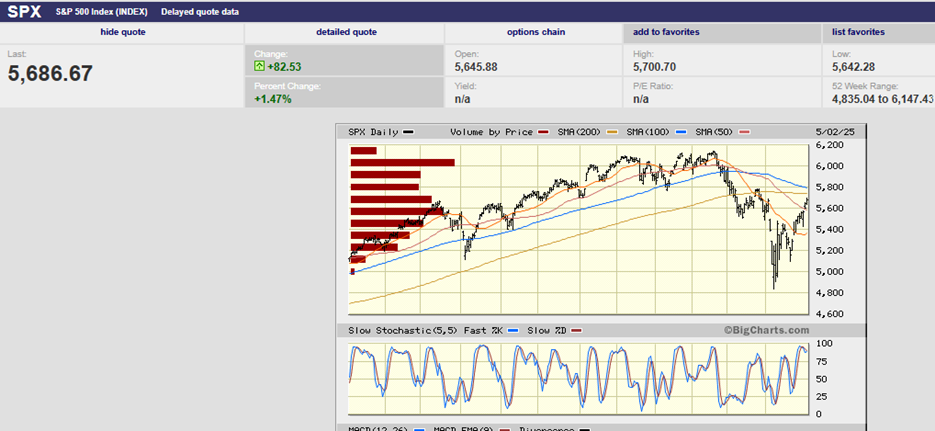
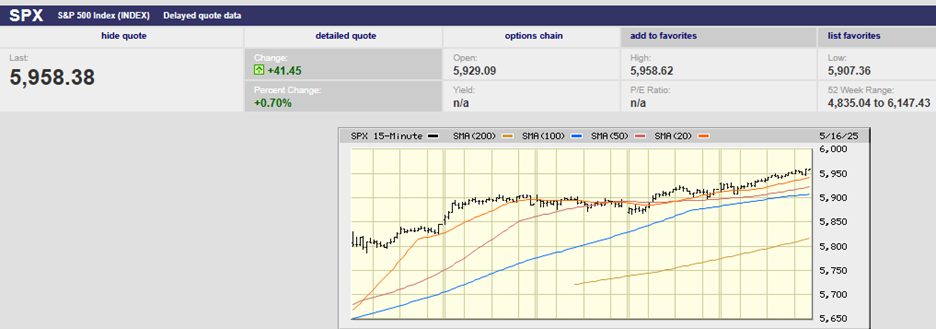
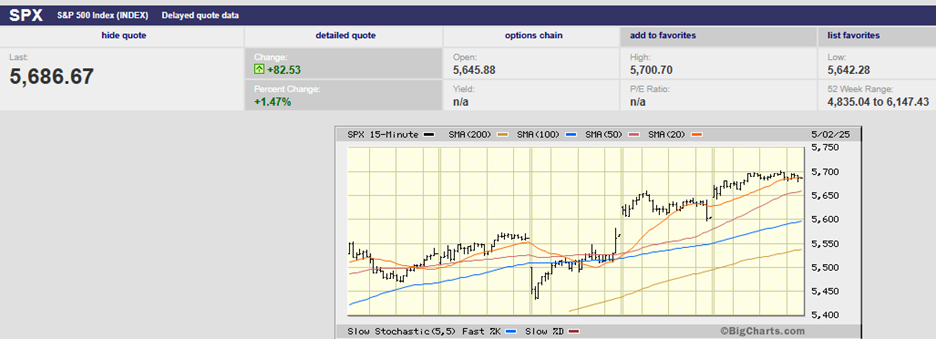
S&P 500 1-year Chart
The market lost 21% in a short period. It became oversold in the process (chart above). There is always a counter-trend when a market moves in one direction too fast. It’s just a question of when it starts and how far it runs. It’s how markets behave because it is how humans behave. Dip buying and short covering ignited a counter-trend rally in this case. The counter-trend rally is ongoing. It has retaken both the 20-day and 50-day moving averages. It will continue until sellers reappear. They'll want to reduce their exposure to stocks given heightened uncertainty. Nothing much has changed with the Trade War.
The S&P should rollover this week and begin another down leg. Of course, the index looked ready to give back some of its bear market bounce last week and didn’t. Now the 200-day lies just above the S&P at around 5,750. It should prove stiff resistance. The next resistance after the 200-day is around 5,800. It’s unlikely the S&P will make it through either resistance area without positive developments on the trade front.
The technical picture can provide some help. Investors are extremely bearish. According to Barron’s latest Big Money poll, professional investors are more bearish than they have been in 30 years. The Big Money poll found that 32% of respondents were bearish on the outlook for stocks over the next 12 months. It is the highest percentage since at least 1997. The bullish percentage of money managers was also at 30-year lows. Last fall 50% of managers were bullish according to Barron’s. The bearishness is the result of worries about Trump’s trade war. Professional money managers fear its impact on the economy and corporate earnings.
Meanwhile, political prediction markets are indicating an almost 70% chance of recession in 2025. The odds of a recession are 67% on Polymarket. They are even higher on Kalshi, according to Logan Kane, an independent market strategist. Political prediction markets allow people to bet on the outcomes of elections, legislation, and economic data. It's an old concept dating back to 16th-Century Italy. Political prediction markets were popular in the US, until regulators banned the practice. Now, they're back.
The academic idea is that trading action will reveal the truth better than the news can. The last presidential election provides a good example. News networks had the election as a toss-up until late in the evening. Betting markets made Trump a 90% favorite based on early data from counties up and down the U.S. East Coast.
Still, recessions are difficult to predict. Short-term stock market movements are also hard to predict. The high level of pessimism among investors reduces the odds of a recession. Or at least it reduces the likelihood of a continued sell-off in the stock market.
Capital markets tend to reverse whenever sentiment hits extremes. The timing isn’t precise. Markets can trend lower or higher for a time despite extreme sentiment readings. But the current level of bearishness increases the odds that the stock market will be higher 12 to 18 months from now, recession or no.
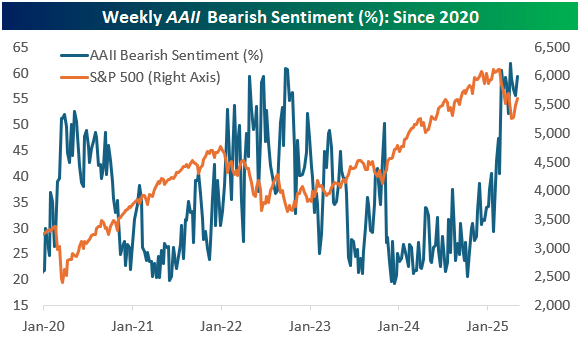
Bearishness is high among individual investors also.
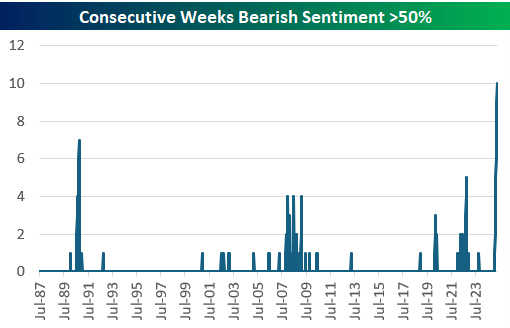
And has been for a while.
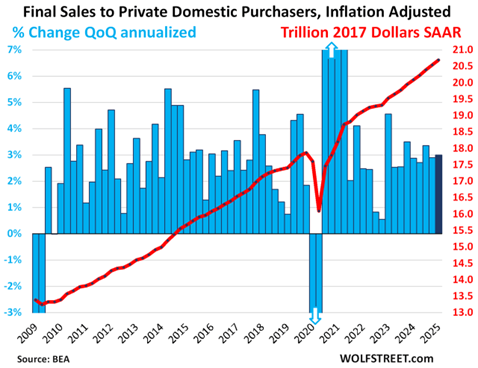
Whether the market decline is over or not is still an open question. The economic data is holding up so far. Even weak Q1 GDP isn’t as weak as the negative 0.3% number suggests. A surge of imports ahead of tariffs slashed nearly five percentage points from the annual growth rate. Exploding imports are not a sign of weakening demand.
Domestic final sales grew at an annual rate of 3% in the latest quarter, about the same pace as in the prior quarter.
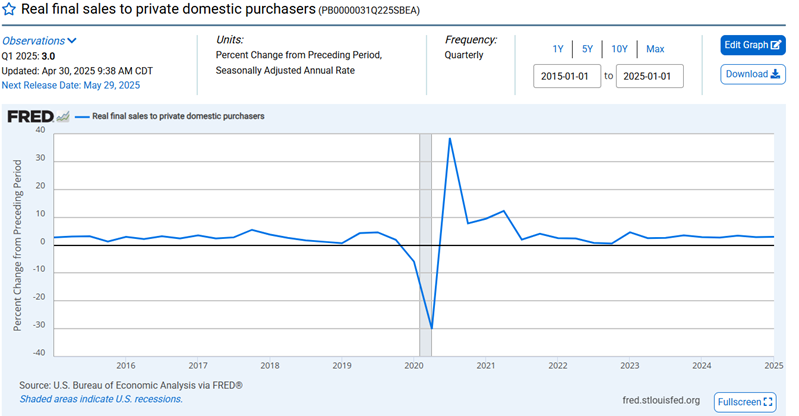
Real final sales is GDP less exports, less imports, less government consumption expenditures, less government gross investment, and less change in private inventories. It covers about 87% of GDP and presents the core of the private US economy.
The April jobs report was better than expected also (chart below).
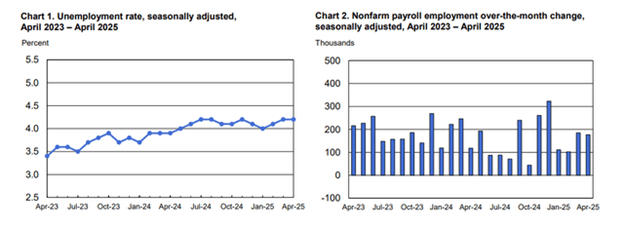
April saw 177,000 jobs created after a downwardly revised 185,000 payrolls gain in March. Downward revisions totaled 58,000 for the prior two months. The jobs number was above the 138,000 consensus estimate. It was the 52nd consecutive month of growth in the labor market, the 2nd longest in history. The labor force participation rate ticked up to 62.6%, which is an encouraging sign. Payrolls continue to grow. The average monthly increase was 155,000 over the past three months, versus 157,000 over the past 12 months. Following Friday’s jobs report, Treasury yields surged, with the two-year ending the week at 3.83%. The bond market was reacting to the jobs strength.
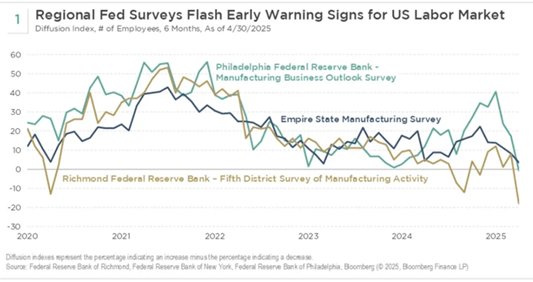
There are some signs of a weakening economy, though.
And of course, the Trade War looms overall.
Norwood Economics is skeptical that US-China trade talks are about to begin. America's new threat of sanctions on countries that buy Iranian oil makes talks less likely, for instance. China is the primary buyer of Iranian oil. The Chinese won’t want to appear to cave to U.S. pressure. Nor do they have to, given that the U.S. consumer is only now starting to feel the pain of U.S. trade policies. The U.S. "Temu tax" took effect at midnight Friday. U.S. consumers are now paying 120% to 145% more for items shipped directly from China.
“The tax on packages under $800 in value means U.S. consumers pay their government for the privilege of buying low-cost products directly from China,” UBS' Paul Donovan told clients on Friday. “The tax is unlikely to show up in consumer price data, but it is a visible price increase to many U.S. consumers—a reminder that they, not exporters, pay trade tariffs. This visible trade tax effect will pressure the U.S. administration to do a trade deal—any trade deal,” Donovan added.
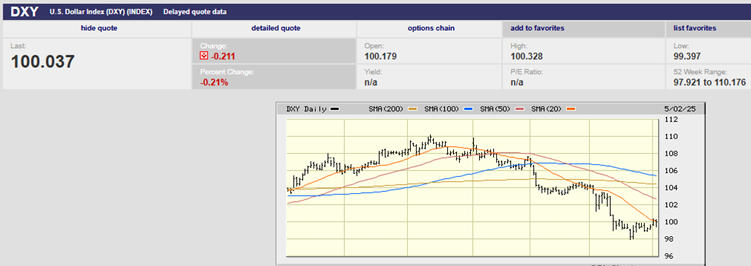
DXY 6-Month Chart
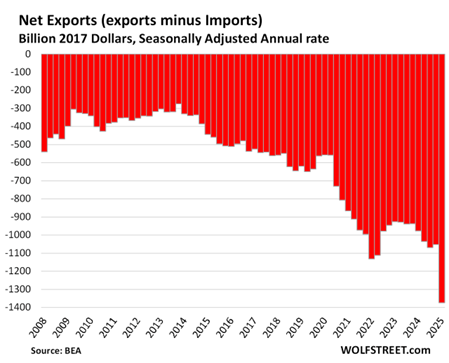
The US dollar traded lower against all the G10 currencies on Friday, including most emerging market currencies. The falling dollar means foreigners are still repatriating capital from the U.S. The chart below shows net outflows as foreign investors sell U.S. bonds and stocks.
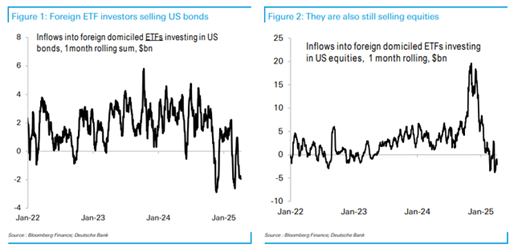
Capital is flowing instead into international and emerging markets. The U.S. is bringing up the rear in 2025.
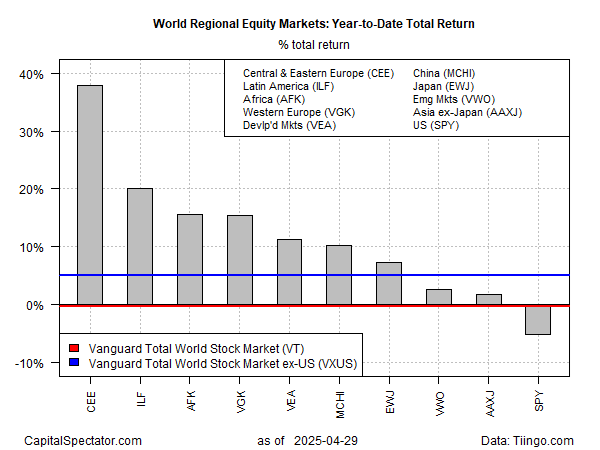
Investors are demanding a higher risk premium for US assets. Former Bridgewater chief investment strategist Rebecca Patterson said as much during an interview in late April. “I think there is a new risk premium on US assets as seen by foreign investors," she told Yahoo Finance. The change in sentiment is expressed in the currency market (a weakening dollar).
The U.S. stock/foreign stock ratio has followed the strengthening and weakening dollar over the years.
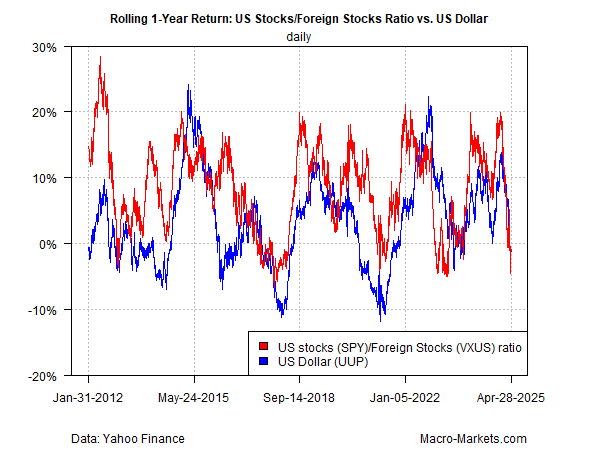
The sliding value of the US dollar has been a tailwind for the outperformance of global equities ex-US in recent history.
The dollar is likely to continue to weaken for a variety of reasons. One is that the Fed is expected to cut the funds rate three or four times before year-end, according to the CME FedWatch tool. The FOMC might cut in June or July. Or they might not cut at all in 2025. Recent core PCE numbers, measured over three- and six-month spans, have been running at 3.5% and 3% annually, point out John Ryding and Conrad DeQuadros of Brean Capital. That’s well above the Fed’s 2% target. It leaves no scope for easing in the short term, they wrote last week. “Higher prices are in the pipeline,” added Wells Fargo economists in a note after the release of the PCE report on Wednesday. Jim Bianco of Bianco Research suggested that means the Fed may cut its federal-funds rate only once this year.
Higher-than-expected rates will impact earnings growth estimates. The S&P isn’t cheap. The price/earnings multiple remains in the top quartile, according to Rosenberg Research. Nine of the 11 S&P sectors have seen cuts in their earnings estimates. S&P end-of-year price target estimates of strategists tracked by Bloomberg have been cut to 5823. That’s only 2.4% above Friday’s close.
All in all, uncertainty remains high, and the range of possible outcomes is wide. Investors should remain diversified. They should remain prepared for higher-than-normal volatility in the capital markets.
Regards,
Christopher R Norwood, CFA
Chief Market Strategist