Executive Summary
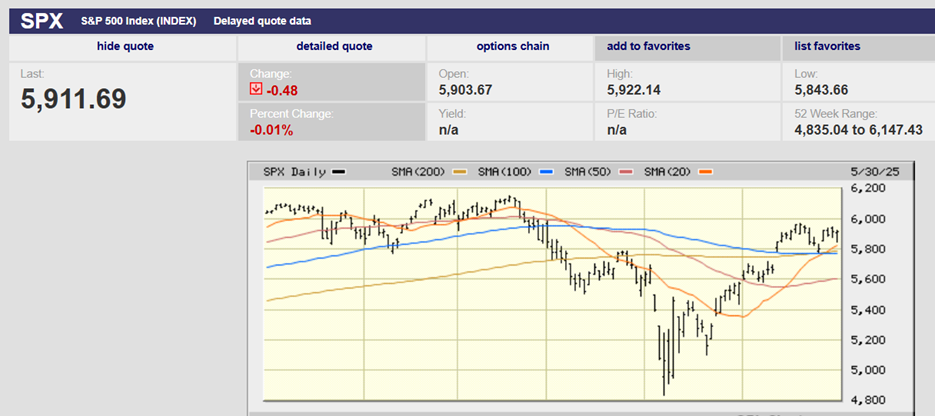
- The S&P 500 rose 1.9% last week to finish at 5911.69
- The S&P 500 rose 6%, the Dow rose 3.8% and the Nasdaq climbed nearly10% in May
- Could see another test of support around 5,800 this week
- Several longer-term negative divergences may be pointing to a tough summer
- Declining new highs during an advancing market is a negative
- Earnings estimates for 2025 and 2026 have been trending lower
- Earnings drive the stock market over the long run
The Stock Market
The S&P 500 rose 1.9% last week to finish at 5911.69. The index had its best monthly gain since 2023 and its best May in 35 years. It was up over 6%. The Dow rose 3.8% in May, and the Nasdaq climbed nearly 10%.

S&P 500 5-Day Chart
We wrote last week that, “The 5,800 area should provide strong support for the market when it opens for trading on Tuesday. And it did. Tuesday saw the S&P set an early low as it gapped up at the open (chart above). The index closed near its high for the day. Wednesday saw selling with the index pulling back from 5,940 and hitting 5,880 late in the session. There was another gap up on Thursday in response to a good earnings report from Nvidia. The S&P couldn’t build on the early gains and gave some back by the close. Friday was a back-and-forth day that ended flat.
The coming week could see another test of support around 5,800 (chart below).
S&P 500 6-Month Chart
There are a couple of small negative divergences hinting at another round of selling to come (chart below). Both the On Balance Volume (OBV) and Relative Strength Index (RSI) show negative divergences. Both are trending down while the S&P moves sideways. Also, the slow stochastic is starting to roll over, making a down week more likely. A drop below the 200-day moving average in the next week or two would create a double top. Profit taking is the normal response.
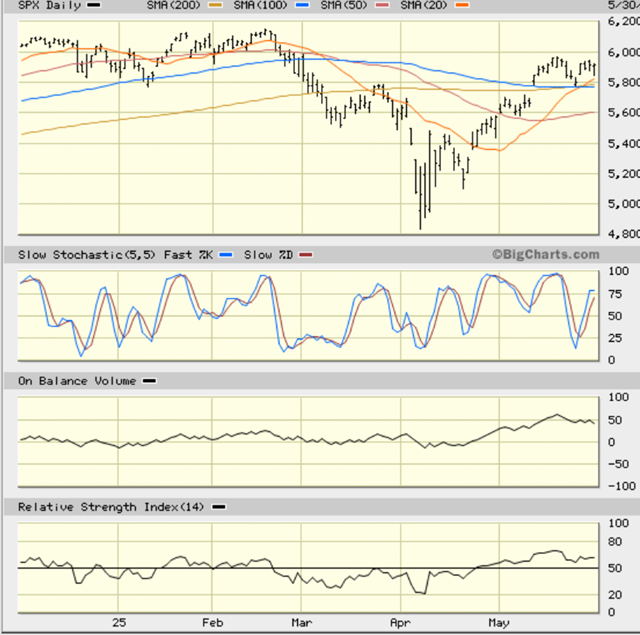
S&P 500 6-Month Chart with Divergences
A pullback in the next few weeks is far from certain. Conversely, it will prove tough for the S&P 500 to push through resistance in the 6,000 area. It will take some positive fundamental news. Strategists tell Barron's that several things will need to happen for the market to break out to a new high. Craig Johnson, chief market technician at Piper Sandler, thinks it will take “lower inflation data, lower 10-year bond yields, and less noise out of Washington.”
That said, several longer-term negative divergences may be pointing to a tough summer.
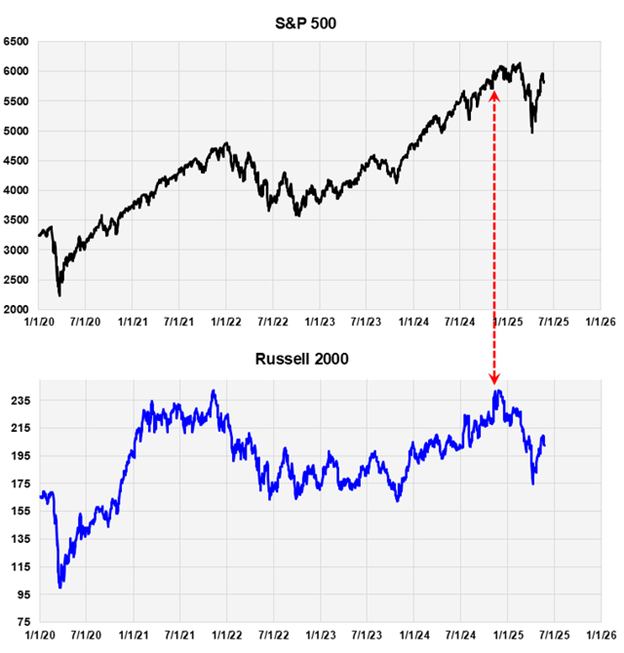
The chart above shows the Russell 2000 small-cap index diverging from the S&P. The divergence started on December 1st and is now six months old. The S&P 500 is again nearing the all-time high it set in February. The index is up over those six months. Yet the Russell 2000 is 18% below its high and down during the same six-month period.
It's also considered a divergence if one index makes new highs while another double tops. You can see that in the chart above as well. Notice how the S&P 500 in 2024 exceeded the highs made in late 2021, but the Russell 2000 did not. That’s a four-year divergence. There is an old saying on Wall Street that the Generals are the last to fall (the S&P). It is the rank-and-file stocks that begin to break down first (the Russell 2000).
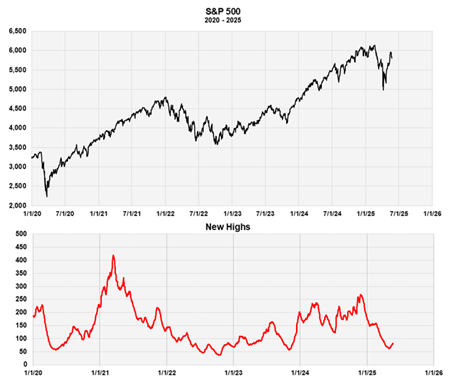
Declining new highs during an advancing market is a negative. It is a warning that the stock market isn’t as strong as the price action indicates. Declining new highs increase the likelihood of a market decline. Lead times vary, unfortunately. Even so, it is a warning when there are declining new highs during a bull market, as there are now (chart above).
The 2-Year Treasury yield fell to 3.93% from 4.00% last week. The 10-Year finished the week at 4.40%, down from 4.51%. The 30-year yield fell below 5%, ending up Friday yielding 4.94%. 30-year interest rates are rising, though (chart below). Rising rates will eventually impact corporate earnings and the stock market.
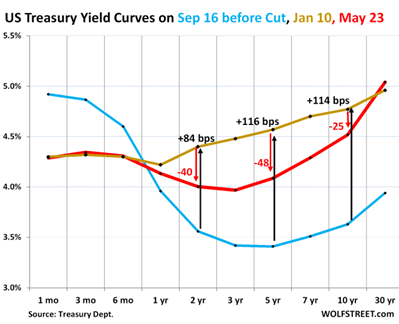
The 30-Year Treasury yield (red line) has moved above its January high.
Estimates for 2025 and 2026 have been trending lower. Earnings in 2025 are expected to grow by 9.1% to $259 per share.
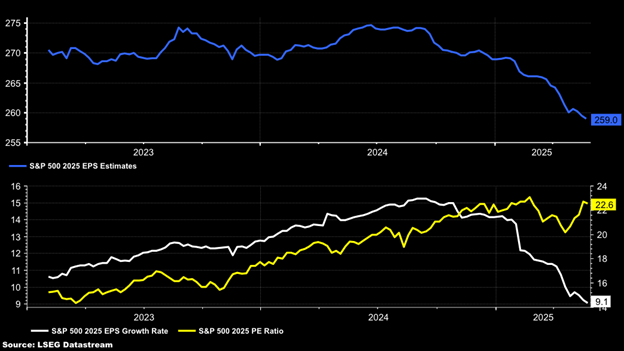
That is down from a peak in June 2024 of around $275. The decline in earnings estimates has helped the S&P 500 push its P/E ratio for 2025 back up to 22.6. At almost 23x earnings, the S&P is expensive.
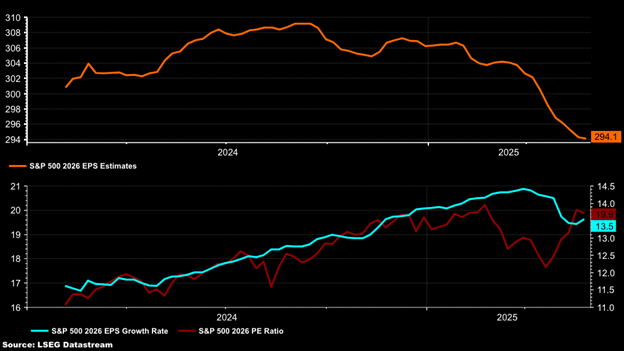
It is not much better for 2026. Earnings are expected to grow by 13.5% to $294.10 per share, down from their peak of about $309 per share in September. As a result, the P/E ratio has risen to 19.9 for 2026.
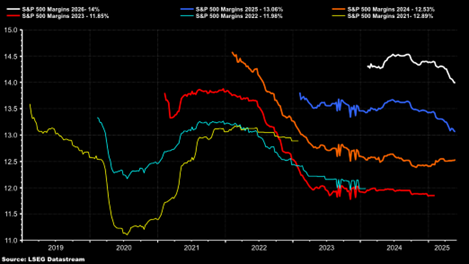
According to Mott Capital Management, declining margin estimates are the biggest contributor to declining earnings estimates. Margin estimates for 2025 and 2026 are falling noticeably (blue and white lines below). Both margin and earnings estimates typically decline. Analysts start high and reduce as the earnings period approaches. It is the steepness of the decline that is most noteworthy. The rate of change is something to which Wall Street pays close attention.
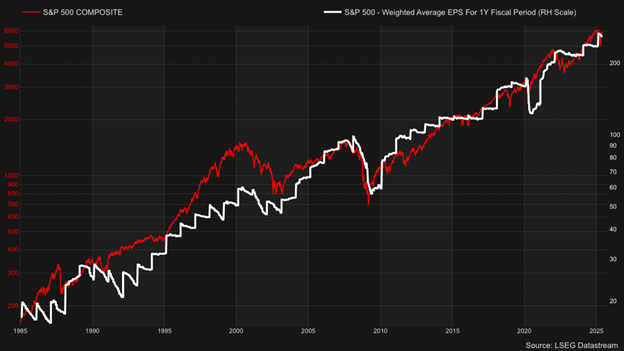
Earnings drive the stock market over the long term. (see chart below). Declining earnings estimates put the advancing market at risk. The high price-to-earnings ratio means investors are unlikely to tolerate much of a decline in earnings growth estimates before taking profits.
The next few months might be volatile. There is a high level of uncertainty surrounding trade policy. Earnings estimates are falling. The market is expensive. A sentiment-driven sell-off is a real possibility this summer.
Regards,
Christopher R Norwood, CFA
Chief Market Strategist