Executive Summary
- The S&P 500 fell 0.5%, to finish at 5,659.91
- The Dow fell 0.3%, and the Nasdaq dropped 0.5%
- The 200-day moving average is the next resistance
- U.S. nominal GDP growth expected to slow significantly
- Bank of America shifts investment focus
- Norwood Economics already has exposure to gold for most clients
- Norwood Economics is overweight international stocks
- The risk of both higher unemployment and higher inflation has increased
- The Federal Reserve declined to lower the fed funds rate last week
The Stock Market
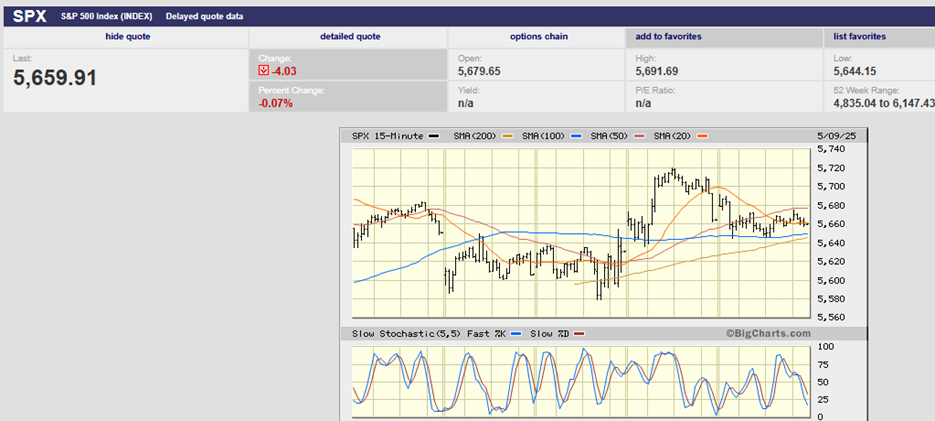
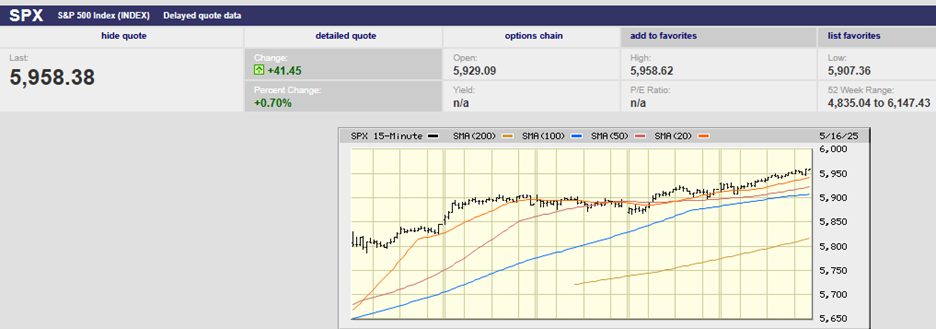
S&P 500 5-Day Chart
The S&P 500 finished the week down 0.5%, closing at 5,659.91. The Dow fell 0.3%, and the Nasdaq dropped 0.5%. The 10-year Treasury yield finished the week at 4.38%. The 2-Year yield finished at 3.91%. The 3-Month Treasury yield ended the week at 4.37%, a rounding error away from the 10-Year yield.
Last week we wrote that:
“The S&P should rollover this week and begin another down leg. Of course, the index looked ready to give back some of its bear market bounce last week but didn’t." The 200-day sits on top of the S&P (chart below). It is around 5,750. The 100-day is at 5,790. They should prove stiff resistance. The S&P won't break above resistance without positive developments on the trade front.
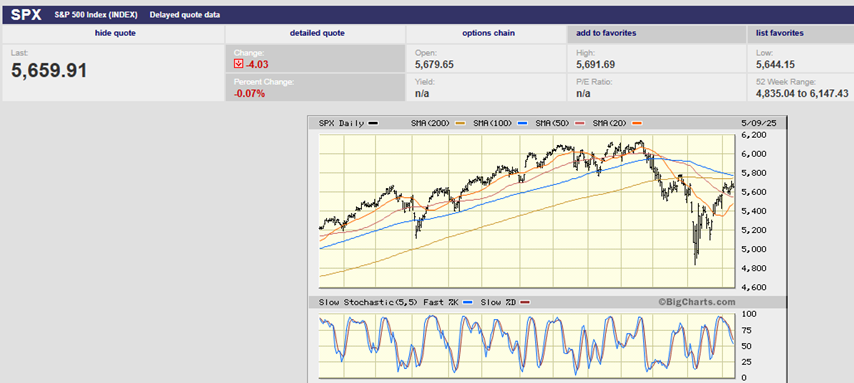
S&P 500 1-Year Chart
Fast forward to today. Nothing much has changed. The S&P 500 didn’t exactly “rollover this week and begin another down leg”. (See chart above). It did fail to move higher, though. And the technical picture hasn’t changed. The index is still sitting under the 200-day moving average. The 100-day isn’t far above the 200-day.
Michael Kramer of Mott Capital Management had this to say Friday:
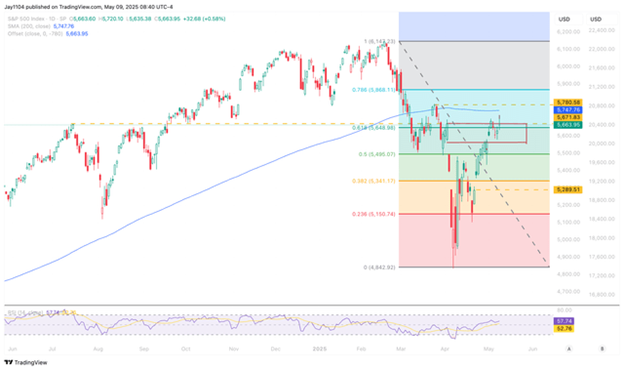
“For the S&P 500, the region between 5,550 and 5,700 is proving to be very challenging. (see chart below) The overhang of the 200-day moving average and the 61.8% retracement of the decline are also challenges. Additionally, there is strong resistance from the July 2024 highs.”
Kramer went on to write:
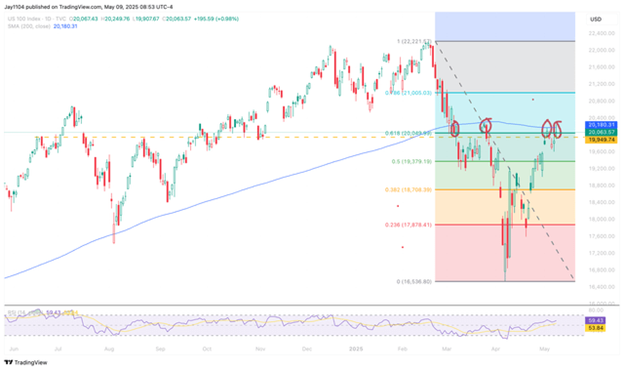
“The NASDAQ 100 has also found resistance at the 200-day moving average, the 61.8% retracement level, and resistance that goes back to the June 2024 levels. (Chart below) But more interestingly, the NASDAQ 100 has also now failed at the 200-day moving average four times. That seems to suggest that the 200-day moving average is a tough resistance zone.”
Of course, technicals take a back seat to major fundamental developments. The Trump administration looks as if it is teeing up a major trade announcement for the weekend. A claim of a breakthrough with the Chinese wouldn't be a surprise. (It's Saturday as I write.) The stock market may blast higher on Monday in response, taking out both the 200- and 100-day. It's nonsense, of course. The negative impact of the existing tariffs will bring reality crashing down on investors at some point. Unless they're removed soon. Trump's motivation for an announcement is straightforward. He'd prefer not to have the stock market start another down leg in the current downtrend. The stock market is at a critical juncture. At the same time fundamentals continue to deteriorate. Trump likely knows he's running out of time.
(It’s now Sunday morning). Surprise, surprise. Headlines out of Geneva are claiming a breakthrough with the Chinese. The Reuters headline: “Trump hails China talks, says two sides negotiated 'total reset' in Geneva.” Barron's is writing on Sunday that the futures market is ready to trade higher beginning at 6 p.m. Sunday. Neither side made any statements after the Saturday talks, according to Reuters. Neither side signaled any specific progress towards reducing crushing tariffs.
Sunday saw more progress, according to Treasury Secretary Scott Bessent. He said the two sides made "substantial progress". Trump’s problem is that he's playing with a weak hand. His tariff blitz has resulted in "$600 billion in annual bilateral trade going up in smoke. The U.S. consumer will feel the impact of the virtual standstill in trade. The clock is ticking, and it seems that Trump knows it. We wrote a few weeks back that Trump would be forced to declare victory and call off the war in the next few months. It is still the most likely result of the tariff tiff. We may be seeing the claim victory and go home strategy in action this weekend.
(It's now Monday morning) Trump and the Chinese will roll back tariffs on May 14th. The Chinese tariff will be 30%. The U.S. tariff will be 10%. The effective tariff rate should end up between 12% -17% when negotiations are complete. That will still leave tariffs as high as they've been since the Smoot-Hawley Tariff Act of 1930. Economic growth and earnings will feel the negative impact. Nevertheless, the US stock market is celebrating this morning. It gapped up above the 200- and 100-day moving averages at the open. We will see if the S&P 500 can remain above the moving averages until the market close.
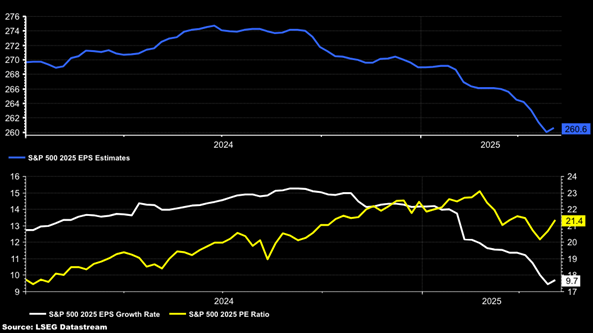
Meanwhile, Wall Street is adjusting to the screeching halt to trade. The chart below shows that earnings estimates and earnings growth rates are falling. The S&P’s price-to-earnings multiple is rising as a result.
The pace of U.S. nominal GDP growth will slow significantly, according to Michael Hartnett, Chief Investment Strategist at BofA. Nominal GDP surged by 50% over the past five years. The surge was the result of massive fiscal spending in response to Covid, plus inflation. (Nominal GDP includes inflation.) Slowing nominal GDP will put pressure on margins. Slowing sales growth and declining margins are a recipe for slower earnings growth.
GDP growth estimates are falling for 2025 and 2026. The Conference Board expects the U.S. economy to grow by 2.0% in 2025 and 1.7% in 2026. S&P Global is forecasting GDP growth of 1.9% in 2025 and 2026. Global economic growth is also expected to slow. The looming slowdown is partly because of higher-than-normal uncertainty. Also, because of tariffs.
Slowing GDP growth means slowing earnings growth. Federal Reserve data since 1948 shows that a 1% increase in real GDP growth has translated to a 6% increase in S&P 500 earnings. Of course, slowing GDP growth means slowing earnings growth.
Lance Roberts of RIA Pro wrote last fall:
“Since 1947, earnings per share have grown at 7.7% annually, while the economy expanded by 6.40% annually. That close relationship in growth rates is logical”.
A slowing economy and slowing earnings growth will pressure the stock market. Hartnett wrote that oversold equities have “correctly front-run Q2 trade deals/lower tariffs". He cautions investors to prepare for a “buy the expectation, sell the fact” scenario when trade agreements materialize. We will have an opportunity to see if he's right when the market opens Monday morning.
Hartnett points out that, “Though the effective U.S. tariff rate may decrease overall, the potential tariffs on China (30%) and the EU (10%) would still be equivalent to a $600B rise in tariff taxation.” Economists have long understood that taxes negatively impact economic activity.
Hartnett’s primary concern involves debt. He said that, “the primary risks to markets stem from a potential “asset prices” collapse and subsequent deleveraging contagion.” He pointed out that “global debt reaching an all-time high of $324T in the first quarter is worrisome. It is a vulnerability that could trigger widespread market disruptions if asset values decline precipitously.”
Bank of America is recommending a shift in investment focus. Hartnett, said the bank has shifted from the 2020’s view of “anything but bonds” and “anywhere but China” towards preferences for bonds over equities, international stocks over U.S., and gold over U.S. dollars. BofA’s views are the result of a major pivot in investment strategies at the bank.
Hartnett believes that bonds are in an “early secular bear market” driven by inflation. “This is due to “fiscal excess, debt, war, and deglobalization,” he wrote in a BofA “The Flow Show” report. The 30-year U.S. Treasury was down 40% during the past four years. The secular bear “is only over once electorates on Main St. (via elections) and Wall St. (via debt ratings, and failed auctions) vote for less fiscal excess,” he wrote. Commodities are in an “early secular bull market.” Gold has outperformed stocks since the U.S-China trade war began in 2018, Hartnett pointed out. Stocks are “in a late secular bull market”, Hartnett added. He also said the U.S. dollar is in a “secular bear market.”
Hartnett’s views are worth considering. The macroeconomic environment has changed dramatically in a short period. The change is bound to have an impact on the capital markets. Norwood Economics already has exposure to gold for most clients. We are also overweight international stocks.
For its part, Citi Research (Citibank) has revised its outlook for the S&P 500, lowering its year-end price target. Citi now expects the index to close out 2025 at 5,800. That’s down from 6,500. The bank reduced its earnings per share estimate for the S&P from $270 to $255. UBS Investment Bank Chief Strategist Bhanu Baweja expects the S&P 500 to decline to 4800 by the third quarter. That is 15% below recent levels. After that, Baweja looks for a rebound, but expects lower returns in the coming years. Baweja sees subdued stock market returns because of "burdensome government debt levels." Like Hartnett, Baweja believes interest rates will stay higher due to heavy government borrowing.
Fundamentals are beginning to deteriorate. The charts are at a critical juncture. It is most likely that a new down leg in an ongoing downtrend is about to begin. The big announcement Monday might postpone the down leg for another week or two. The odds still favor down over up unless the effective tariff rate is returned to the 2% level. Currently, the effective tariff rate is more than five times that level.
Interest Rates:
Meanwhile, the Federal Reserve met last week. The Fed funds rate was left unchanged. The potential for stagflation was mentioned at the post-meeting press conference. The FOMC warned that uncertainty about the economic outlook has increased. The risk of both higher unemployment and higher inflation has increased, Powell acknowledged. Slower growth and higher inflation are the very definition of stagflation. The Federal Reserve doesn’t have the tools to counter stagflation. Lowering interest rates to support the economy increases the risk of rising inflation. Raising interest rates to keep inflation in check risks rising unemployment. The Fed is in a bind.
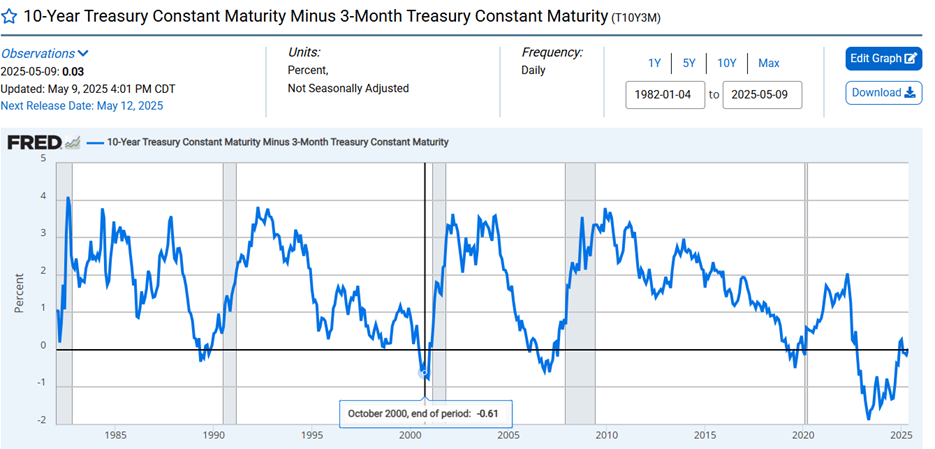
A flat yield curve indicates tight monetary policy. The 10-Yr/3-Mth yield curve has an excellent record of predicting recessions. Timing is the issue.
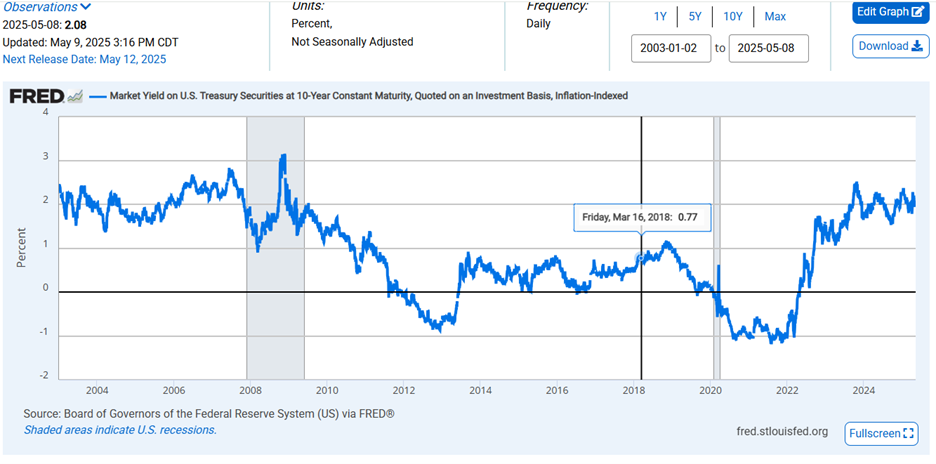
The real 10-year yield is high compared to recent history. Not so much compared to the period before the Great Recession. (chart below).
The Federal Reserve declined to lower the funds rate last week, leaving it at 4.25% to 4.50%. The FOMC lowered its economic forecast for the U.S. and hiked its inflation projection. Fed Chair Jerome Powell said during the press conference that “a good part” of the downbeat forecast “is coming from tariffs.”
The coming week should see the U.S. stock market rollover and renew its downtrend. The Trump administration's claim of a major breakthrough may push the market higher Monday. Any buying at the open is likely to be short lived though. The charts, interest rates and earnings estimates all argue against a market move higher in the coming months.
(None of this newsletter represents investment advice.)
Regards,
Christopher R Norwood, CFA
Chief Market Strategist