Executive Summary
- The S&P 500 gained 0.3% last week, climbing to 5,967.84
- The index is having trouble staying above 6,000
- Technical indicators are turning somewhat negative
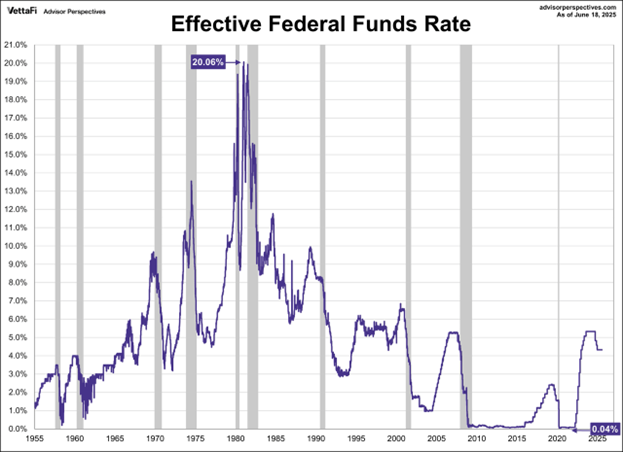
- The Federal Reserve kept the overnight rate at 4.25% - 4.50%
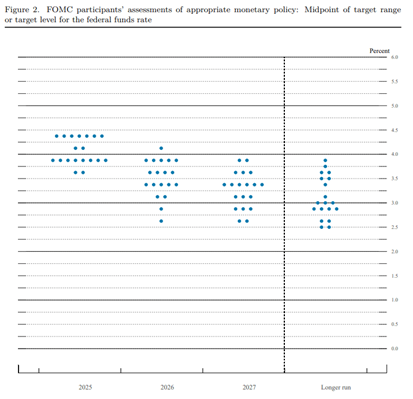
- The updated “dot plot” shows a divided Fed
- Seven members indicate no rate cuts in 2025
- Eight members forecast two rate cuts in 2025
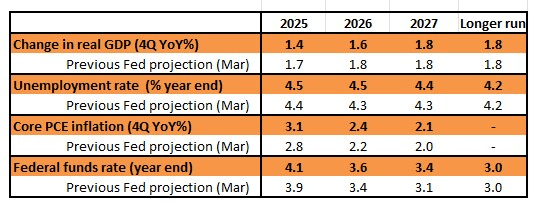
- The Fed is forecasting a slower economy in 2025 and 2026
- The hard data is starting to point to a slowing economy
- Inflation is still well above the Fed’s 2% target

S&P 500 5-Day Chart
The S&P 500 fell 0.3% last week after dropping 0.4% the prior week. The index closed on Friday at 5,967.84 back below the big round 6,000 number once again. The S&P has been in a range of 1.60% over the last two weeks. It is the narrowest range since the two weeks ending December 13, 2024, according to Barron’s. The S&P closed above 6,000 on June 6th, finishing at 6,000.36. It closed above 6,000 for the next four trading days before finishing at 5,976.97 on June 13. (chart below). The S&P popped back above 6,000 for a day, closing on June 16 at 6,033.11. It couldn't hold that level, though, closing below 6,000 in the final three trading days of the week.
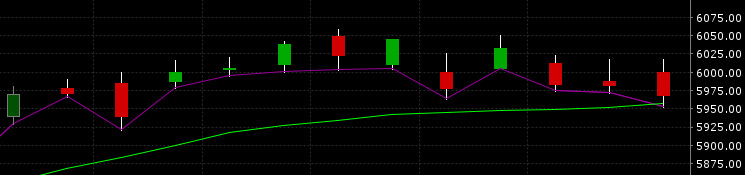
S&P 500 last 13 Trading Days
The longer the market trades sideways the more vulnerable it is to a pullback. Traders get nervous when momentum wanes. At some point, enough decide to take profits that the market begins to dip lower. Then it’s a question of whether more traders join in, seeking to preserve profits… or not.
Some technical indicators are pointing to potential downside. For instance, the number of stocks participating in the rally is falling. The S&P has returned 0.4% over the last month, but the equal weighted S&P is down 1.5% over that period. Also, the number of stocks trading above their 200-day moving average has slipped below 50%, according to Barron’s. The number of stocks trading above their 20-day moving average has fallen below 40%.
It's been a frustrating year for investors. The S&P is only up 1.5% on the year. Volatility is higher than average. Goldman Sachs put out a note letting clients know that the S&P 500 return is in the 24th percentile since 1990. Volatility is in the 89th percentile.
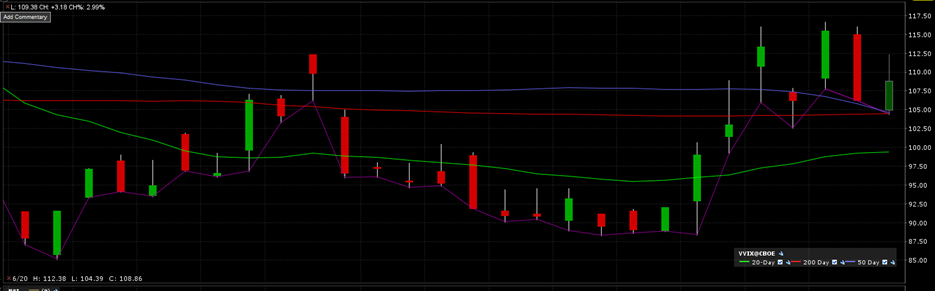
Norwood Economics wrote last week that, “The coming weeks promise to be volatile.” The VIX is back above 20 after bottoming recently at 16.23 on 11 June. VVIX, which measures the VIX volatility, has been rising recently. (Chart Below)
We also wrote last week that, “All in all, the S&P is likely to see higher volatility in the coming weeks. Higher volatility is usually associated with a down move in the market.” Nothing happened last week to change our forecast. Just the opposite. The Fed reduced its economic growth forecast Wednesday and raised its inflation estimate.
It made no change to the Fed Funds Rate (FFR) at its Wednesday meeting. The FOMC kept the overnight lending rate at 4.25% - 4.50%. It was a unanimous vote. Investors are now handicapping two rate cuts in 2025. They are looking for a quarter point in September and another in December. Seven members of the Fed are expecting no rate cuts in 2025 based on the updated Summary Economic Projections (SEP) report. Eight Fed members are expecting two cuts. (chart below).
The growth downgrade for 2025 and 2026 is notable, with a 0.3% decrease this year and a 0.2% decrease next year. The average growth rate for the two years is 1.5%. Meanwhile, the Fed projects unemployment at 4.5% in 2025 and 2026. That is up from 4.4% and 4.3%. Core inflation estimates rose to 3.1% in 2025 and 2.4% in 2026, up from 2.8% and 2.2%.
The Fed reduced its forecast for economic growth from 1.7% to 1.4% for 2025 (chart below). It dropped its forecast for economic growth from 1.8% to 1.6% for 2026. Its longer run projection (2027 and beyond) remained at 1.8%. Meanwhile, unemployment is expected to rise to 4.5% in 2025 before falling back to 4.3% in 2027. The FOMC raised its inflation forecast to 3.1% in 2025, up from 2.8%. The Fed seems to believe that tariffs will push inflation higher, but only short term. It’s forecasting core PCE to fall to 2.1% by 2027. The projected FFR for year-end 2025 is 4.1%, implying one quarter point cut. The forecast is still for the FFR to fall to 3.0% longer term. It appears the Fed believes that 3.0% is the neutral rate (the rate that neither stimulates or restricts economic growth).
For their part, investors are anticipating two 25bp rate cuts this year. They are expecting a cut in September and another in December, according to the CME FedWatch tool. ING Economics pointed out last week that the jobs market and wage inflation are cooling. There is also evidence of softer housing-related inflation. New tenant rents are already turning negative. Housing accounts for around 40% of the core CPI basket by weight. Falling housing-related inflation will help inflation fall to 2% in 2026, ING believes. But ING doesn’t think the hard data will be available in time for the September meeting. It is forecasting a 0.5% cut in December instead.
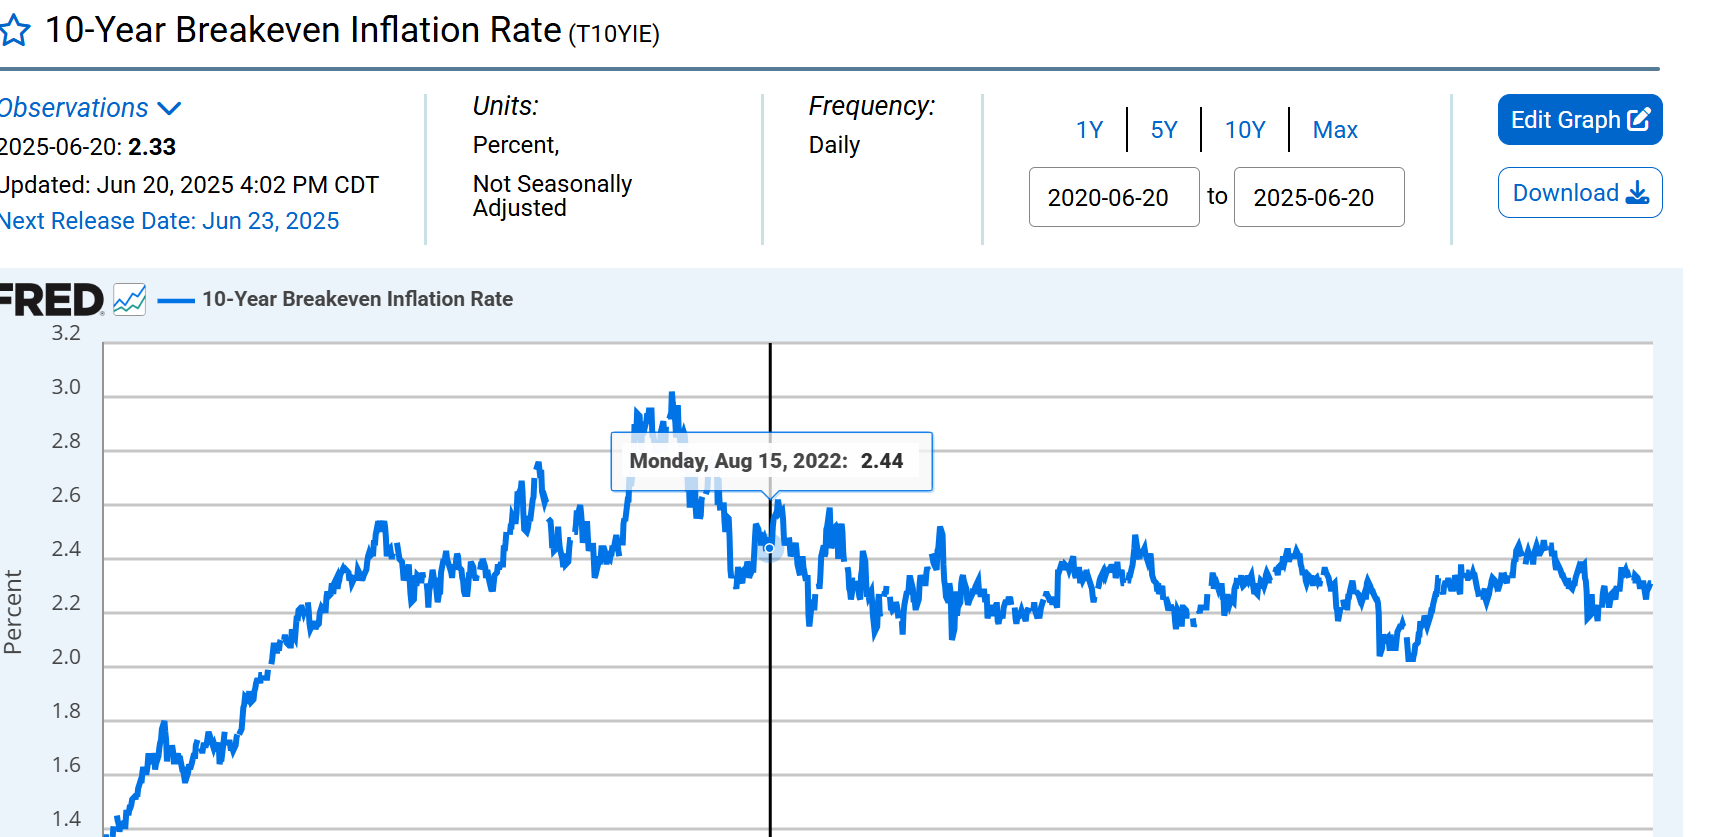
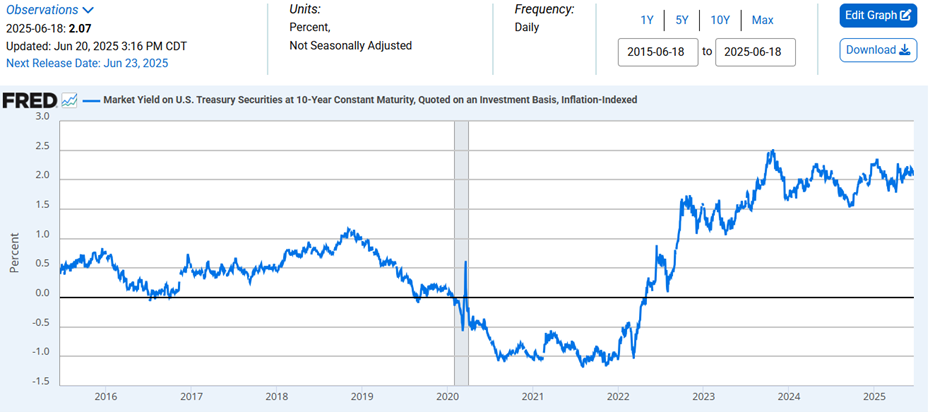
The 10-Year Breakeven is 1.87% and appears “well anchored”.
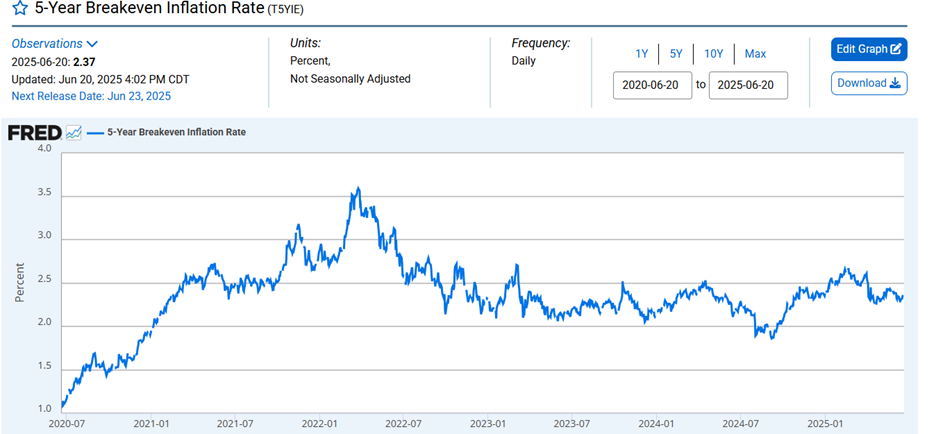
The 5-Year Breakeven is at 2.37% and also appears “well anchored”.
The Federal Reserve pays close attention to inflation expectations. They factor into actual inflation. Monetary policy remains tight with the FFR at 4.25% - 4.50% and core PCE at 2.5% for April. The April inflation number is the lowest since 2021, according to Advisor Perspectives. Monthly, the core PCE increased by 0.1% in April.
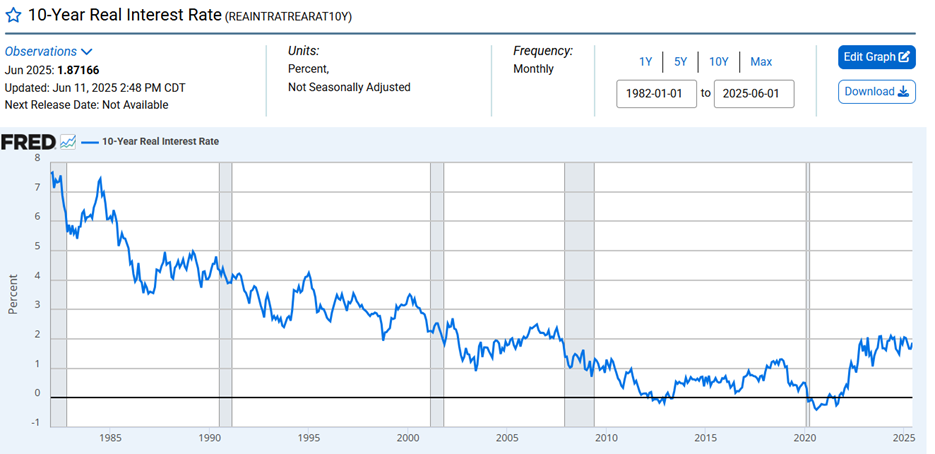
The real 10-Year Treasury Yield (adjusted for inflation) is over 2%, high compared to the last decade.
Not so high looking back further. (chart below)
The 2-Year Treasury yield ended the week at 3.92%. The 10-Year Treasury yield finished at 4.38% while the 30-Year yield was 4.90%. Longer-term rates show no signs of falling. The economy, however, is a different matter. It seems to be softening, although it is early days as far as hard data goes.
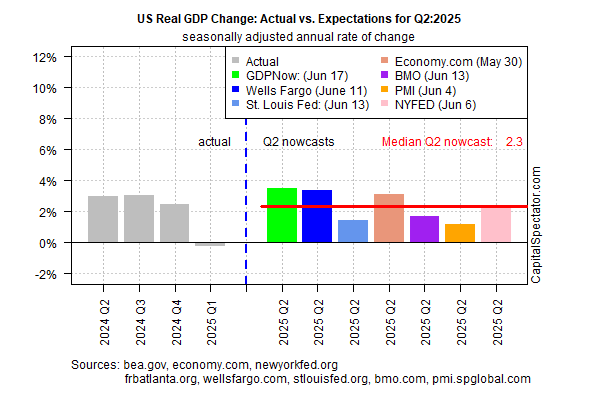
Q2 GDP growth looks to be just fine (chart below). The tariffs are going to hit, but not until Q3.
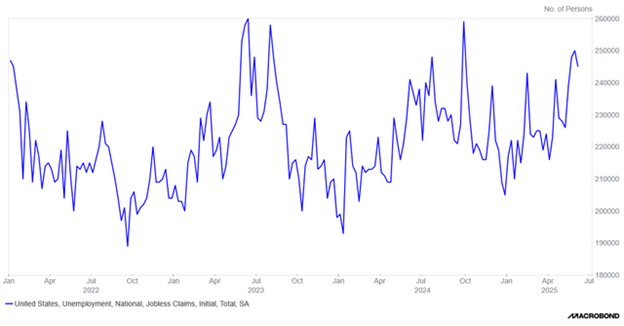
Initial jobless claims are rising. They are a leading indicator for the jobs market. (chart above)
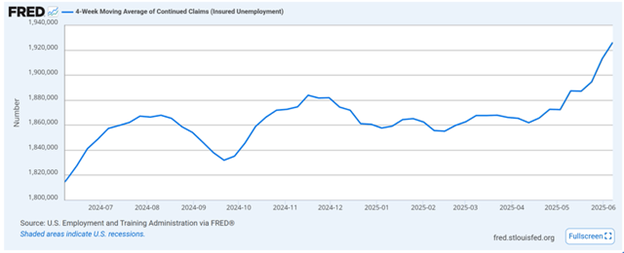
Continuing claims are also rising, which means it is harder to find a job. Continuing claims are also a leading indicator for the jobs market. (chart above)
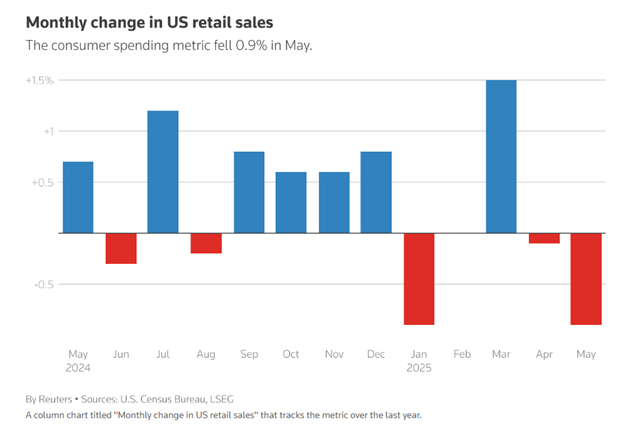
Consumer spending was weak in May. Retail sales have contracted two months in a row.
Yet the Fed isn’t cutting. It wants to see what impact tariffs will have on inflation and economic growth. The risk is that the Fed waits too long to begin cutting. Rate cuts work with long and variable lead times. Recession doesn’t seem to be in the wind for 2025, though. The probability of a continued slowing in the economy is rising, however.
The probability of disappointing earnings in the second half of 2025 is also rising. Poor earnings trends and disappointing guidance would make the stock market vulnerable. The next earnings season starts in July.
Regards,
Christopher R Norwood, CFA
Chief Market Strategist