The Fear Gauge has Fallen
Christopher Norwood • June 30, 2025

Executive Summary

  • The S&P 500 rose 3.4% last week, climbing to 6,173.07
  • The Magnificent 7 are outperforming the S&P 493 by over 18% since April
  • The Cboe Volatility Index (VIX) fell as low as 16.11 last week
  • Investors seem unconcerned about tariffs and war 
  • Treasury interest rates are starting to fall
  • The Fed has little reason to cut if unemployment isn't moving higher
  • The stock market is at record highs
  • Corporate bond spreads are tight, meaning credit is abundant
  • The dollar has fallen by around 10% in 2025
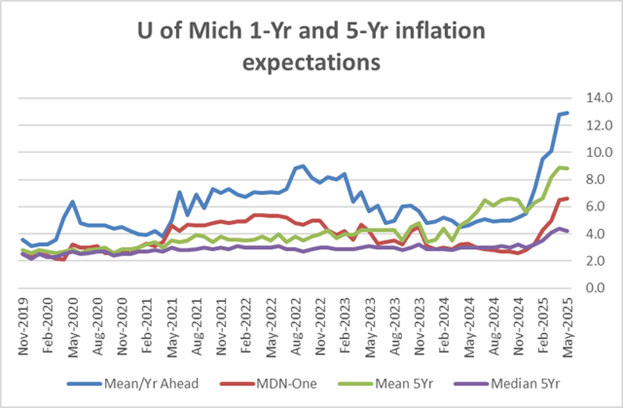
  • Inflation is expected to move higher because of tariff


The Stock Market

The S&P 500 rose 3.4% last week. The Israeli-Iranian ceasefire was credited with the surge to the upside. The index had lost 0.7% over the prior two weeks.

S&P 500 breaking above its recent trading range. (30-day chart above)
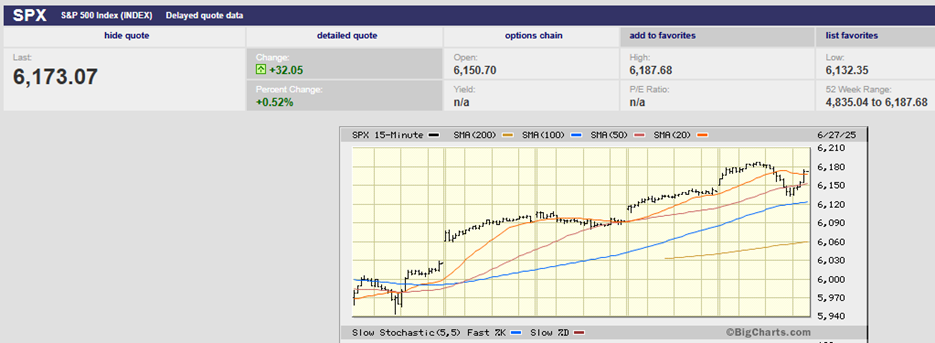
S&P 500 5-Day Chart

Last week was a mostly straight-up affair. Wednesday saw a small give-back before the advance continued. (chart above). The S&P did run into some selling on Friday. It reached an early high of 6,187.68 before falling to 6,132.35, starting around 1:15. Buyers stabilized the S&P over a 45-minute period beginning at 2:30. They pushed the index back toward 6,180 in the last half hour of trading. (see chart below).

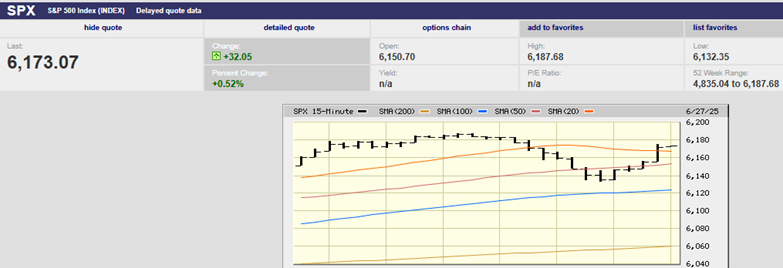
S&P 500 One-Day Chart


The S&P has resumed its uptrend begun 7 April. (chart below). The index bottomed at 4,835.04. It has gained 27.7% since the 7 April low. Of course, it lost 21.3% from 19 Feb. to the 7 April low before the recent rally. The S&P is up 4.96% in 2025.

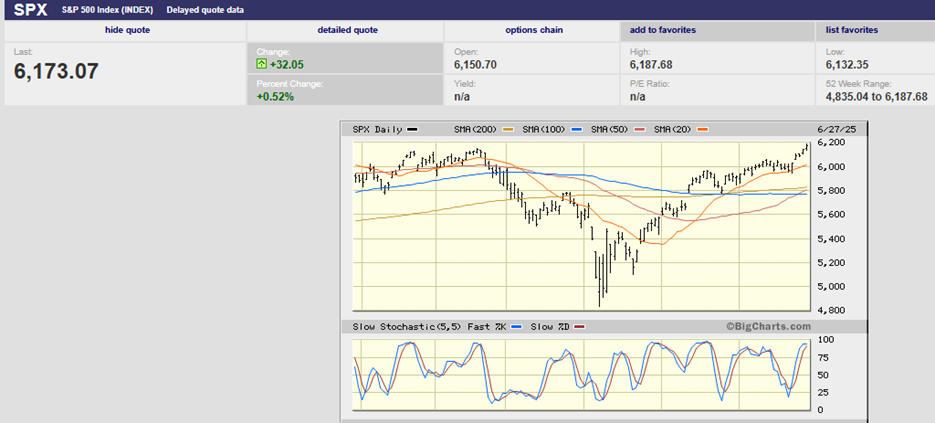
S&P 500- 6-month chart


The broad market isn’t doing as well as the index. The gains since 7 April are courtesy of a handful of mega-cap stocks. The Mag7 trade is back. The top 10 concentration is nearing 40%, a level not seen since the 1960s.

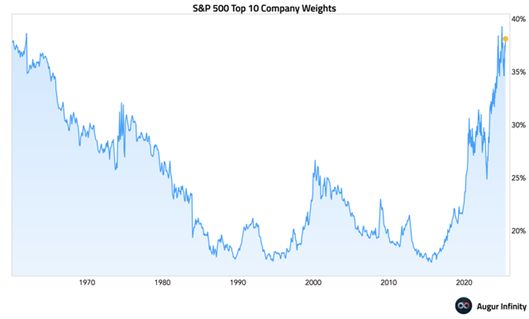
The top 10 stocks accounted for a 25% share of the market during the bubble years of the late 1990s, according to Michael Kramer of Mott Capital. It is over 38% today. The S&P 500 market-cap-weighted index has returned to its all-time high. The S&P 500 equal-weighted index (RSP)remains 3% below its highs. The equal-weight S&P hit its record high in November 2024.

The Magnificent 7 have far outperformed the S&P 493 since April 21. The Mag7 has risen 32.3% while the S&P 493 has only increased by 14%. (chart below)

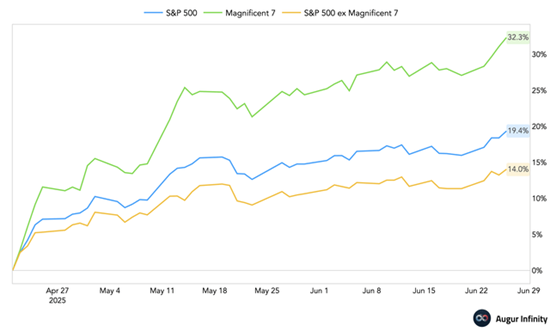
Since the beginning of the year, the S&P 493 has outperformed the Mag7 stocks, though. (chart below)

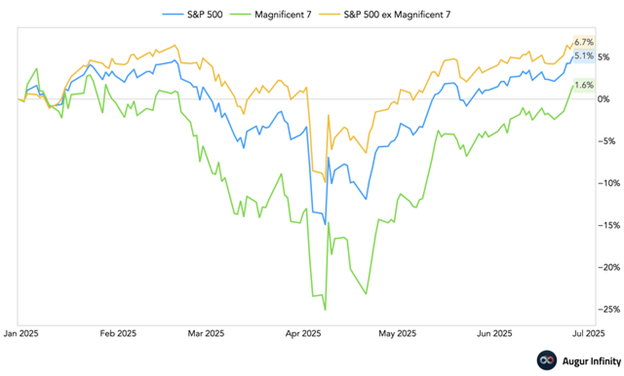
The problem with narrow advances is that they are more susceptible to a reversal. Correlations are higher which means less diversification. Less diversification means more risk. Three-month realized correlations have increased to around 90% across the seven stocks, according to Mott Capital.


For now, though, volatility has continued to fall from 60.13, hit on April 7th.

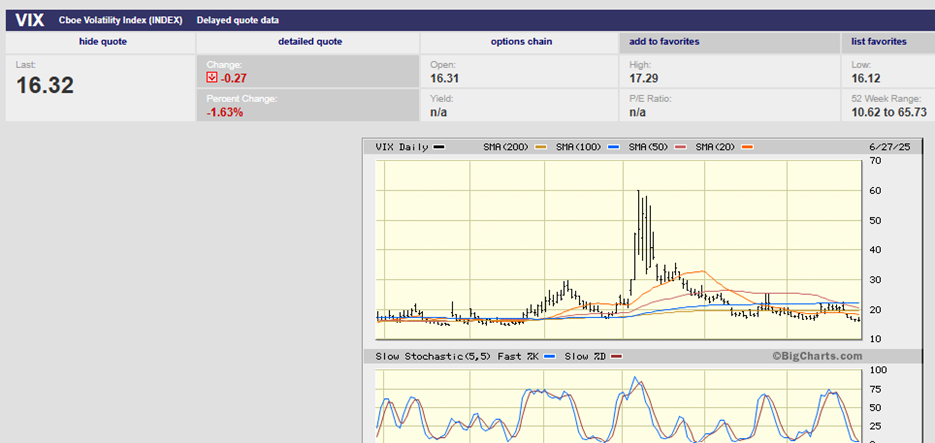
VIX Index 6-Month Chart


The index fell as low as 16.11 last week. The Cboe Volatility Index VIX is a real-time index that reflects the market's expected volatility over the next 30 days. It’s known as the “fear gauge” because it usually increases along with market uncertainty. Option traders can either hedge or speculate using VIX options. A low VIX index makes options cheaper. A high VIX makes options more expensive. Like the prediction markets, real money is invested (gambled?) when traders place their bets. The volatility index can go lower. It hovered in the 11’s a few times in 2024. But fear has subsided for now. A VIX of 16.11 means investors are not particularly concerned about the Middle Eastern conflict or the Tariff War.


The lack of fear bothers Liz Ann Sonders, chief investment strategist at Charles Schwab. “The risk again is that there is too much complacency and an overbought market,” she told Barron’s last week. “July 9th is front and center, and we have no idea how that will play out.”


Sonders also pointed out that big businesses remain far more cautious. Profits could fall. Earnings and revenue growth estimates have been falling since the start of the year. (chart below). “The earnings outlook is murky right now,” she says. “We had a strong first quarter, but there was no extrapolation for the rest of the year.”

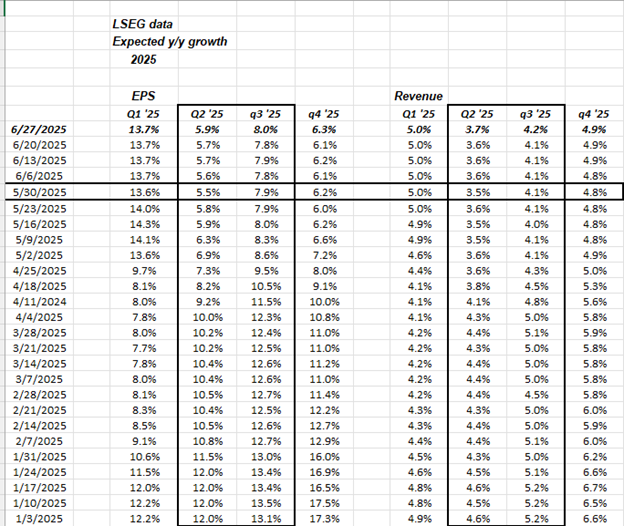
Financial Conditions are easy. That may help reverse the declining EPS and Revenue growth estimates. (Estimates may have bottomed already on 5/30 in the chart above.)

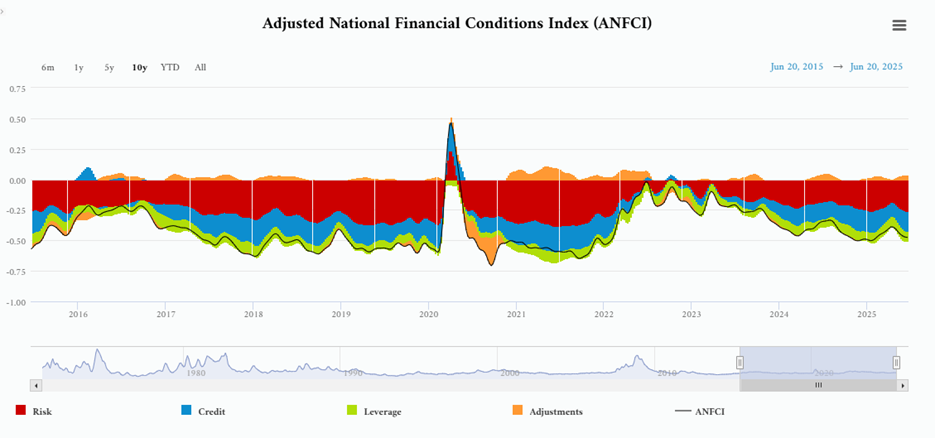
A negative number means that financial conditions are easier than normal. The National Financial Conditions Index has been easy for most of the last 10 years.

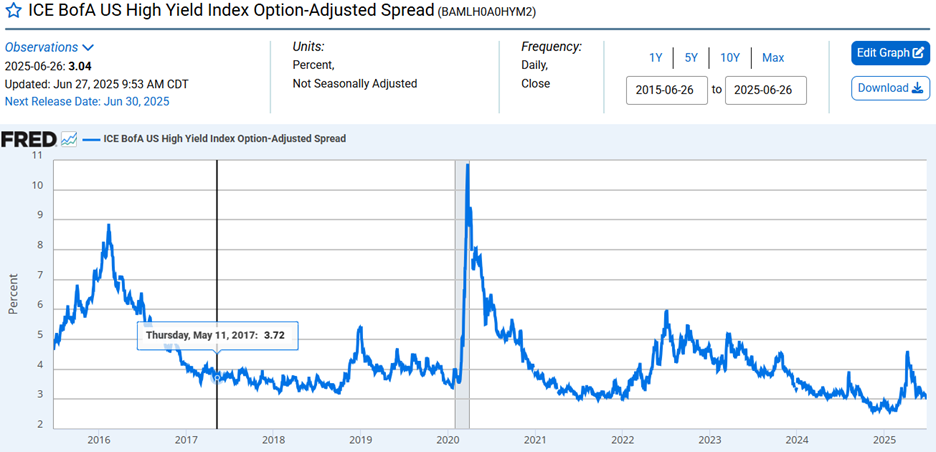
Credit spreads are near all-time lows. Corporations are having no trouble borrowing.
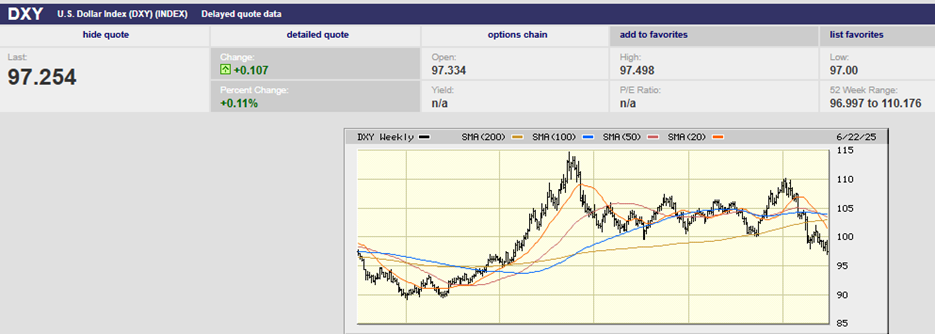
DXY 5-Year Chart


The dollar index is falling, which loosens financial conditions. (chart above)


Interest rates are starting to come down as well. The 10-year Treasury has dropped to 4.28%. The 2-year Treasury yields 3.78%. The entire Treasury yield curve from 2-Year to 10 is now below the current fed funds rate of 4.375%. Falling rates also loosen financial conditions. The yield curve falling below the Fed funds rate is the market telling the FOMC they are behind the curve. Crude oil has fallen to the mid-60s. Lower oil prices would also put pressure on the FOMC to cut the Fed funds rate. Powell and the other FOMC members are holding for now. Let’s not forget that the Fed is usually late.

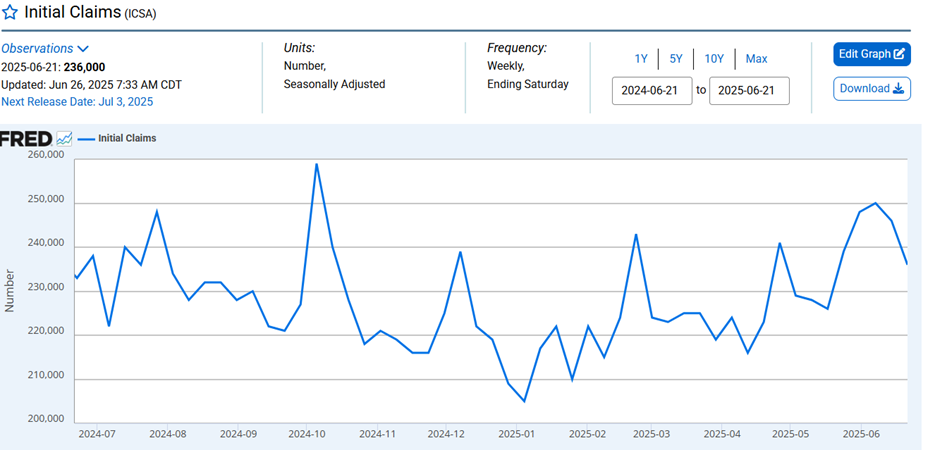
Yet unemployment isn’t rising. Initial jobless claims aren’t rising either (Chart Above). Unemployment is admittedly a lagging indicator. Initial jobless claims though are considered a leading indicator. What’s more, trends in the labor market make it less likely that unemployment will rise. The Fed has little reason to cut if unemployment isn't moving higher.


The consensus guess among economists is for a 125,000 rise in nonfarm payrolls in June. That would be down from May’s 139,000 increase. The jobs number will come out Thursday. The unemployment rate is expected to remain at 4.2%. It may drop.


Deutsche Bank economists estimate that only 100,000 new jobs are needed to keep unemployment steady. The average gain in the first five months of 2025 was 124,000. With no net immigration in flows, only 60,000 new jobs would keep the unemployment rate flat. With deportations, just 40,000 new jobs would hold unemployment steady. Then there is the baby boomer stampede out of the workforce. The surge in retirements is reducing the participation rate. A falling participation rate keeps downward pressure on unemployment. RBC Capital Markets Senior U.S. Economist Michael Reid writes that the U.S. needs more workers rather than more jobs.


The stock market is at record highs. Corporate bond spreads are tight, meaning credit is abundant. The dollar has fallen by around 10% in 2025, also signaling plenty of liquidity. Then there's inflation which is expected to move higher because of tariffs.

Given all the signs of easy money, it’s difficult to understand why the Fed would cut rates. Could bond investors and the yield curve be wrong? It wouldn’t be the first time.


Regards,


Christopher R Norwood, CFA


Chief Market Strategist

By Christopher Norwood June 23, 2025
Executive Summary The S&P 500 gained 0.3% last week, climbing to 5,967.84 The index is having trouble staying above 6,000 Technical indicators are turning somewhat negative The Federal Reserve kept the overnight rate at 4.25% - 4.50% The updated “dot plot” shows a divided Fed Seven members indicate no rate cuts in 2025 Eight members forecast two rate cuts in 2025 The Fed is forecasting a slower economy in 2025 and 2026 The hard data is starting to point to a slowing economy Inflation is still well above the Fed’s 2% target
By Christopher Norwood June 16, 2025
Executive Summary The S&P 500 fell 0.4% last week to finish at 5,976.97 Friday's sell-off due to Israel's attack on Iran The Volatility Index (VIX) is rising due to the war in the Middle East Higher volatility is usually associated with a down move in the market There is no chance of a Fed Funds Rate cut at this week’s meeting according to the CME FedWatch Tool The unemployment rate has been rising slowly The dollar continues to weaken The U.S. needs to reduce its spending to avoid a currency crisis  The Stock Market
By Christopher Norwood June 9, 2025
Executive Summary The S&P 500 rose 1.5% last week to finish at 6,000.36 The May payroll number came in above estimates The U.S. economy is slowing, despite the S&P 500 poking above 6,000 The Labor Force Participation Rate fell to 62.4% from 62.6% Inflation may have bottomed and is set to rise The services price paid index is pointing towards a higher CPI The declining dollar is a concern Tariffs are a tax The Q2 nowcast seems to be indicating that negative economic impacts from tariffs won’t affect Q2 International markets have far outperformed U.S. markets so far in 2025 The Stock Market The S&P 500 climbed 1.5% last week and closed at 6,000.36. The Dow rose 1.3% while the Nasdaq rose 2.0%. Interest rates rose as bond prices fell. A stronger-than-expected jobs report on Friday is getting the blame for rising yields. The jobs report was also responsible for the S&P’s gap-up open on Friday (chart below).
By Christopher Norwood June 2, 2025
Executive Summary The S&P 500 rose 1.9% last week to finish at 5911.69 The S&P 500 rose 6%, the Dow rose 3.8% and the Nasdaq climbed nearly10% in May Could see another test of support around 5,800 this week Several longer-term negative divergences may be pointing to a tough summer Declining new highs during an advancing market is a negative Earnings estimates for 2025 and 2026 have been trending lower Earnings drive the stock market over the long run
By Christopher Norwood June 2, 2025
Executive Summary The S&P 500 fell 2.6% last week to close at 5,802.82. The 20-Year Treasury auction went poorly. The yield rose above 5%. The 5% threshold has twice this year resulted in the administration adjusting its stance on tariffs. (Make that three times as Trump over the weekend gives the U.K. until July 9 th .) Longer-term inflation expectations are rising. Moody’s downgraded the U.S. to Aa1 on 16 May. The credit default swaps market sees the U.S. as a Baa1/BBB+ credit, on par with Greece. The tax cut bill will add to the deficits and debt. Long-term interest rates might well continue to rise.
By Christopher Norwood May 19, 2025
Executive Summary The S&P 500 rose 5.3% last week to finish at 5,958.38 The Dow advanced 3.4% and the Nasdaq added 7.2% A falling VIX means investor confidence is increasing A 90-day pause in the trade war sent the S&P higher Earnings estimates are falling along with GDP growth forecasts Earnings and interest rates drive the stock market over the long run Investors are chasing performance Small business hiring plans and job openings haven’t improved Norwood Economics continues to look for good companies on sale The Stock Market
By Christopher Norwood May 19, 2025
Executive Summary The S&P 500 fell 0.5%, to finish at 5,659.91 The Dow fell 0.3%, and the Nasdaq dropped 0.5% The 200-day moving average is the next resistance U.S. nominal GDP growth expected to slow significantly Bank of America shifts investment focus Norwood Economics already has exposure to gold for most clients Norwood Economics is overweight international stocks The risk of both higher unemployment and higher inflation has increased The Federal Reserve declined to lower the fed funds rate last week The Stock Market
By Christopher Norwood May 5, 2025
Executive Summary The S&P 500 rose 2.9% last week to finish at 5,686.67 The Dow was up 3% last week, and the Nasdaq rose 3.4% The counter-trend rally is ongoing Investors are extremely bearish due to worries about the trade war Political prediction markets are back Exploding imports are not a sign of weakening demand The April jobs report was better than expected The Trade War continues Capital is flowing into international and emerging markets The US dollar will likely continue to weaken The Stock Market
By Christopher Norwood April 28, 2025
Executive Summary The S&P 500 rose 4.6% last week and finished at 5,525.21 Dollar weakness is an unpleasant surprise Tariffs and the dollar's safe-haven status should have pushed the dollar higher The S&P managed to retake the 20-day moving average Investors are looking for a reason to buy Some strategists are advising to sell the bounce Negative supply shocks are bad for the economy Weakness in U.S. bonds, stocks, and the dollar has investors scared Data is beginning to point to an economic slowdown The Chicago Fed National Activity Index (CFNAI) is one of the most important and overlooked economic indicators The Stock Market The S&P 500 rose 4.6% last week and finished at 5,525.21. The Dow rose 2.5% and the Nasdaq gained 6.7%. The S&P’s gains were attributed to President Trump’s statements at a Tuesday press conference. He said that Chinese tariffs would come down, and he wouldn’t fire Fed Chairman Jerome Powell. The 10-year Treasury yield ended the week at 4.25%. The two-year Treasury yield finished at 3.79%. The dollar rebounded. The dollar index (DXY) ended the week at 99.587. It hit a 3-year low of 97.921 on Monday. The DXY has lost 9.6% since mid-January. Tariffs and the dollar's safe-haven status should have pushed the dollar higher, not lower. It is believed that foreigners are repatriating their money. America needs foreign capital. Interest rates will have to go higher to entice foreign capital to our shores if safe-haven status is lost.
By Christopher Norwood April 21, 2025
Executive Summary The S&P 500 fell 1.5% last week to finish at 5,282.70 Counter-trend bounce started on April 7th Counter-trend rallies are short and sharp Thursday was an inside day Any trade war announcements will lead to more volatility Uncertainty is high, and consumer confidence is low The Federal Reserve is focusing on inflation The Philly Fed and Empire State indices continue to rise Small business owners are raising prices to offset input costs The Stock Market is still in a downtrend The Stock Market
More Posts