Executive Summary
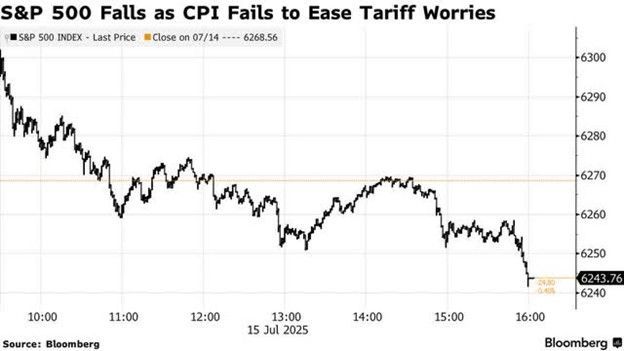
- The S&P 500 rose 0.6% last week to finish at 6,296.79
- The 2-Year trended lower, ending the week yielding 3.88%
- The 10-year Treasury yield ended the week at 4.44%
- Investors are nervous about tariffs and their impact
- Tariffs are coming directly out of the pockets of the US businesses that import the goods
- Rising inflation expectations only increases the chances of higher inflation and interest rates
- Continue to buy good companies on sale

The Stock Market
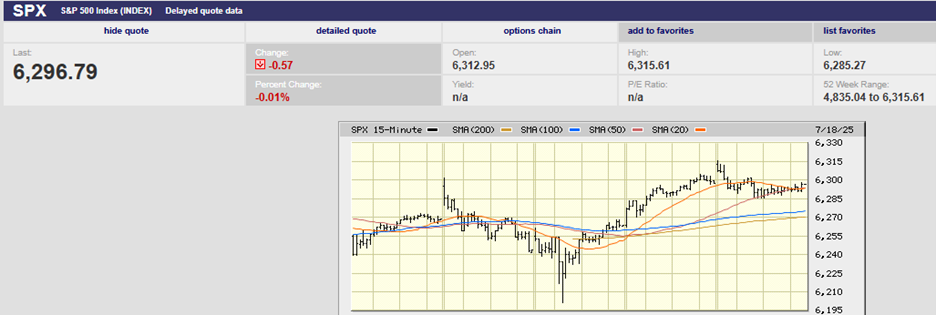
S&P 500 5-Day Chart
The S&P 500 rose 0.6% last week to finish at 6,296.79. It was a week dominated by inflation news. The Consumer Price Index (CPI) was released on Tuesday. The annual rate of inflation increased from 2.4% in May to 2.7% in June. The core rate, which excludes food and energy, rose from 2.8% to 2.9%.
The Nasdaq rose about 1.3% last week. The Dow was down around 0.2%. Two-year Treasury yields fell marginally last week, but not before jumping higher after the CPI report was released. The yield climbed from 3.90% to 3.95% on Tuesday. From there the 2-Year trended lower into Friday and ended the week yielding 3.88%.
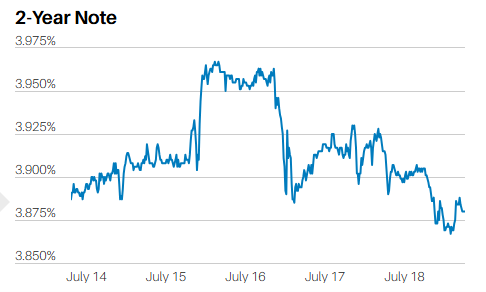
2-Year Treasury Yield 5-Day Chart
The 10-year Treasury yield rose from 4.43% to 4.50% in reaction to the CPI report. From there, the yield drifted lower to end the week at 4.44%, a tick above where it started the week.
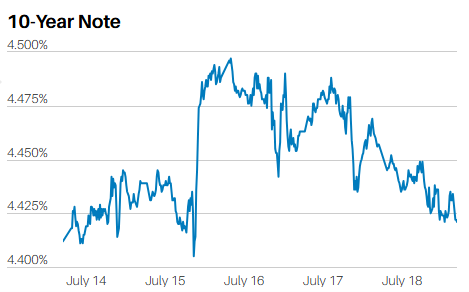
10-Year Treasury Yield 5-Day Chart
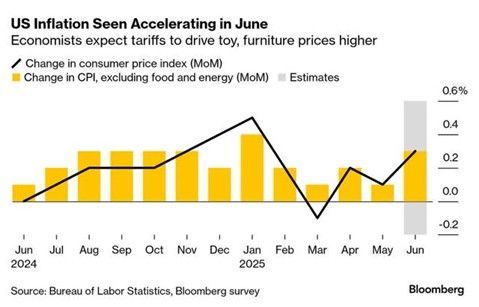
Investors are nervous about tariffs and their impact on both inflation and interest rates. Rising inflation would likely be met with rising longer-term interest rates. Higher rates would negatively impact the economy and likely the stock market. Tariffs are inflationary, but it takes 2-3 months for them to work their way through the economy. We saw the first signs of tariffs impacting consumer prices in Tuesday’s Consumer Price Index (CPI) report for June. The stock market reacted negatively.
An increase in energy prices was partly responsible for the increase in headline CPI. But core goods prices reflected a feed-through of tariffs. Apparel prices increased 0.4% last month. Footwear rose 0.7%. Appliance prices rose the most in nearly five years, according to money manager Lawrence Fuller. Toy prices surged the most since 2021, Fuller added in a note. Furniture and sporting goods equipment also rose in price at the fastest rate since 2022.
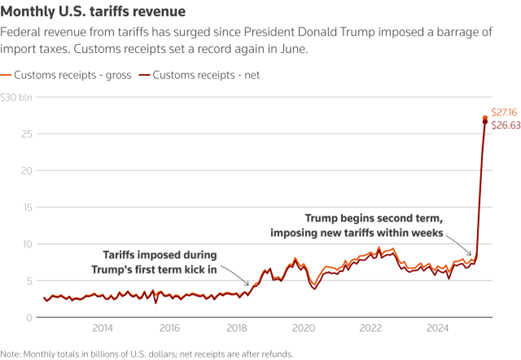
Meanwhile, the federal government collected approximately $27 billion in tariff revenue in June.
Tariffs are coming directly out of the pockets of the US businesses that import the goods. American businesses have a choice. They can absorb the cost of tariffs, depressing profit margins. The other option is to pass the tariffs on to consumers through higher prices. The bottom line, though, is that someone must pay the tariff. And like an income tax, tariffs slow economic growth. Unlike income taxes, tariffs can also cause prices to rise.
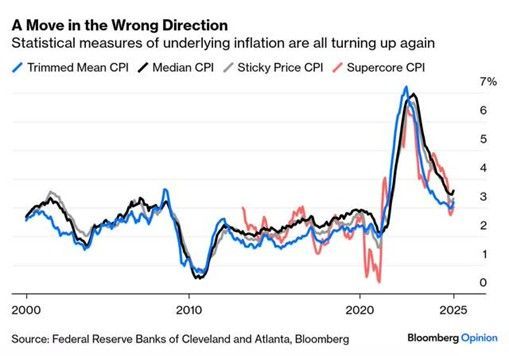
Expectations of inflation can become inflation. That fact is why the Federal Reserve focuses on keeping inflation expectations “well anchored”. Inflation expectations continue to rise. One- and two-year CPI swap rates were trading at 3.5% and 3.1%, respectively, following Tuesday’s CPI report release. (chart below)
Making matters worse, the 5-year CPI swap is also on the verge of breaking out, as it is nearing 2.6%. (chart below).
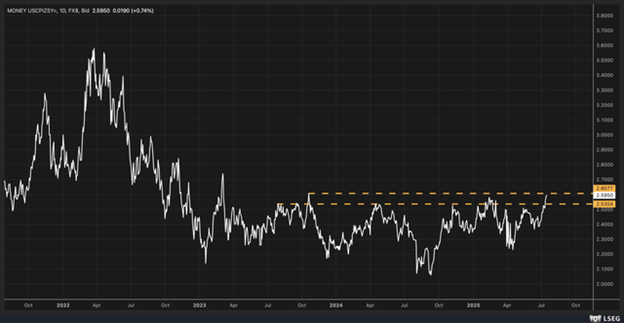
The last time this occurred was in October 2023. You must go back to March 2023 to find a higher value. Inflation expectations appear to be rising. Even the well-anchored 5-year/5-year breakeven forwards are on the verge of breaking out of a trading range. (chart below).
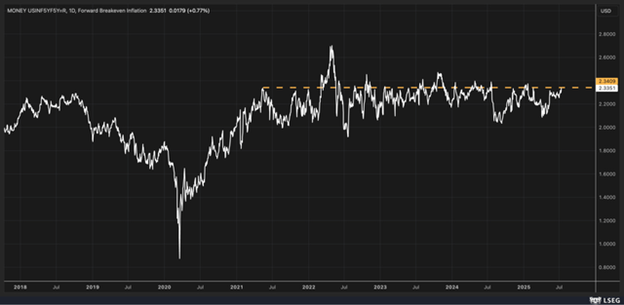
Of course, this is the inflation expectation gauge that gave the Fed chair, Jerome Powell, comfort that inflation expectations were well-anchored. A break above the current range would be worrisome. (The 5 year 5-year forward is an estimate of inflation expectations for the five years that begin five years from the present.)
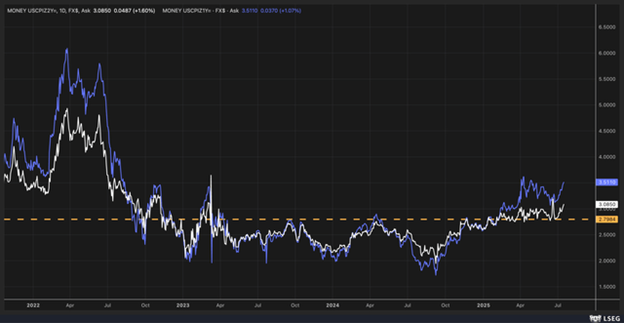
“Treasury rates, such as the 10-year, tend to trade in line with CPI swap pricing. The recent surge in CPI swap pricing suggests that the 10-year rate should be heading higher,” wrote Michael Kramer of Mott Capital last week.
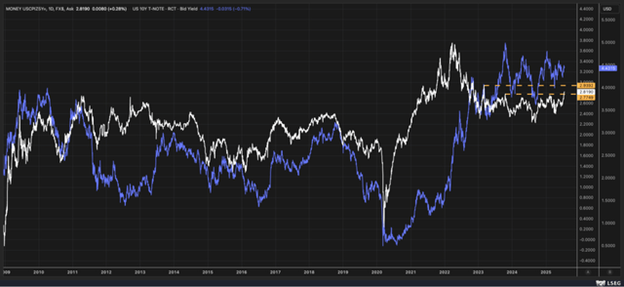
The chart above shows the 5-year swap in white and the 10-year Treasury in purple.
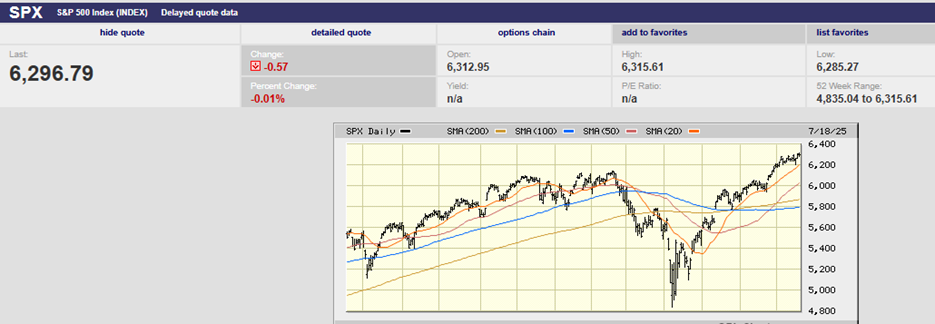
S&P 500 one-year chart
The S&P is up 7.06% year-to-date. It is trading at close to 23x 12-month forward earnings. The long-term average is closer to 16.5. The index has risen 30% since it hit a bottom in April. Low-quality meme-type names are flying, according to Bespoke Investment Group. Unprofitable U.S. companies of all sizes returned an average of 36% through the first half of this year, much more than profitable companies, also according to Bespoke. Long-term interest rates remain stubbornly high and could rise higher. Rising inflation expectations only increases the chances of higher inflation and interest rates. Neither is a positive for an expensive stock market. It is likely we’ll have a pullback in the market before year-end. When and how big a pullback is unknown. By all means, buy good companies on sale when you find them. But buying the market at this juncture is likely to be less than satisfying.
Regards,
Christopher R Norwood, CFA
Chief Market Strategist