Executive Summary
- The S&P 500 fell 2.6% last week to close at 5,802.82.
- The 20-Year Treasury auction went poorly. The yield rose above 5%.
- The 5% threshold has twice this year resulted in the administration adjusting its stance on tariffs.
- (Make that three times as Trump over the weekend gives the U.K. until July 9th.)
- Longer-term inflation expectations are rising.
- Moody’s downgraded the U.S. to Aa1 on 16 May.
- The credit default swaps market sees the U.S. as a Baa1/BBB+ credit, on par with Greece.
- The tax cut bill will add to the deficits and debt.
- Long-term interest rates might well continue to rise.

S&P 500 5-Day Chart
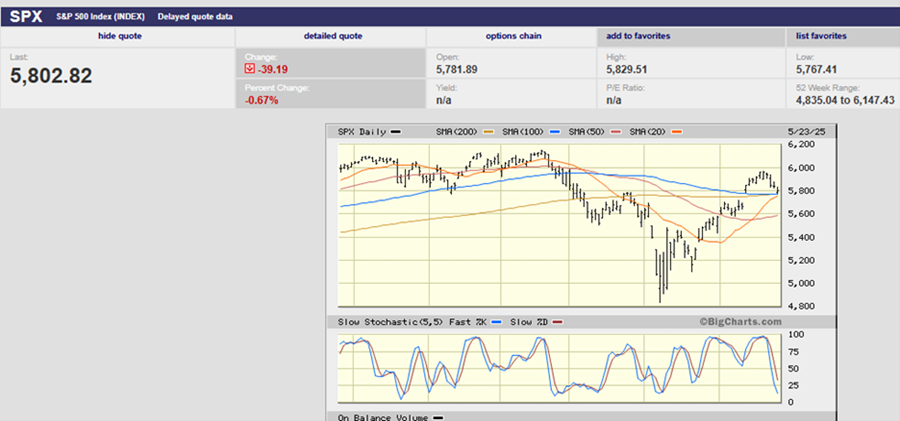
The S&P 500 fell 2.6% last week to close at 5,802.82. The stock market dropped on Wednesday as bond yields rose. The 20-year Treasury bond auction on Wednesday didn't go well. Investors' bids for the $16 billion worth of bonds were below average. The auction resulted in a high yield of 5.047%. The yield rose further after the auction to 5.127%, the highest since November 2023. Concerns about US budget deficits likely contributed to the tepid demand.
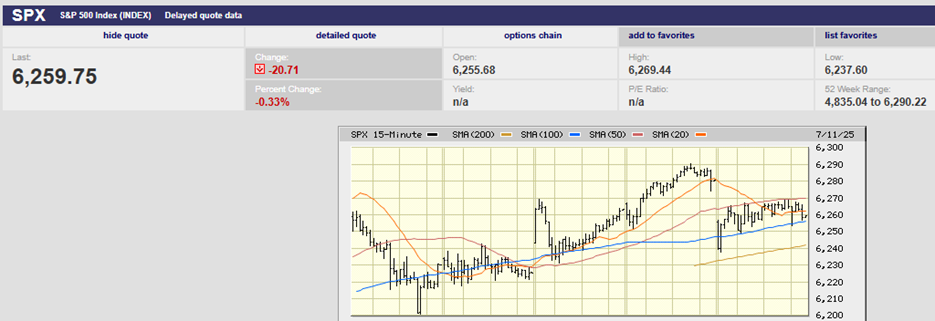
Friday saw another sell-off. The S&P fell to the 200-day moving average at the open. The 20-, 100-, and 200-day moving averages have converged. (chart below). The 5,800 area should provide strong support for the market when it opens for trading on Tuesday. There may be some more downside testing early in the coming week, but strong support is likely to hold.
S&P 500 6-Month Chart
The gap down Friday was blamed on President Trump's trade war tweets. The President threatened more tariffs on the European Union and Apple. Rising long-term bond yields aren’t helping the stock market either. The 2-Year Treasury ended the week yielding 4.00%. The 10-year Treasury finished the week yielding 4.51% while the 30-year yield rose to 5.05%.
The S&P has rebounded from its 21% decline earlier this year. The speed of the recovery makes further gains less likely. Chris Galipeau, Senior Market Strategist at Franklin Templeton, made that point in a note last week. The VIX closed over 50 on April 8th. He wrote that a VIX over 50 leads to a median gain of more than 20% over the next 12 months. “We got that in five weeks,” Galipeau says. “I would not chase stocks here.”
“Over the very near term, we would need positive trade developments to get to new all-time highs,” says Anthony Saglimbene, Chief Market Strategist at Ameriprise. “A prolonged period of trading sideways for a while could take some of the froth out of the market.”
Fiscal and monetary policy, plus a trade war, are much on investors' minds. All three macro-factors will likely influence the stock market’s path over the next year.
There is great uncertainty surrounding monetary policy currently. “The Federal Reserve may leave its benchmark interest rate unchanged until at least September," New York Fed chief John Williams indicated last week. Shifting trade policies continue to cloud the economic outlook. "It's not going to be that in June we're going to understand what's happening here, or in July," Williams said Monday. "It's going to be a process of collecting data, getting a better picture, and watching things as they develop," he added.
The CME FedWatch tool is projecting a fed funds cut in September and another in December.
Barron’s wrote last week that, “Atlanta Fed President Raphael Bostic sees only one rate cut this year amid tariff uncertainty." Bostic said the Fed may wait 3–6 months to see how things settle.
The Fed’s ability to cut rates would appear limited for now. The uncertainty surrounding tariffs makes it difficult to project inflation trends. Rising long-bond rates aren't helping. Investors see inflation on the horizon. They may also be pricing in credit risk.
The 30-year Treasury yield closed the week at 5.05%, a level not seen since 2023, according to Barron’s. The 5% threshold has twice this year resulted in the administration adjusting its stance on tariffs, according to Invesco. With the long-bond yield back over 5%, expect an announcement from Trump this weekend.
Meanwhile, longer-term inflation expectations are rising, according to the latest Fed survey. Median inflation expectations were unchanged at the one-year-ahead horizon at 3.6%. But they increased by 0.2% at the three-year horizon to 3.2%, the highest reading since July 2022. The unemployment rate has remained at 4.2%. That’s well off its low of 3.4% but still a low reading.
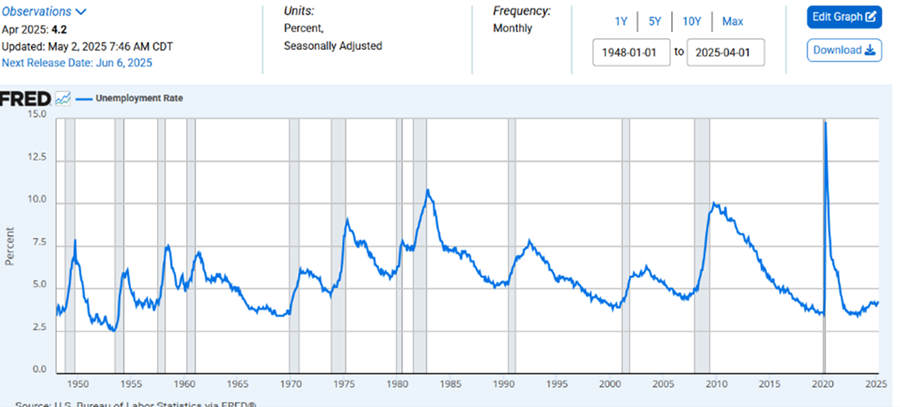
Unemployment Rate
Monetary policy is unlikely to be of much help to the stock market for the rest of 2025. Inflation is still too high. Inflation expectations are rising. Unemployment is low. The hard data shows a consumer still spending.
Fiscal policy is the purview of Congress. The House passed a tax cut bill last week. The bill goes to the Senate now. Trump’s tax bill could add $3.8 trillion to the deficit over the next decade, according to the Congressional Budget Office. That’s likely one reason longer-term interest rates have been rising. The 10-year Treasury yield climbed to 4.54% on Monday after a key congressional budget committee approved the tax bill Sunday night. The 10-year closed the week yielding 4.51%. Bond investors are starting to pay attention. Rising government debt and a widening deficit are spooking them.
The US deficit – the difference between what the government spends and how much it collects in taxes – is $1.9 trillion. Moody’s downgraded U.S. debt from AAA to Aa1 on Friday, 16 May. S&P Global downgraded U.S. debt in 2011. Fitch took a similar action in 2023. Moody’s cited rising interest payments on the debt and the increasing federal debt as key reasons for the downgrade. Aa1 is still investment grade. But a ratings downgrade is a warning that America's balance sheet is weakening.
The credit default swaps market isn’t as generous as Moody's. The credit default swaps market is where investors buy insurance against negative events. The cost to hedge U.S. government debt against default is consistent with ratings of Baa1/BBB+. A BBB rating is the lowest level of investment-grade credit.
Doug Kass of Seabreeze Partners pointed out last week in a note that U.S. CDS spreads are approaching those of Greece. The small Mediterranean country is barely investment-grade and has a history of defaults. The U.S. needs to cut spending and raise taxes. Fiscal austerity is needed to put fiscal policy back on sound footing. But that course of action would be political suicide for Republicans, according to BCA Research chief Matt Gertken. He pointed out in a client note last week that Republicans are already facing a backlash from proposed cuts to Medicaid and the Supplemental Nutrition Assistance Program (SNAP). Red States will be particularly hard hit if the cuts are enacted. “The saving grace for the U.S. is that its low-tax regime implies it can raise taxes in the future and improve its sustainability,” he writes.
Aggressive fiscal policy may continue to support the U.S. economy for a while. $2 trillion deficits can't continue though. Deficits of 6.5% of GDP aren't sustainable with an economy that is only growing 2%. It’s not even clear that the tax cut bill will provide more juice for the economy in 2025. The bulk of the bill does nothing more than maintain the status quo by keeping the 2017 cuts from sunsetting.
Michael Darda, Chief Economist and Strategist at MKM Parners, had this to say last week about the tax cut bill:
“The bottom line is the Big Beautiful Bill is an abomination. New tax cuts in the bill are low bang-for-the-buck gimmicks that will not materially alter incentives for working, saving, or investment,” he writes in a client note. Darda believes it would be better if the Tax Cut and Jobs Act expires at the end of the year. “This is the perfect time for austerity given, 1) the fiscal deficit is high and unsustainable, 2) the unemployment rate is low, and 3) the Fed’s policy rate is over 4%.”
It is possible that the “Big Beautiful Bill” passes, and interest rates rise in response. Higher rates would do much to negate any benefits from an extension of the 2017 tax cuts. The economy might be harmed as higher rates weigh on spending. Corporate earnings might disappoint as a result. Of course, that wouldn’t be a good development for an expensive stock market.
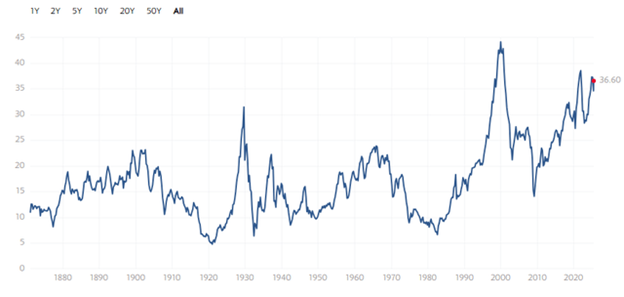
Shiller's P/E
Shiller’s P/E is near all-time highs. (chart above). Shiller’s P/E divides the market price by 10-year average earnings adjusted for inflation. It is a good predictor of 10-year returns.
The bond market vigilantes may have the final say when it comes to fiscal austerity, much as they did in the 1980s. Higher for longer interest rates, both at the short and long end. A bear steepener. Continued trade war uncertainty. Overly optimistic earnings estimates. But also, low unemployment and solid wage growth. A consumer who appears capable of continuing to spend. A trading range market continues to be a likely scenario for the rest of 2025.
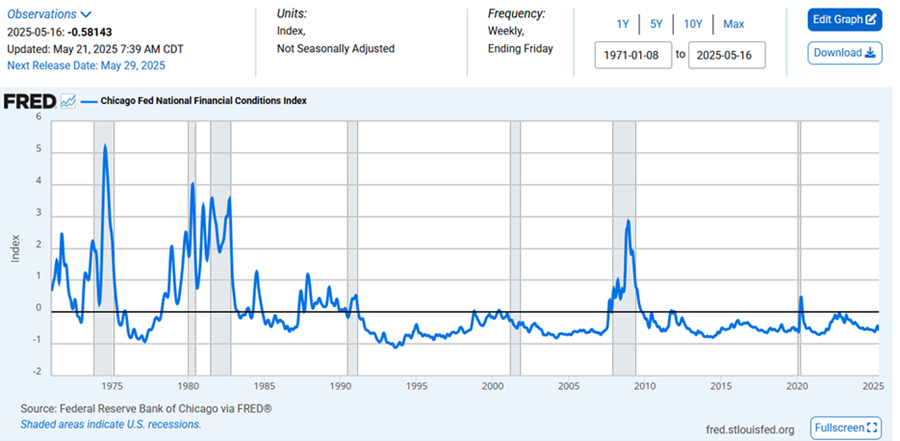
Financial conditions are loose (negative numbers) and have been for most of the last 15 years.
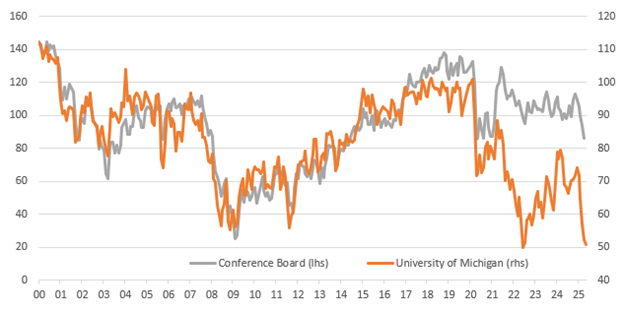
Consumer confidence is falling but the hard data isn’t, at least not yet.
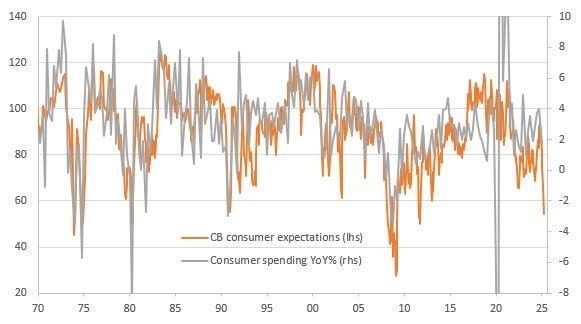
Consumer expectations are falling. Will consumer spending follow?
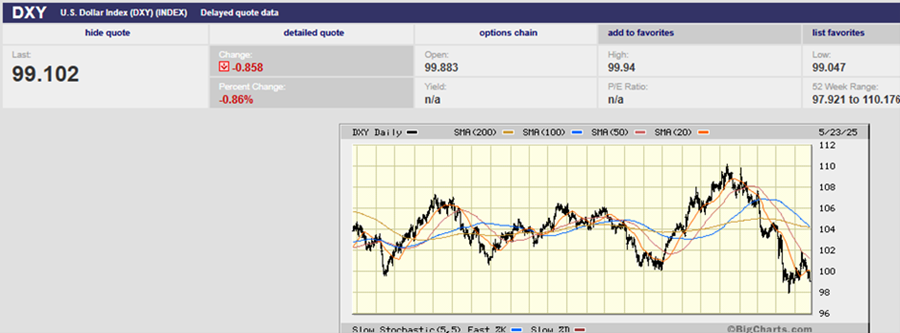
DXY 2-Year Chart
The dollar’s bounce appears over. The dollar is weakening again.
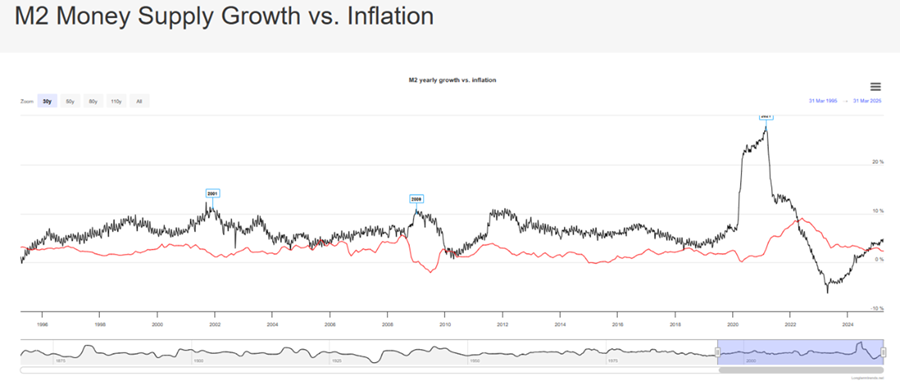
Money supply is rising again (black line above). Inflation tends to follow the money supply with a lag.
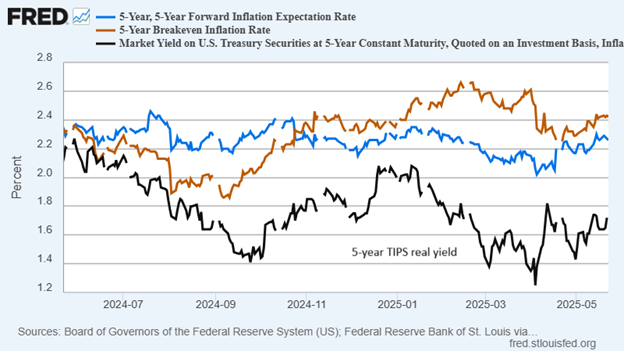
Inflation expectations are rising again. The Fed needs inflation expectations to be “well anchored” before it will risk cutting the Fed Funds Rate (FFR).
Regards,
Christopher R Norwood, CFA
Chief Market Strategist