Executive Summary
- The S&P 500 rose 5.3% last week to finish at 5,958.38
- The Dow advanced 3.4% and the Nasdaq added 7.2%
- A falling VIX means investor confidence is increasing
- A 90-day pause in the trade war sent the S&P higher
- Earnings estimates are falling along with GDP growth forecasts
- Earnings and interest rates drive the stock market over the long run
- Investors are chasing performance
- Small business hiring plans and job openings haven’t improved
- Norwood Economics continues to look for good companies on sale
The Stock Market
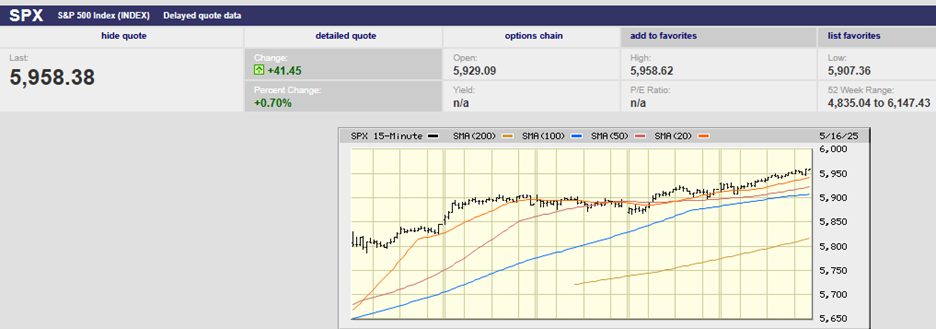
S&P 500 5-Day Chart
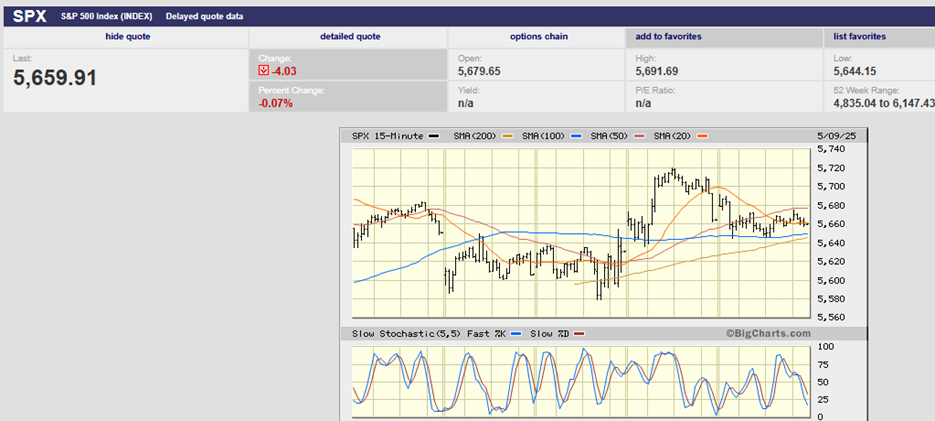
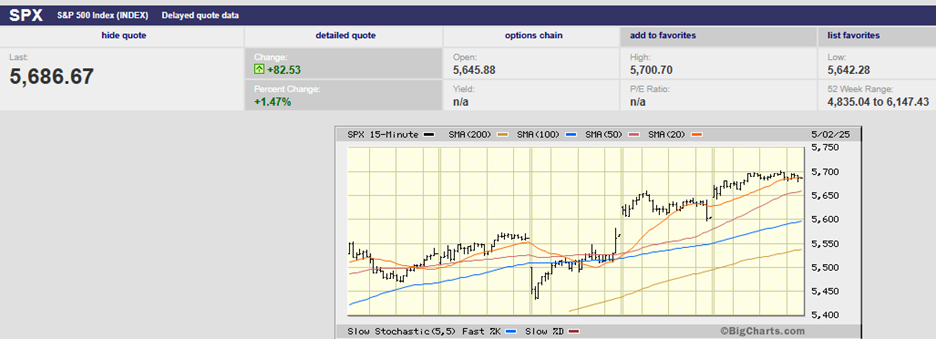
The S&P 500 rose 5.3% last week to finish at 5,958.38. The Dow advanced 3.4% and the Nasdaq added 7.2%. The 10-Year Treasury ended the week yielding 4.48%. The 2-Year yield finished at 4.02% and the 3-month yield closed the week at 4.40%. The S&P mostly made early lows and late highs during daily trading, a sign of strength. The index closed at its high for the day on Friday. Traders were comfortable holding positions over the weekend, also a sign of strength.
Volatility has been dropping as well. The Cboe Volatility Index (VIX) fell below 20 for the first time since late March. The cost of portfolio protection falling means investor confidence is increasing.
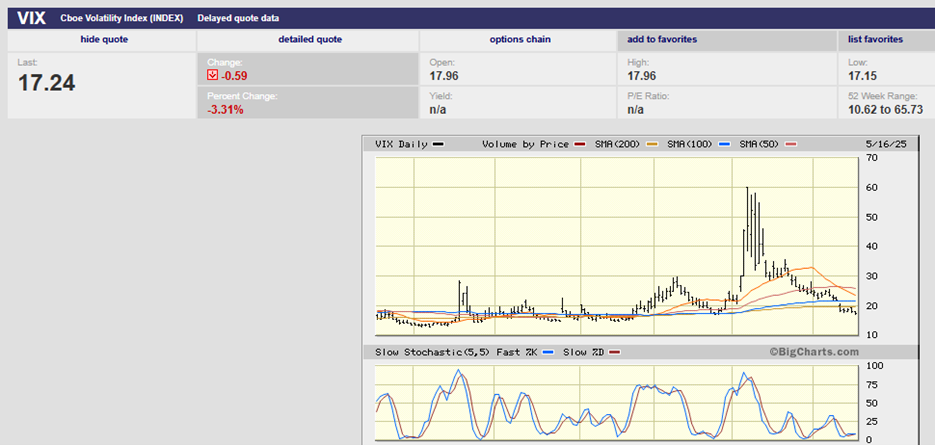
VIX 6-Month Chart
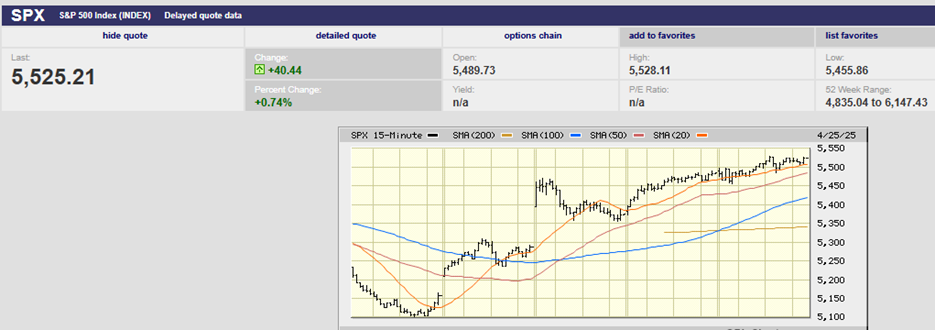
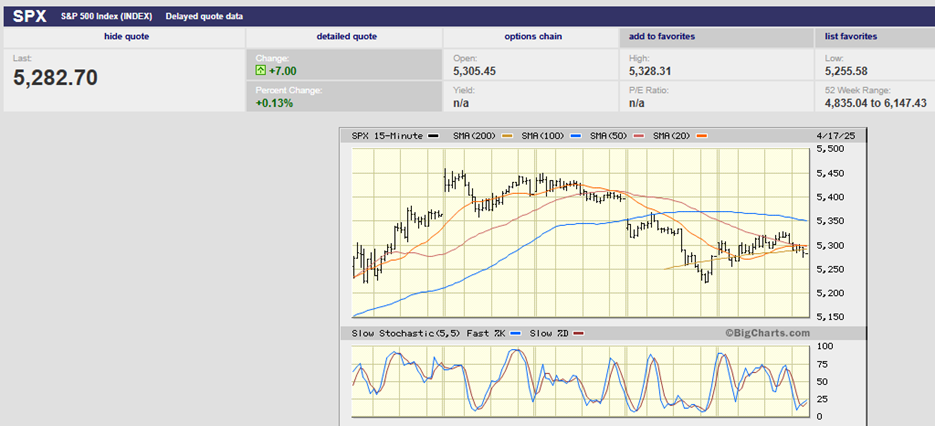
Once again, the stock market didn’t follow the technical script. We wrote two weeks ago that the market looked ready to roll over and begin a pullback. The S&P had stalled under its 200- and 100-day moving averages. The index didn’t roll over two weeks ago, nor did it roll over last week.
Instead, fundamentals “ripped up the script” as Tom Keene likes to say on Bloomberg Surveillance. The S&P vaulted higher on the well-telegraphed weekend announcement of a 90-day pause in the trade war. We wrote last week that, “The S&P won't break above resistance without positive developments on the trade front.” The 90-day pause more than qualified as positive news. At least it qualified in investors' minds.
The S&P has climbed above resistance in the 5,750 – 5,800 area by clearing the moving averages. (chart below). It should prove difficult for the index to push through resistance to a new 52-week high, though. More positive news is likely needed. The stock market has defied the technicals for the last two weeks. We’ll see if it can do so for a third week in a row. Meanwhile, the moving averages and last week's gap become support.
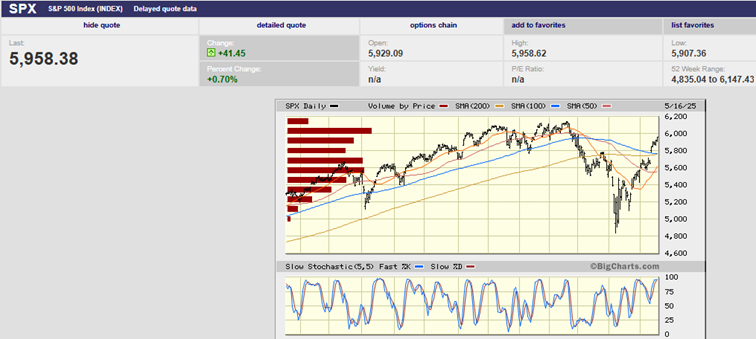
S&P 500 1-Year Chart
Investors are piling back into the market. They are bidding the most popular meme stocks higher.
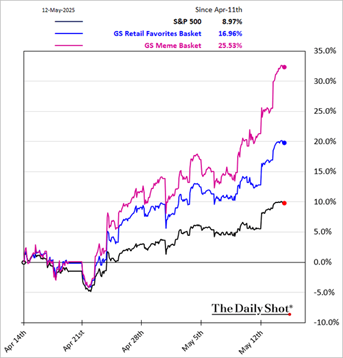
The question is, should they be?
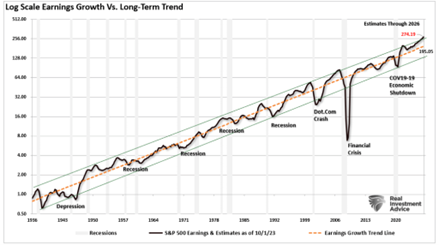
“In the short run, the market is a voting machine but in the long run, it is a weighing machine,” wrote Benjamin Graham, father of securities analysis and value investing.
The famous quote holds a profound truth. Sentiment drives stock markets in the short run. Over the long run, though, earnings and interest rates determine returns. And it is economic growth that drives earnings.
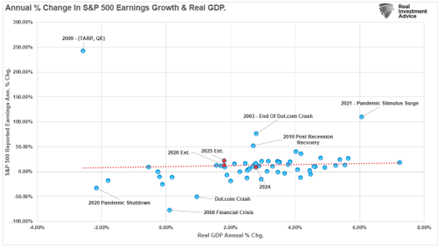
The chart above shows the correlation between earnings growth and real GDP. Deviations are the result of pre- and post-recession earnings fluctuations.
Currently, earnings estimates are falling along with GDP growth forecasts. Earnings estimates are falling in part because earnings growth has been well above trend. The above trend growth isn't sustainable. The above trend growth is the result of unprecedented fiscal stimulus. Unfortunately, the unprecedented fiscal stimulus has resulted in 6% plus budget deficits. Budget deficits of 6% aren't sustainable when the economy is only growing 2%. Budget deficits will be forced to fall, removing the unprecedented fiscal stimulus. Economic growth will slow, and so will earnings growth.
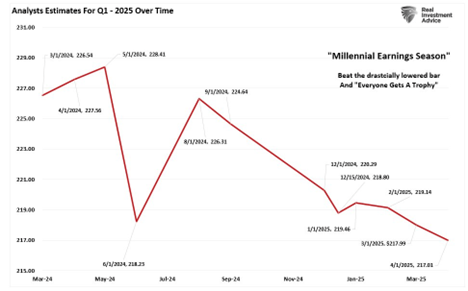
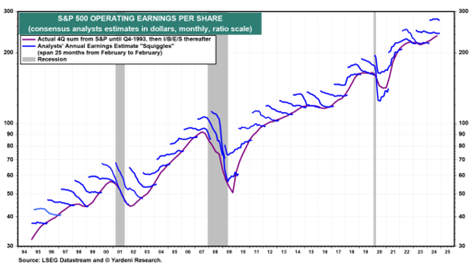
Estimates have been falling for Q1 2025.
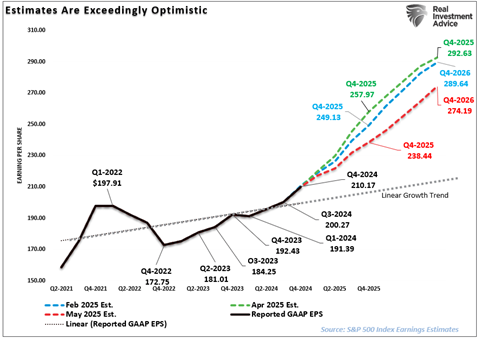
And as of 1 May, S&P Global cut earnings forecasts sharply for all 2025 and 2026. (Chart Below). Estimates for 2026 fell from an April 15th estimate of $292/share to $274. Full-year 2025 earnings estimates fell by $20/share from $258/share to $238/share.
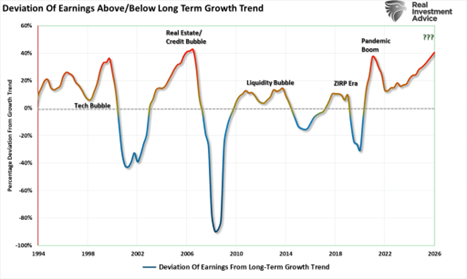
It is the first negative earnings revision for S&P Global, according to Lance Roberts of RIA Pro. Roberts doesn’t think it will be the last. He points out in a recent article that the current linear growth trend for S&P 500 earnings is around $220/share in 2026.
Some amount of negative earnings revisions is normal. Analysts start high and lower forecasts as the earnings period draws closer.
Roberts on earnings forecasting:
In a 2010 study by the McKinsey Group, they found that analysts have been persistently overly optimistic for 25 years. During the 25-year time frame, Wall Street analysts pegged earnings growth at 10-12% a year when, in reality, earnings grew at 6%, which, as we have discussed in the past, is the economy’s growth rate. This is why using forward earnings estimates as a valuation metric is so incredibly flawed—the estimates are always overly optimistic.
Ed Yardeni of Yardeni Research tracks operating earnings revisions (chart below). The slope and length of the blue squiggle lines helps identify earnings estimate trends. That in turn helps Yardeni with his forecasts.
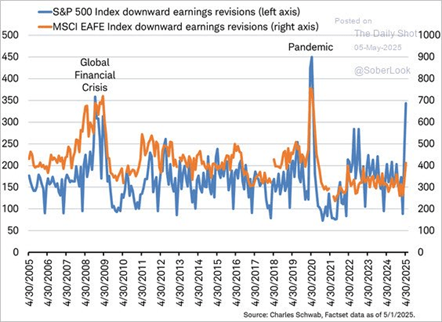
S&P 500 downward earnings revisions have skyrocketed since the trade war kicked off (chart below)
Earnings and interest rates drive the stock market over the long run. Sentiment can only take a market so far in the short run. At some point fundamentals must prove valuations. The falling GDP growth and earnings forecasts mean the S&P 500’s advance is on shaky grounds. The index is now trading at a nosebleed 22x earnings. Something closer to 16.5x is the long run average.
Investors are chasing returns now. They are ignoring downward-trending economic and earnings growth estimates. They also aren’t doing the math on the tariffs that remain in place. The effective tariff rate before the Trump tariff bump was around 2.3%. The effective tariff rate now is around 12% as things currently stand. Someone is going to have to pay the tax. It looks likely that the U.S. and the rest of the world will be dealing with the economic drag of tariffs for years to come. That economic drag isn't in the numbers yet.
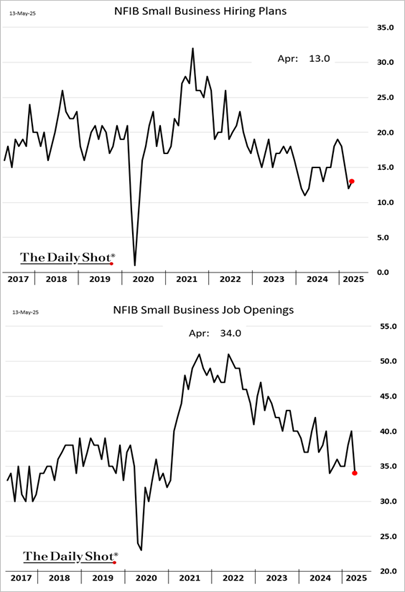
Main Street seems to be more concerned about business conditions than Wall Street. Small business hiring plans and job openings haven’t improved. (chart below)
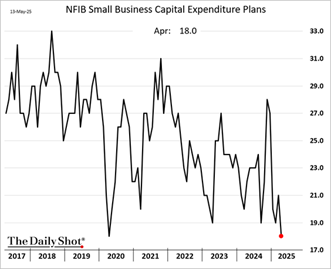
Small business capital expenditure plans haven’t recovered either. (chart below)
The S&P is vulnerable, despite breaking through the 100- and 200-day moving averages last week. The market is expensive, earnings estimates are falling, and uncertainty is still high. Further, the S&P is beginning to run into resistance around 6,000. Chasing performance is a human imperative. It’s also likely the wrong thing to do in the coming weeks.
For its part, Norwood Economics continues to look for good companies on sale. Buying assets for less than they’re worth is a successful strategy regardless of short-term market moves. Patience is required, though!
Regards,
Christopher R Norwood, CFA
Chief Market Strategist