Executive Summary
- The S&P 500 rose 4.6% last week and finished at 5,525.21
- Dollar weakness is an unpleasant surprise
- Tariffs and the dollar's safe-haven status should have pushed the dollar higher
- The S&P managed to retake the 20-day moving average
- Investors are looking for a reason to buy
- Some strategists are advising to sell the bounce
- Negative supply shocks are bad for the economy
- Weakness in U.S. bonds, stocks, and the dollar has investors scared
- Data is beginning to point to an economic slowdown
- The Chicago Fed National Activity Index (CFNAI) is one of the most important and overlooked economic indicators
The Stock Market
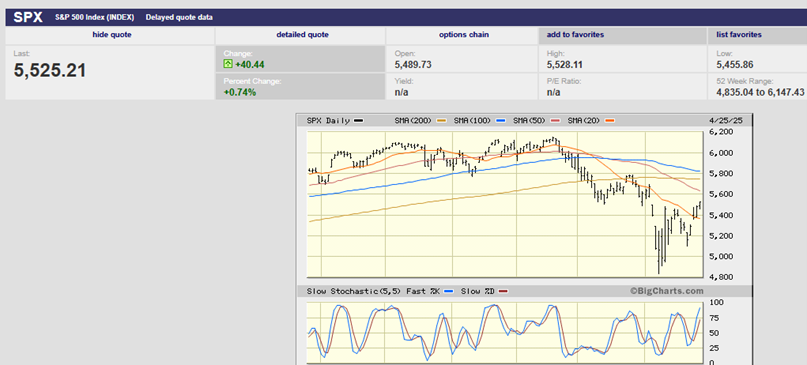
The S&P 500 rose 4.6% last week and finished at 5,525.21. The Dow rose 2.5% and the Nasdaq gained 6.7%. The S&P’s gains were attributed to President Trump’s statements at a Tuesday press conference. He said that Chinese tariffs would come down, and he wouldn’t fire Fed Chairman Jerome Powell.
The 10-year Treasury yield ended the week at 4.25%. The two-year Treasury yield finished at 3.79%. The dollar rebounded. The dollar index (DXY) ended the week at 99.587. It hit a 3-year low of 97.921 on Monday. The DXY has lost 9.6% since mid-January. Tariffs and the dollar's safe-haven status should have pushed the dollar higher, not lower. It is believed that foreigners are repatriating their money. America needs foreign capital. Interest rates will have to go higher to entice foreign capital to our shores if safe-haven status is lost.
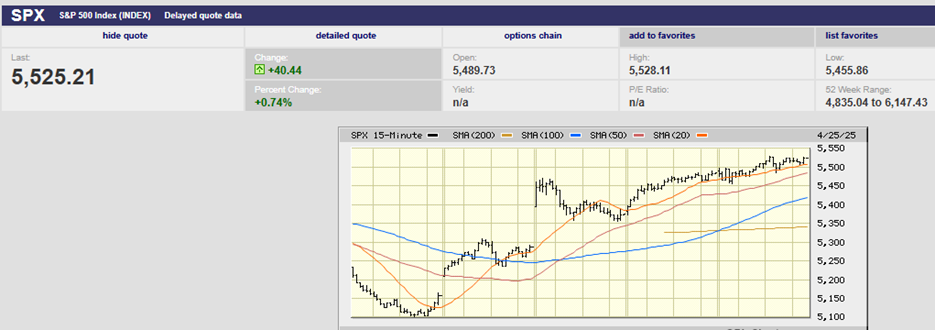
S&P 500 5-Day Chart
The S&P gapped up big at the open Wednesday morning in reaction to Trump’s reassurances (chart above). It spent the rest of the day drifting lower and closed Wednesday near its low. Investors did push the market higher both Thursday and Friday though.
We wrote last week that, “…big fundamental news would supersede any technical trading. From a technical perspective, we’ll need to see which way the market goes in the next few trading days. The odds favor an eventual re-establishment of the downtrend.” What we got was a breakdown on Monday below the prior Wednesday’s low (chart below). But instead of continuing to fall, the market reversed higher on Tuesday. Any traders keying off the prior Thursday’s inside day were stopped out of their short positions. Short covering might have contributed to the bounce on Tuesday and Wednesday.
S&P 500 6-month Chart
The S&P also managed to retake the 20-day moving average (chart above). But its upward ascent will likely hit resistance in the 5,500 – 5,600 area. The 50-day moving average is around 5,610.
Last week’s trading is signaling that investors are looking, hoping, and wishing for some good news on the trade war front. They want to buy but need a positive catalyst. Some strategists are calling for a continued bounce, but a bounce that should be sold. For instance, Frank Rybinski is the chief macro strategist at Aegon Asset Management. He told Barron’s that earnings estimates are too high. The consensus forecast is around $264, which puts the S&P 500 at 21x earnings. Rybinski thinks 19 times is more appropriate if earnings growth is flat in 2025. That would leave the S&P 500 at 4750. Bob Shea, chief investment officer at Dynasty Financial Partners, thinks the bounce is temporary, according to Barron’s. He thinks the S&P 500 will retest the 7 April low at a minimum.
Freya Beamish is chief economist at TS Lombard based in London. She had this to say last week to Barron's:
"There are only two or three months of wiggle room to keep tariffs at these levels before you create shifts in the real economy... that lead to shifts in the markets. ... Inflation is rising for the wrong reasons and destroying growth. But the difference between “little bear” and “big bear” will depend on whether Trump keeps tariffs on."
She points in particular to negative supply shocks created by Trump's policies. Tariffs take goods out of the system. That's because firms can’t use existing supply chains efficiently. Production is lost. Deportations take people out of the labor pool. Together, tariffs and deportations are increasing the risk of negative supply shocks. Beamish envisions a macro environment similar to the COVID pandemic. Negative supply shocks will put upward pressure on prices. They will also put downward pressure on economic activity. Rising input costs and falling demand are a recipe for lower earnings.
We are seeing slowing economic activity already. The U.S. Q1 GDPNow forecast is for a contraction of 0.4% adjusted for imports and exports of gold.

Earnings estimates are coming down all over the world because of uncertainty.
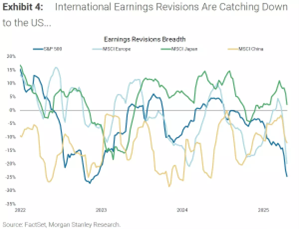
Falling earnings estimates threaten both the global and U.S. economy. And then there is the declining dollar.
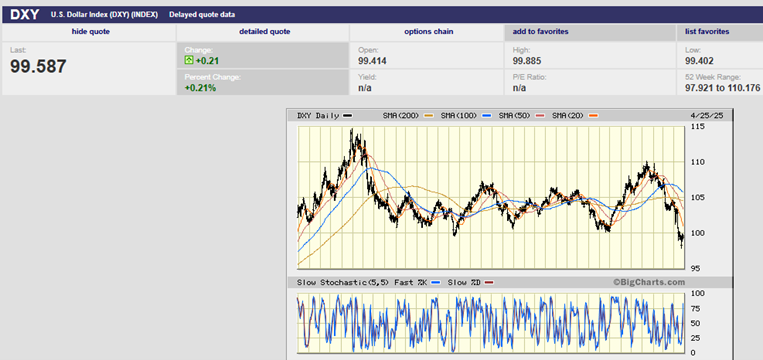
DXY 3-Year Chart
The DXY is down almost 10% since mid-January. It hit a three-year low on Monday.
Simultaneous weakness in U.S. bonds, stocks, and the dollar has investors scared. It points to a possible long-term major paradigm shift. Investors normally run to the dollar as a haven when risk rises. Right now, they are running away. America is privileged that the dollar is the world’s reserve currency. It’s a privilege because dollar demand keeps U.S. interest rates lower than otherwise. “If the currency system changes fundamentally, yields will go much higher.” Beamish told Barron’s.
She added:
“If there is a genuine shift away from the dollar as a reserve currency, whether purposely initiated by the U.S. administration or occurring by accident, there would be disruptions throughout the financial system, well beyond what we are seeing now.”
Falling earnings estimates and a slowing economy are not conducive to stock market gains. Data is already beginning to point to a slowdown.
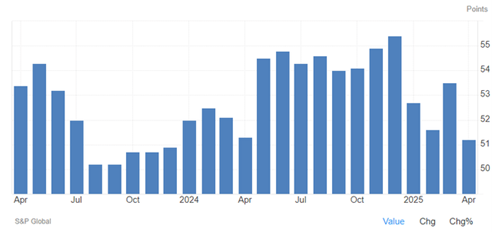
S&P Global Flash Composite
The S&P Global Flash Composite PMI measures business trends for services and manufacturing companies (chart above). It fell to a 16-month low of 51.2 in April from 53.5 in March. It is still above the 50 level which implies growth. But the drop points to a slowing economy in Q2.
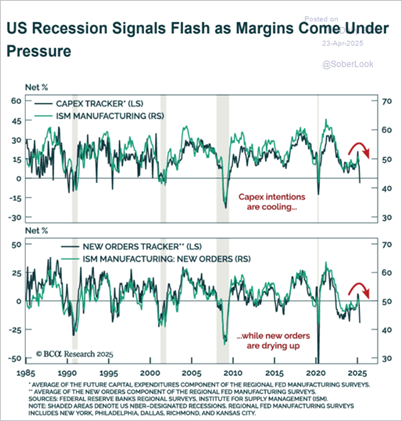
Danielle Park, CFA pointed to capital expenditures and new orders last week. The chart below is from the Daily Shot. Capex and new orders have fallen to levels that coincide with the recessions of 2020, 2008, 2001, and 1990 (grey bars).
Also, the Chicago Fed’s National Activity Index (CFNAI) three-month moving average decreased to negative 0.01 in March from +0.12 in February.
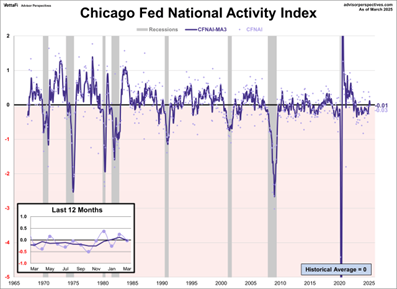
The CFNAI is a forward-looking indicator. It forecasts how the economy will look in the near term. It has been called one of the "most important and overlooked economic numbers," according to Advisor Perspectives. The index is constructed so a zero value for the index indicates that the national economy is expanding at its average rate of growth. Negative values indicate below-average growth, and positive values indicate above-average growth.
TS Lombard sees a high probability of a recession if tariffs aren’t reduced in the next two to three months. The firm points to uncertainty as impacting economic activity regardless of the eventual level of tariffs. A drop to an 8% effective tariff rate would slow U.S. economic activity to 1.5% growth for 2025, according to Lombard. That’s a big hit and would likely be reflected in the stock market.
Caution is the watchword of the day.
It is not a time to panic, though. Norwood Economics serves as a 401(k) plan advisor for 25-plus companies. We spend time talking with plan participants, educating them about their plan. But also passing along our thoughts on the economy and capital markets. We sense that people are getting scared. They are beginning to talk about reducing their exposure to the stock market. We caution investors not to react to short-term results, not to try and time markets. It doesn’t work. Make sure you’re in a portfolio that is appropriate for your long-term needs. Stay the course.