Executive Summary
- The S&P 500 fell 0.4% last week to finish at 5,976.97
- Friday's sell-off due to Israel's attack on Iran
- The Volatility Index (VIX) is rising due to the war in the Middle East
- Higher volatility is usually associated with a down move in the market
- There is no chance of a Fed Funds Rate cut at this week’s meeting according to the CME FedWatch Tool
- The unemployment rate has been rising slowly
- The dollar continues to weaken
- The U.S. needs to reduce its spending to avoid a currency crisis
The Stock Market

S&P 500 5-Day Chart
The S&P 500 fell 0.4% last week and closed at 5,976.97. The Nasdaq dropped 0.6%. The S&P lost 1.13% on Friday in reaction to Israel attacking Iran. The index fell from 6,045 to 6,010 in the first minutes of trading but bounced to 6,027 by noon as buyers stepped in. Selling increased around noon, though with the index falling as low as 5,963.21 by 2:30. The S&P moved sideways during the last 90 minutes of trading, revisiting the 5,963.21 low by 3:45. Still, the reaction to missiles flying in the Middle East was muted, at least on Friday.
Iran is retaliating against Israel over the weekend. It is launching a “massive drone and missile strike on Israel,” according to Politico. The Israeli’s in turn, are promising that “Tehran will burn” if the Iranian attacks continue. A down open on Monday is most likely. An ongoing back-and-forth war between Israel and Iran could trigger a correction in the U.S. stock market. The S&P is above its 20-day moving average, which is around 5,950. It's also above its 200-day moving average, which is at 5,800. Both moving averages provide support. There is also the 5,767.41 May 23rd low, which would act as support. The S&P will need to fall below the May 23rd low, a 3.5% pullback from Friday’s close, before investors need to worry about a deeper correction.
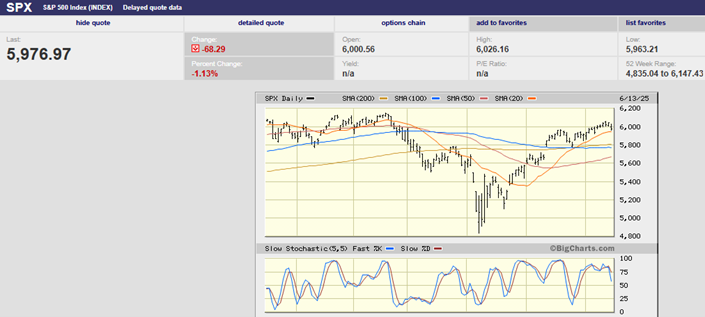
S&P 500 6-Month Chart
The situation in the Middle East is uncertain. The coming weeks promise to be volatile. The Volatility index (VIX) has risen above 20 from a low of 16.23 on 11 June.
(The VIX Index, often dubbed the “fear gauge” of the stock market, measures the expected volatility of the S&P 500 index over the next 30 days. A higher VIX indicates greater anticipated volatility and, by extension, suggests that investors are fearful of declining stock prices. Conversely, a lower VIX indicates more stability and investor confidence in the market.)
The VIX hit a high of 60.13 on 7 April. It has been falling ever since. The S&P hit its low for the “liberation day” sell-off on 7 April. It has been rising ever since. The VIX only managed to rise to 22 on Friday. Investors aren't exactly quaking in their boots. A low VIX in the face of Middle East missiles flying smacks of complacency. There’s a chance that investors will wake up one morning soon and decide they need to do some selling. It’s a truism on Wall Street that periods of low volatility are followed by periods of high volatility. Complacency is followed by fear, in other words.
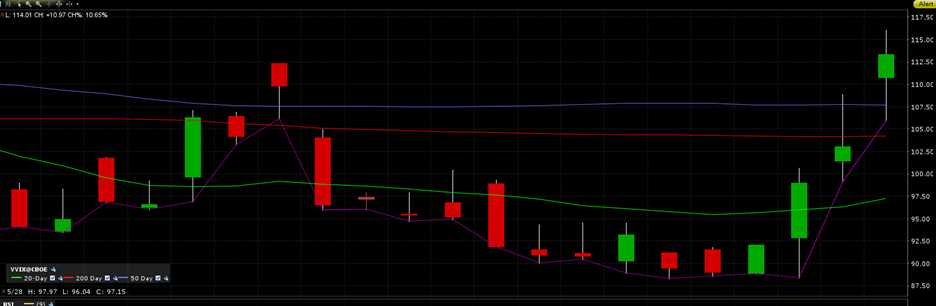
Cboe VVIX 1-month chart
And in fact, the market appears to be anticipating higher volatility. The Cboe VVIX has started to rise (chart above). VVIX measures the volatility of the S&P VIX Index. VVIX frequently leads the VIX higher and lower. The VVIX has increased for four consecutive days, beginning on Tuesday. It had also fallen to the low end of its trading range before the recent rise, according to Michael Kramer of Mott Capital Management. All in all, the S&P is likely to see higher volatility in the coming weeks. Higher volatility is usually associated with a down move in the market.
Bond yields fell last week following a softer-than-expected Consumer Price Index (CPI) report. The 2-Year Treasury yield finished the week at 3.96%. The 10-Year Treasury yield closed out the week at 4.40%. The 6-Month Treasury Yield ended the week at 4.32%. The Fed funds rate is 4.25% - 4.50%. The bond market isn’t expecting a Fed rate cut in the next 6 months based on the 6-month yield. The Fed meets this week.
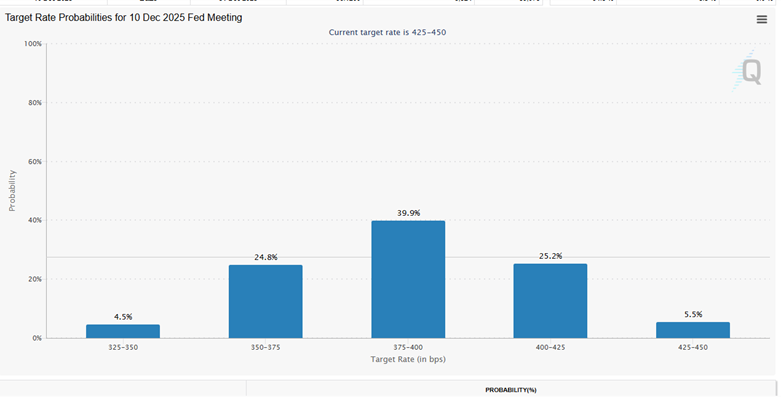
There is no chance of a cut at this week’s meeting according to the CME FedWatch Tool. The FedWatch Tool places a 76.9% chance that the funds rate will remain at 4.25% - 4.5% in July as well. A cut is given a 56.8% chance at the September meeting and a 78.6% chance at the October meeting. The bond market is expecting the funds rate to fall to 3.75% - 4.00%, plus or minus a quarter point by the December meeting.
The Fed might cut once or twice in 2025. But only if inflation doesn’t start rising once again AND we get the expected economic slowdown. We wrote last week about a slowing economy and a jobs report that wasn’t as strong as it seemed. We also wrote that inflation has likely bottomed for now. (see From the Bleachers, Vol. 334 from last week for more details). We'll get rate cuts in 2025 if the economy slows and inflation continues to fall. Otherwise, the Fed might be on hold until 2026. It’s unknown what the Fed will do if the unemployment rate continues to rise along with inflation.
It’s reasonable to expect that unemployment will continue to rise and the Fed funds rate will resume falling.
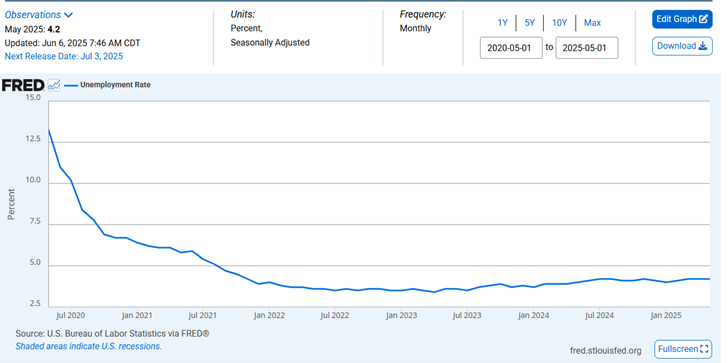
The unemployment rate has been rising slowly since it bottomed in April of 2023 at 3.4%.
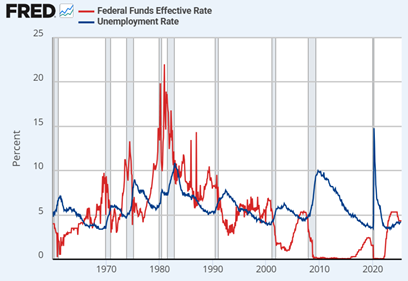
History shows that the Fed funds rate falls when unemployment is rising (chart above). Unemployment has been rising.
Commentary from James Picerno, director of analytics at wealth manager The Milwaukee Co.:
“The tariff war is slowing growth, and there are signs that the labor market is cooling, albeit gradually and in fits and starts. Jobless claims rose to a seven-month high, suggesting that hiring will continue to ease. Payrolls are still growing at a moderate pace, but the three-month average has fallen and is close to the slowest pace since the rebound from the pandemic.”
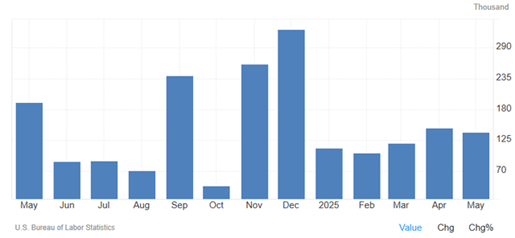
Payrolls Report
Further, initial jobless claims have been climbing, as have continuing claims. This from Bank of Montreal:
“U.S. initial claims [for unemployment insurance] were unchanged in the latest week at 248,000, one of the higher levels of the past two years. However, more of an eyebrow-raiser was the 54,000 jump in continuing claims (the most in nearly two months), to 1,956,000, a number not seen since early 2018 (outside of the pandemic). This signals the longer time it is taking for those out of work to find a job.”
A Reuters poll has most economists forecasting that the central bank will leave its target rate unchanged for the next several months, according to Barron’s. “As long as the labor market looks fine, we expect the FOMC to continue to stay on hold, and use rhetoric to bolster their inflation-fighting credibility,” Jonathan Pingle, chief U.S. economist at UBS told Barron’s
Morgan Stanley analysts expect a significant steepening of the yield curve. They think the steepening will begin in late 2025. Morgan Stanley doesn't think the Fed will cut in 2025, though. It does think the entire yield curve will start to fall by year-end, particularly the short end. The bank is expecting the 10-year Treasury yield to fall to around 4% before the end of the year. Morgan Stanley analysts forecast that 2026 will see a continued decline in yields. Economic weakness will be the catalyst, according to MS analysts.
Billionaire hedge fund manager Paul Tudor Jones told Bloomberg Thursday that short-term Treasuries are his favorite trade for the next twelve months. He reasons that President Trump will replace Fed Chair Powell with an uber dovish chairman in May 2026. Jones is expecting the Fed to drop the funds rate to as low as 2% in 2026 at Trump’s request. Meanwhile…
There’s a war going on in the Middle East. It may be short. It may not escalate. But there’s no guarantee of either. Volatility is set to rise, putting downward pressure on the stock market. The Fed is likely on hold until at least September. Longer-term rates seem to have stabilized at a higher level for now. Higher long-term rates are a negative for both the economy and the stock market. But at least rates have stopped moving higher. The dollar continues to weaken, though.
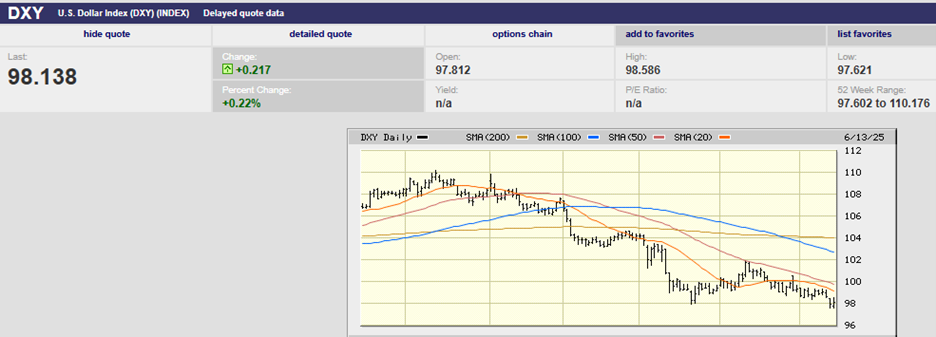
DXY 6-month chart
A currency crisis isn’t likely in America’s near future. But one is coming if the U.S. doesn't reduce its spending. Massive deficits can only go on for so long before the rest of the world stops lending to us. The debt and ongoing deficits are a great long-term danger. We’d do well to not remain complacent about our fiscal spending. A falling dollar and rising long-term rates are trying to tell us something. We need to start listening.
Regards,
Christopher R Norwood, CFA
Chief Market Strategist