Executive Summary
- The S&P 500 rose 1.5% last week to finish at 6,000.36
- The May payroll number came in above estimates
- The U.S. economy is slowing, despite the S&P 500 poking above 6,000
- The Labor Force Participation Rate fell to 62.4% from 62.6%
- Inflation may have bottomed and is set to rise
- The services price paid index is pointing towards a higher CPI
- The declining dollar is a concern
- Tariffs are a tax
- The Q2 nowcast seems to be indicating that negative economic impacts from tariffs won’t affect Q2
- International markets have far outperformed U.S. markets so far in 2025
The Stock Market
The S&P 500 climbed 1.5% last week and closed at 6,000.36. The Dow rose 1.3% while the Nasdaq rose 2.0%. Interest rates rose as bond prices fell. A stronger-than-expected jobs report on Friday is getting the blame for rising yields. The jobs report was also responsible for the S&P’s gap-up open on Friday (chart below).

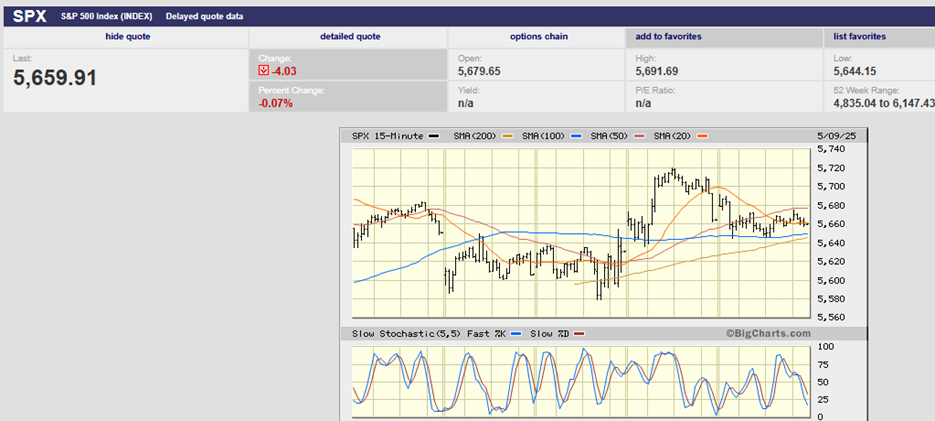
S&P 500 5-Day Chart
We wrote last week that, “The coming week could see another test of support around 5,800.” The test came early Monday morning as the index bottomed at 5,860 (chart above).
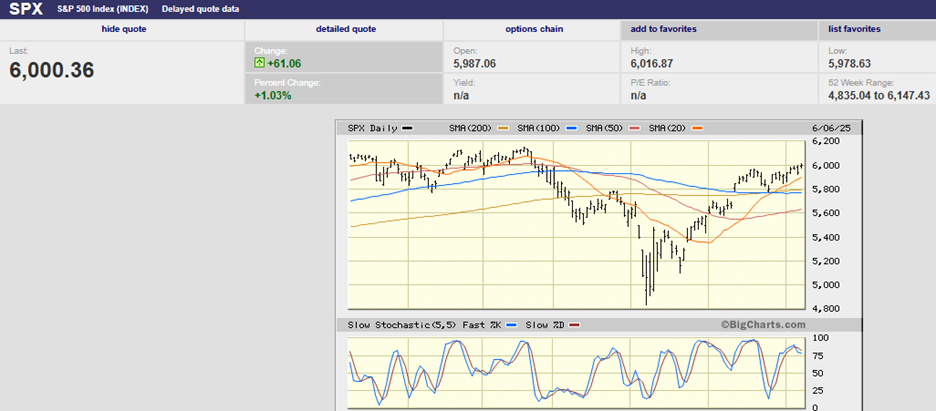
S&P 500 6-Month Chart
We also wrote last week that “…it will prove tough for the S&P 500 to push through resistance in the 6,000 area. It will take some positive fundamental news.” The S&P did run into trouble in the 6,000 area.
The S&P ran up against the 6,000 area four days in a row. Tuesday’s high was 5,981.35. Wednesday’s high was 5,990.48. Thursday’s high was 5,999.70, and Friday’s high was 6,016.87. The S&P hit that last high in the first 30 minutes of trading Friday. The index fell to 5,979 by 12:45 before trying 6,000 once again. It made it to 6,013 by 2:30 before drifting lower to close at 6,000.36. The 6,000 level should remain a battleground. The odds favor the downside unless positive trade war news materializes this weekend.
Friday’s push higher was in response to a better-than-expected jobs report. The report was released before the open. The May payroll number came in at 139,000, above the 126,000 estimate. The consensus had been 130,000 before the weaker-than-expected ADP payrolls report Thursday. The ADP report was the weakest in two years, according to MarketWatch.
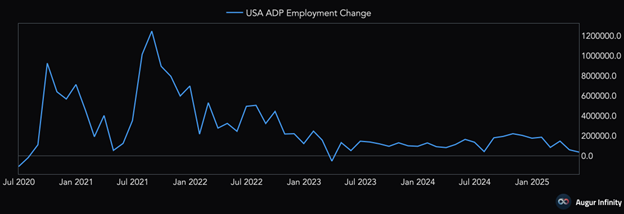
The ADP report points to a hiring freeze tied to the trade wars, wrote Jeffry Bartash. Privately run businesses created just 37,000 new jobs in May. It was the weakest increase since March 2023. Economists surveyed by the Wall Street Journal had forecasted a 110,000 gain. The new order index fell to 46.4 from 52.3 in April, while the price paid index rose to 68.7 from 65.1. The ISM services report notes that 49.9 on the overall index corresponds to a 0.4% real GDP growth rate.
"The labor market is frozen in place," said Aaron Sojourner, a labor economist and senior researcher at the W.E. Upjohn Institute for Employment Research. "Huge uncertainty makes doing nothing appealing. No hiring. No firing."
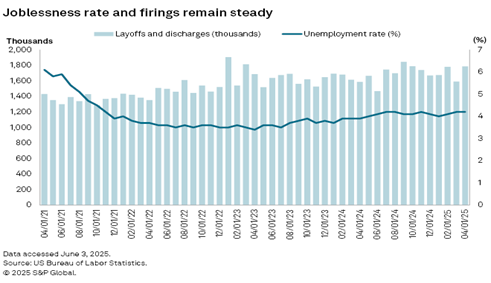
"Layoffs remain very low by historical standards — lower than you would expect given the current unemployment rate," said Guy Berger, director of economic research at the Burning Glass Institute. "Companies that had challenges hiring new employees in the wake of the pandemic are keeping workers on payroll now," said Nela Richardson, chief economist with ADP, during a June 4 call with reporters. "As long as wages are robust, layoffs are low and consumers keep spending, I think even if the economy slows for a period of time, it is resilient enough to rebound," Richardson added.
And the U.S. economy is slowing, despite the S&P 500 poking above 6,000 on Friday. David Kelly, J.P. Morgan Asset Management's chief global strategist, said as much on CNBC Friday. Kelly pointed out that the recent jobs report was “a lot softer than the headline suggested." He said that “we saw over 600,000 jobs lost according to the household survey… that’s a negative signal.” The revisions to March's and April’s jobs report was more negative news. April’s data was revised lower by 30k, and March’s by 65k. The two-month negative revision of 95,000 was far larger than the 13,000 payrolls beat.
The Labor Force Participation Rate falling to 62.4% from 62.6% was yet another jobs report negative. The lower participation rate means fewer people in the labor force. The drop in the labor force helps the unemployment rate because those not in the labor force aren’t counted as unemployed.
All in all, Kelly projects the U.S. economy is heading toward modest growth of around 1.5%. Chris Williamson, chief business economist at S&P Global Market Intelligence agrees. Williamson points to the recent PMI data as evidence of a weakening economy. “The PMI is so far indicating annualized GDP growth barely above 1% in the second quarter, so avoiding recession, but adding to our expectation of only modest GDP growth in 2025 of just 1.3%,” he wrote last week. Wednesday’s ISM services report also suggested that the economy is slowing. The ISM number was 49.9%. The forecast was for 52.1%. The prior month was 51.6%.
Higher-than-expected Average Hourly Earnings was yet more bad news on Friday (for those hoping the Fed will start cutting soon). Average hourly earnings rose by 0.4%, above last month’s 0.2% and the 0.3% consensus. Wage growth climbed by 3.9% year-over-year versus estimates of 3.8%. Labor costs are most businesses' biggest expense. Rising labor costs mean narrowing margins. Narrowing margins means slower earnings growth.
Meanwhile, inflation has likely bottomed….
There is reason to believe that inflation has bottomed and is set to rise. Lawrence Fuller pointed out last week that base effects make it likely that inflation will rise into year-end. (A base effect occurs when a comparison between two data points is distorted due to the choice of the reference point. The choice of the base value can influence the perceived percentage change.) In this case, there were several low monthly inflation readings in the second half of last year. Inflation will accelerate as those low monthly inflation numbers are replaced by higher numbers. Note May, June, and July in the chart below.
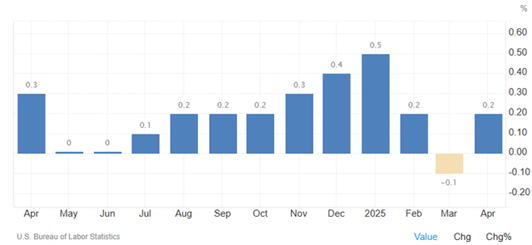
Monthly CPI
Fuller wrote in a note last Monday that, “In addition to the incoming price increases for goods, we have some very difficult year-over-year comparisons moving forward for both the CPI and PCE that will increase the annualized rates for both over the next six months.” Fuller points out that the numbers in the above chart are seasonally adjusted. The year-over-year numbers are not. The 0.3% and 0.4% for November and December are less than 0.17% non-seasonally adjusted. That makes comparisons for the second half of the year even more difficult. Any number above the comparable year-ago number will drive the annualized rate higher.
Michael Kramer of Mott Capital Management is also concerned about higher inflation. He points out that the services price paid index is a leading indicator. “Historically, the services price paid index has tended to be a leading indicator of the Consumer Price Index (CPI). It would seem to suggest that the odds of inflation continuing to decline on a year-over-year basis have run their course and will likely begin to rise,” he wrote in a note last Wednesday.
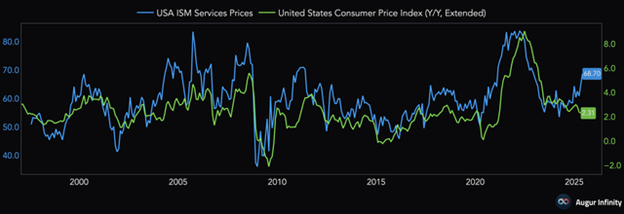
The services price paid index is pointing towards a higher CPI. (chart above)
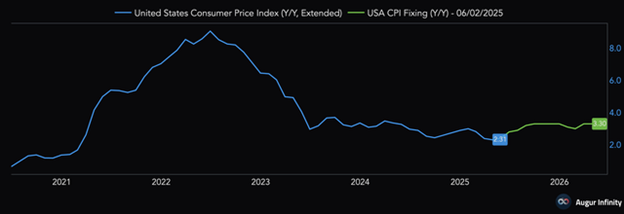
“Current CPI swap prices suggest that the inflation rate is expected to rise back to 3.3%, and the recent prices paid data indicate that inflation appears to be well on its way to those higher inflation rates,” Kramer wrote.
Overall, the data out last week points toward a slowing economy, a lukewarm jobs market, and the prospect of rising inflation at least through year-end. It seems likely that the S&P 500 will struggle to advance in the coming months. A summer pullback remains a distinct possibility.
Interesting Charts:
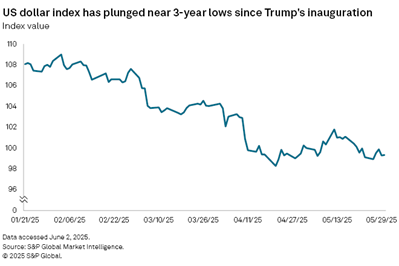
The declining dollar is a concern. The dollar should be strengthening as the trade deficit shrinks. That it isn’t is a potential problem since the U.S. is a debtor nation and needs the world's capital.
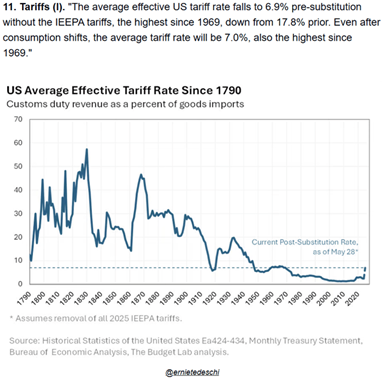
Tariffs are a tax. Someone must pay the tariffs, either the company importing the goods or the consumer buying the goods. Regardless, economic activity is diminished.
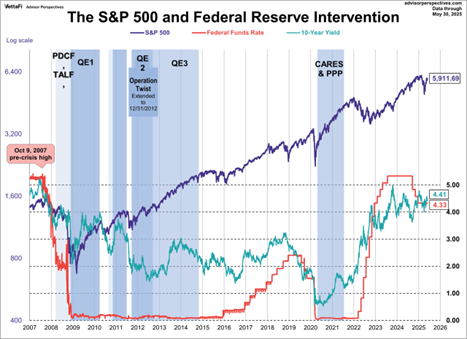
The Fed is sitting on the sidelines for now. They may not cut in 2025. The 10-year Treasury yield will likely remain in the 4.5% to 5.0% range if the Fed remains on hold.
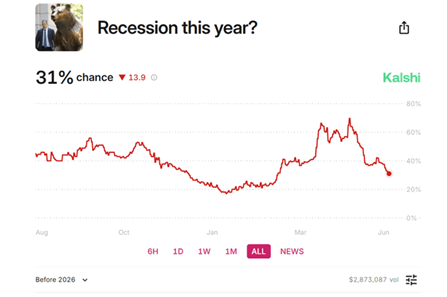
The prediction markets place the odds of a recession this year at 31%. The betting markets seem to expect tariffs to hit the U.S. economy in the second half of 2025.
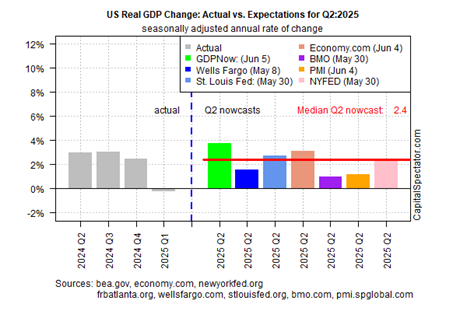
The Q2 nowcast seems to be indicating that negative economic impacts from tariffs won’t affect Q2. They will likely impact Q3.
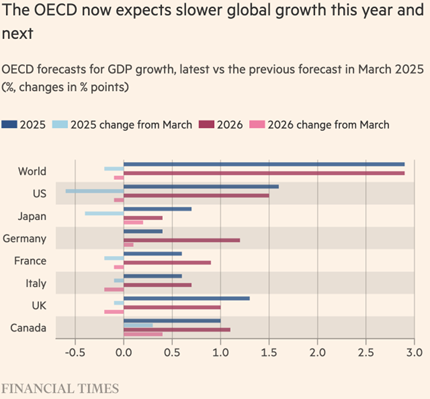
Slower economic growth is expected by the OECD.
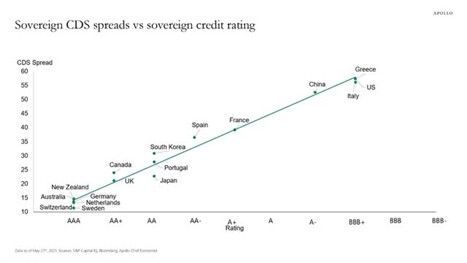
The U.S. fiscal position continues to deteriorate. When will the bond vigilantes force the federal government to stop spending money it doesn’t have?
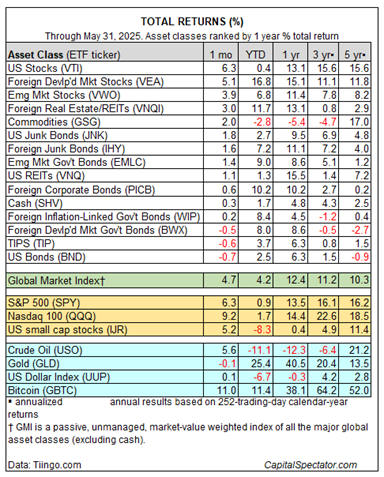
International markets have far outperformed U.S. markets so far in 2025. Asset manager Vanguard predicts that U.S. stocks will return 4.3% to 6.3% annually over the next 10 years. Vanguard expects non-U.S. developed markets will return 6.6% to 8.6%.
Regards,
Christopher R Norwood, CFA
Chief Market Strategist