Executive Summary
- The S&P 500 rose 1.5% last week to finish at 6388.64
- The impact of tariffs is expected to become more noticeable in the second half of the year
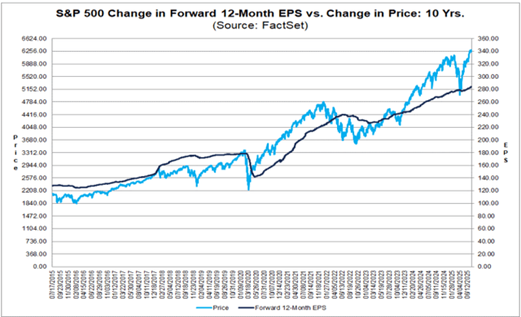
- The S&P price has outpaced profit growth
- The economy is still growing, but more slowly
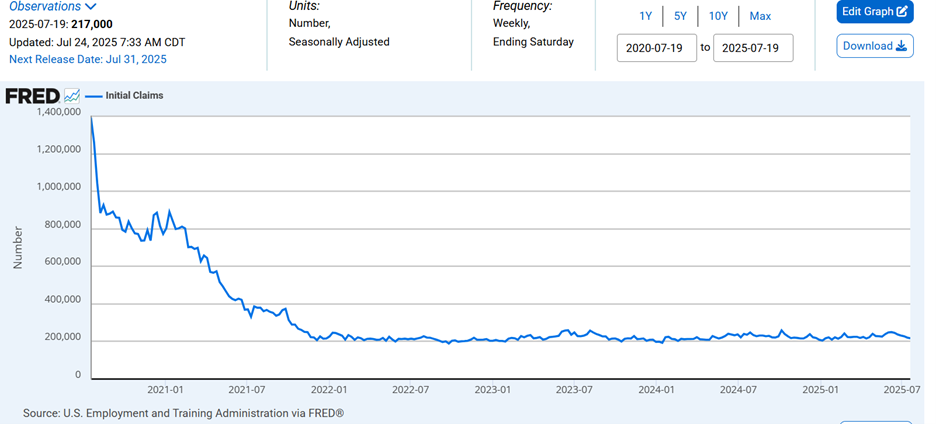
- Initial jobless claims show that the labor market remains strong
- Gasoline demand is down, suggesting the rate of consumer spending growth is slowing
- The Fed meets this week but isn’t expected to change the funds rate
- Two Fed governors may dissent on Wednesday. It has been 30 years since that happened
- The market continues to rise despite the uncertainty
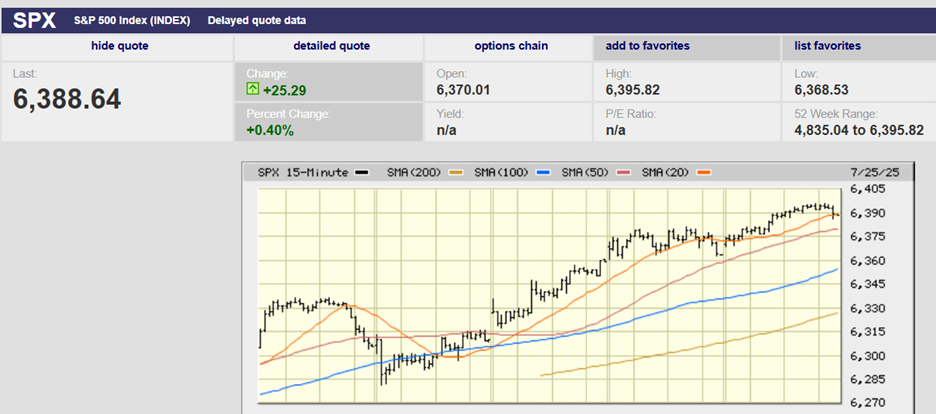
S&P 500 5-Day Chart
The S&P 500 rose 1.5% last week to finish at 6388.64. The Nasdaq gained 1%, to 21,108. The Dow rose 1.3% to close at 44,902. The S&P and Nasdaq hit new highs last week. The Dow is 113 points away from an all-time high. The S&P is up 8.62% year-to-date. The index is up 32.1% since it bottomed on 7 April.
Meanwhile, the economy is expected to slow down with GDP growth of around 1.5% in 2025. Gross Domestic Product grew 2.8% in 2024. The economy grew 2.9% in 2023. Forecasts for GDP growth in 2025 range from 1.4% to 2.4%. The Consumer Conference Board forecast is for a slowdown in US GDP growth to 1.6%. The impact of tariffs is expected to become more noticeable in the second half of the year, according to the Conference Board.
The economy and the market always cross paths eventually (see chart below). That truth is true because stock prices are a function of corporate profits. Corporate profits are a function of the rate of economic growth. It’s easy to see that the S&P price has outpaced profit growth (chart below).
The economy is still growing, but more slowly. Consumers are consuming. Workers are earning a higher real income. Median average hourly earnings have grown two percentage points faster than inflation over the last two years. Workers' wages trailed inflation by one point during the two years before that, according to Barron’s. “Wage growth has really kicked up,” says Jeff Chang, president of Vest Financial.
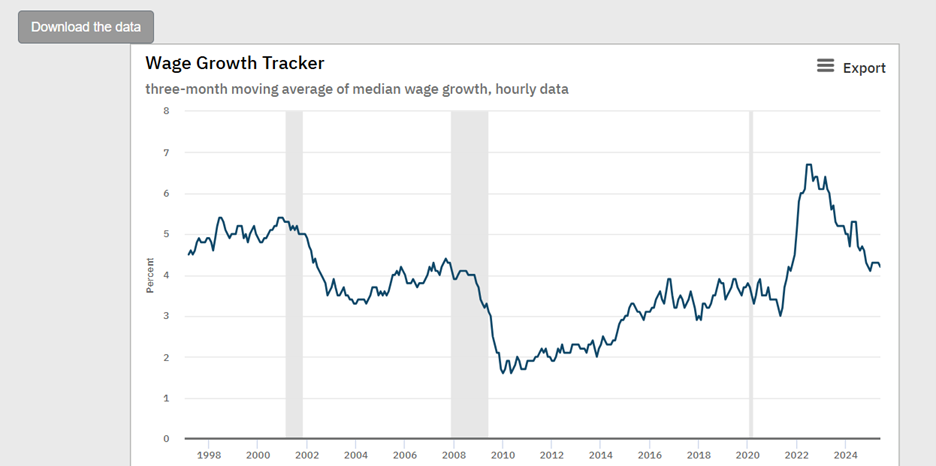
Real wage growth compares favorably to that of the last 28 years. (chart above)
Initial jobless claims are a leading indicator. They show that the labor market remains strong.
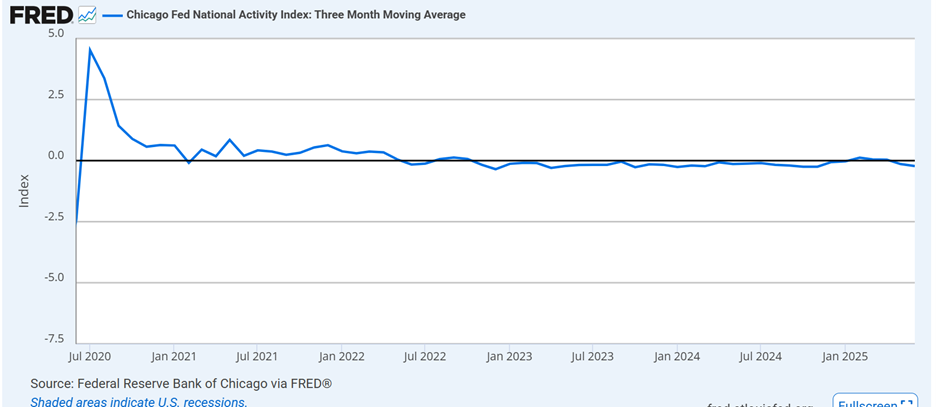
The Chicago Fed National Activity Index 3-mth moving average has fallen below zero, indicating some weakness, though. (chart below).
And gasoline demand is down (chart below)
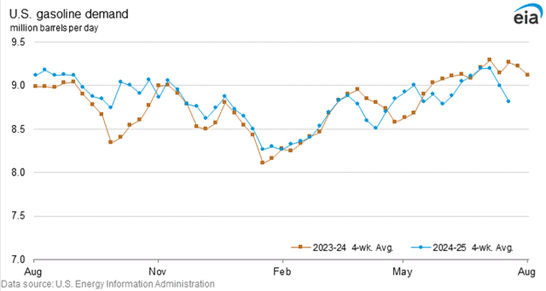
Lawrence Fuller is a professional money manager in North Carolina. He explained the importance of gasoline demand in a blog last week:
I follow retail gasoline demand as one of my real-time pulses on economic activity, because consumers typically drive to go to work, as well as do just about everything that involves discretionary spending. It is like the blood pumping through the veins of our enormous economy. We drive to restaurants, bars, the grocery store, and the mall. We also drive to vacation or go to the airport. I am concerned that the four-week consumption average has fallen below last year’s level for three consecutive weeks. Last week, that average was 4.8% below year-ago levels, despite gas prices being 10% cheaper than they were last year. Typically, lower gasoline prices encourage more demand, but not this year. This suggests that the rate of consumer spending growth continues to slow in the third quarter.
Still, the economy is expected to continue to grow, albeit at a slower rate. Tariffs remain a wild card.
Bond yields were stable last week. The two-year Treasury yield finished the week at 3.94%, up from 3.88% the week prior. The 10-year Treasury yield was 4.39% at the close on Friday. It finished at 4.44% the prior week.
The Fed meets this week but isn’t expected to change the funds rate. Guidance will determine how the market reacts. The futures market is pricing in a quarter-point cut in September and another quarter-point cut in December. Bond investors may price out those cuts if inflation continues to rise, though. The Fed itself seems unsure of what to do. A Barron’s headline tells the tale. “The Fed Hasn’t Seen a Split Like This in 30 Years,” it read. “It has been more than three decades since two Federal Reserve Board governors dissented on an interest-rate decision at the same Fed policy meeting,” read the first line of the article. Two Fed Governors may dissent on Wednesday, voting to cut by one-quarter point. The rest of the FOMC isn’t likely to follow along.
The problem is that inflation is still well above the Fed’s 2% target. Yet at least two Fed governors believe that monetary policy is too tight. They believe the economy could fall into recession. Tariffs complicate the matter since they may negatively impact inflation.
Money supply used to be a main focus of the Fed. The money supply, specifically M2, has grown at around a 6% rate over the long run. That matches the nominal growth rate of the economy. A surge in the M2 measure in 2020 and 2021 led to the worst inflation since the 1980s, wrote Jim Reid of Deutsche Bank last week. “Fast forward to 2025 and U.S. M2 is growing again—at +4.5% [year-over-year], the highest rate since July 2022,” Reid writes. “The three-month annualized rate is even stronger at +6.9%, the highest since February 2022. So, there’s a clear hint that we (inflation) may be turning up again, especially when looking at short-term momentum in the three- and six-month annualized numbers,” Reid concluded.
Inflation is certainly turning up in the stock market. Steven Blitz, Chief U.S. Economist at GlobalData.TSLombard, pointed to the disconnect between stock prices and the economy last week. He warned in a research note that a significant gap exists between market valuation and corporate profits. The divergence has been as large two other times. The first was in the mid-1960s. The second was during the dot-com boom. Ten-year annualized real returns on equities were -4% and -6%, respectively, according to Blitz.
Yet, for now at least, the market continues to rise. It continues to ignore uncertainty, tariffs, Fed dissension, and a slowing economy. Pundits are scratching their heads as they attempt to explain the short-term divergence between the economy and the stock market.
A Wall Street Journal article from April of 1998 provides us with some clues about why the stock market does what it does in the short term. The title is “The First Totally Honest Stock Market Story”. Below is the first paragraph of the article.
“The market rallied early this morning for reasons nobody understands and nobody predicted. CNBC analysts confidently asserted it had something to do with the Senegalese money supply, but others pointed to revised monthly figures showing a poor tuna haul off the Peruvian coast.”
A few other snippets from the article:
The Dow turned down in late morning due to profit-taking, which is a meaningless phrase we financial journalists use when we don’t know what we’re talking about.
Around noontime, the tech stocks rallied (perhaps because of profit giving?) before a late wave of selling sent stocks lower. (The wave of selling was miraculously met by a wave of buying since in each transaction there is one buyer and one seller)
The article continues, but you should get the idea by now. Short-term stock market movements are unpredictable. The daily ups and downs are mostly noise, algorithms searching for arbitrage opportunities. The day-to-day trading rarely tells us anything about the longer term. Or in institutional speak, day to day trading has low information content.
Nevertheless, Norwood Economics is going to fearlessly point out one possible reason for the disconnect between the economy and the stock market in 2025.
Liquidity.
The debt ceiling limit prevented the Treasury from borrowing. Instead, it spent some $500 billion from the Treasury General Account (TGA) in the first half of 2025. The $500 billion was an injection of liquidity into the financial system. It had to go somewhere, and it appears as if some of it went into stocks. But the debt ceiling was raised recently with the passage of the “One Big Beautiful Bill Act”.
“In the very near term, the broad inflow of liquidity will be far less than in the first half of the year," Blitz wrote in his note last week. “The powerful tailwind of liquidity will become a headwind as the Treasury restores $600B in T-bills." The quarterly refunding announcement this week should pave the way for the (TGA) to start rising. The government's checking account will likely return to around $850 billion by the end of September. Liquidity will drain out of the financial markets as a result.
So liquidity has been abundant in the first half of the year. It will be less abundant in the second half of the year. There are a lot of leveraged players in the market who may find themselves out over their skis. It’s possible they will need to reduce their equity exposure as liquidity lessens. It has nothing to due with fundamentals mind you. Just as the rising stock market likely had nothing to do with fundamentals in the first half of the year. Yet it’s a plausible reason to expect the stock market to struggle in the coming months.
Forewarned is forearmed!
Regards,
Christopher R Norwood, CFA
Chief Market Strategist