Executive Summary
- The S&P 500 fell 1.5% last week to finish at 5,282.70
- Counter-trend bounce started on April 7th
- Counter-trend rallies are short and sharp
- Thursday was an inside day
- Any trade war announcements will lead to more volatility
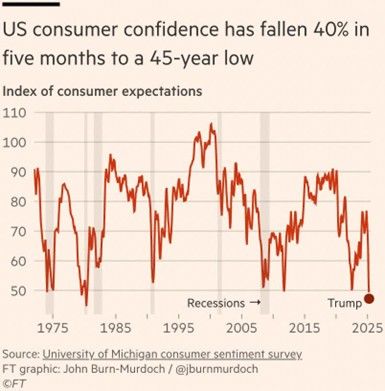
- Uncertainty is high, and consumer confidence is low
- The Federal Reserve is focusing on inflation
- The Philly Fed and Empire State indices continue to rise
- Small business owners are raising prices to offset input costs
- The Stock Market is still in a downtrend
The Stock Market
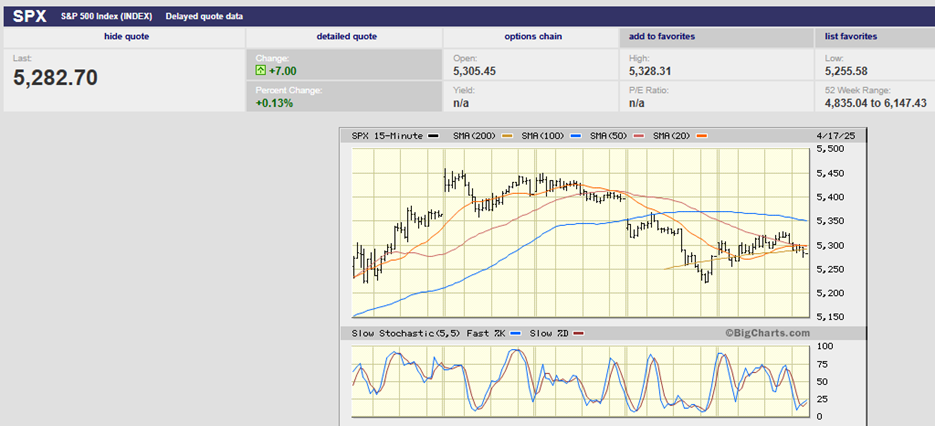
S&P 500 5-Day Chart
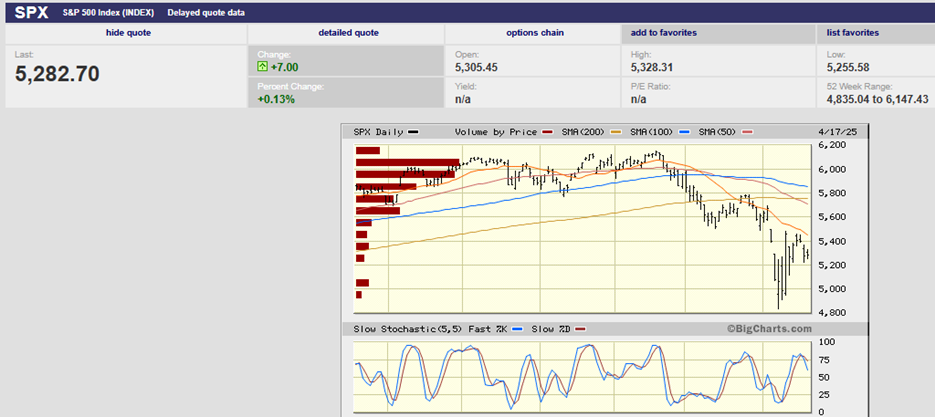
The S&P 500 fell 1.5% last week to finish at 5,282.70. The Nasdaq was down 2.6% and the Dow was down 2.7%. The 2-Year Treasury bond yield ended the week at 3.81%. The 10-year Treasury yield fell to 4.33% from 4.49%. The 3M Treasury yield also finished the week at 4.33%. An inverted yield curve is a reliable indicator of recession. The 3M/10Yr Treasury curve has been inverted for much of the time since October 2022.
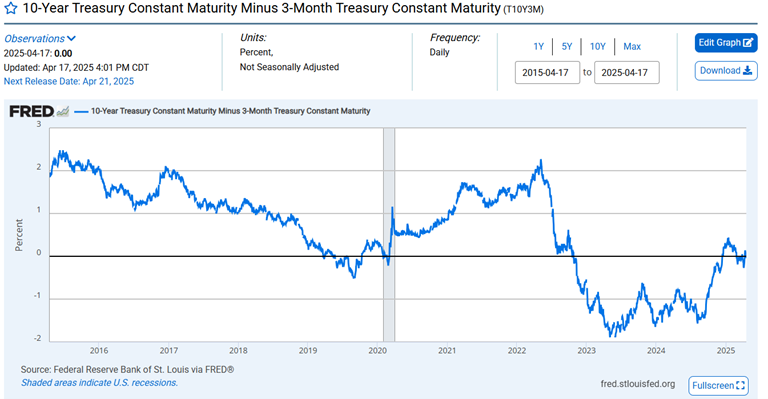
3Mth/10Yr Yield Curve
The problem with the indicator is that the lag before the recession hits can vary greatly. And that means it isn’t as useful as it otherwise would be for portfolio management.
The S&P 500 began a countertrend bounce on 7 April after hitting a low of 4,835.04.
S&P 500 6-month chart
Counter-trend rallies are short and sharp. This one ran into resistance near the 20-day moving average on Monday (see chart above). Tuesday’s trading failed to take out Monday’s high. It was enough for traders to start selling aggressively on Wednesday.
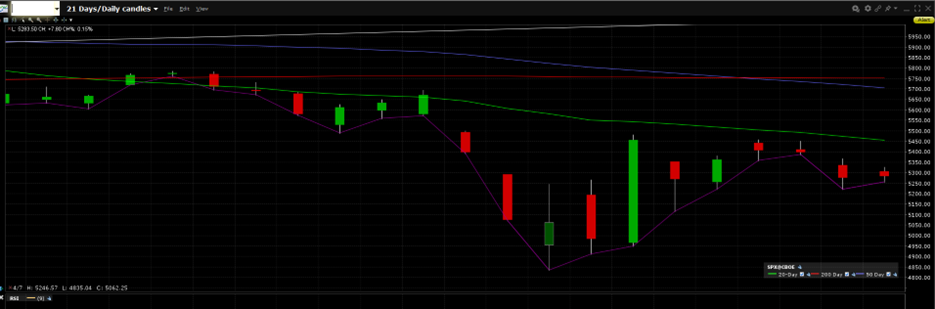
S&P 500 last 22 trading days
Wednesday saw a lower low after Tuesday’s trading failed to make a higher high (see chart above).
Thursday was an inside day. (chart above). An inside day occurs when the market doesn’t trade above or below the prior day’s range. It indicates consolidation. Traders will often wait to see which way the market goes, either a breakout or breakdown. They’ll place their bets once one or the other has occurred. A move above Wednesday's high of 5,367.24 will likely lead to another attempt to take out the 20-day moving average (5,450). A drop below 5,220.79 will likely lead to a breakdown that could see the market fall to the 7 April low of 4,835.04.
The stock market was closed on Friday.
Of course, big fundamental news would supersede any technical trading. From a technical perspective, we’ll need to see which way the market goes in the next few trading days. The odds favor an eventual re-establishment of the downtrend. The Federal Reserve is on hold, and earnings estimates are falling. Any trade war announcements will lead to more volatility.
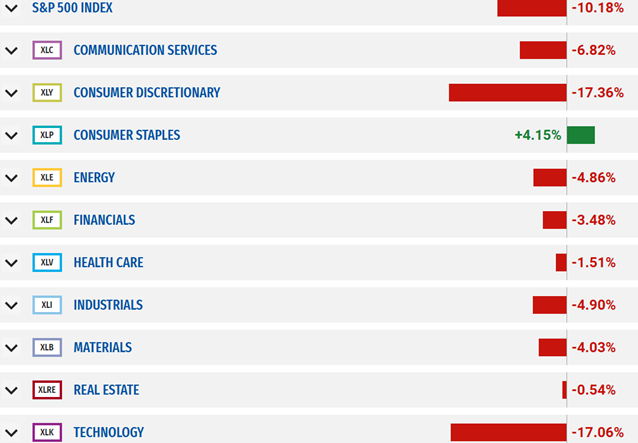
There are winning and losing sectors within the S&P 500. The index is down 10.18% on the year. Consumer Staples and Utilities (not shown) are the only two positive sectors in 2025. Utilities are up 2.75% on the year. Consumer Staples are up 4.15%. Technology and consumer discretionary are the big losers. Technology is down 17.06% while consumer discretionary is down 17.36%.
Uncertainty is high, and consumer confidence is low.
Federal Reserve Chairman Jerome Powell spoke last week. He said nothing to soothe stock investors. Instead, he said on Wednesday that stocks are “doing what they’re supposed to do." Powell made it clear during his speech that the Fed is focusing on inflation. It is willing to let the stock market struggle, and the economy slow if necessary. Tariffs are expected to lead to both price hikes and slower growth. It is a toxic mix.
Still, investors are expecting three to four rate cuts in 2025. The Fed funds rate is currently 4.25% to 4.50%. Three rate cuts would lower it to 3.5% to 3.75%.
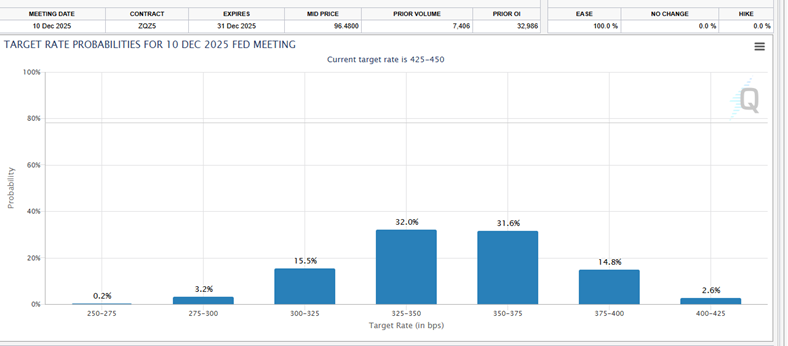
CME Fed Watch Tool predicts 3-4 rate cuts
Investor expectations will not be met. That is if the inflation rate shows signs of leveling off or rising. Some signs are already pointing to higher for longer inflation.
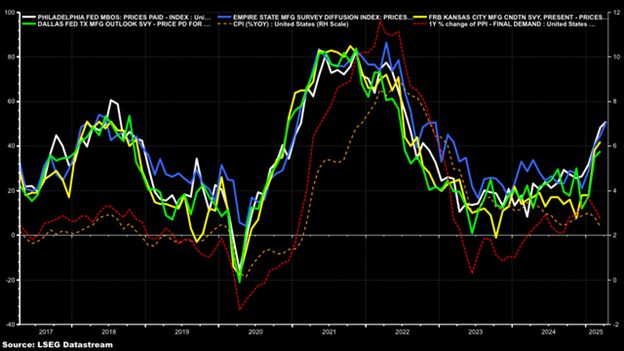
The Philly Fed and Empire State prices paid indices
The Philly Fed and Empire State prices paid indices continue to rise. They have reached levels not seen since the summer of 2022. It would be surprising if the pricing pressures did not show up eventually. The CPI and PPI are lagging indicators.
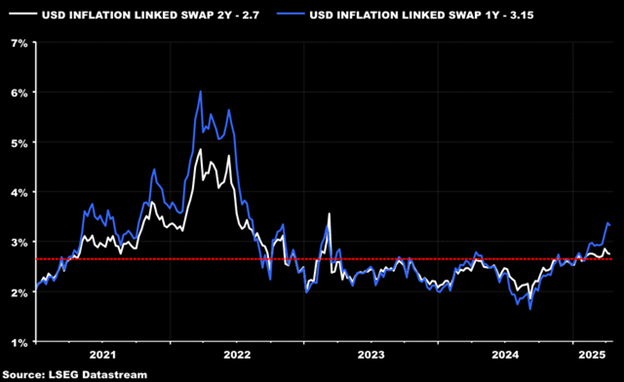
US Dollar inflation linked swaps
Michael Kramer of Mott Capital Management had this to say last week about the swaps market:
“Inflation swaps are also pricing higher inflation rates, at least over the next one to two years. A 1-year inflation swap is trading at 3.15%, and a 2-year swap is trading at 2.7%. Both are up considerably since bottoming in early September 2024. If the predictive values of these market-based inflation expectations and price paid indexes are correct, the CPI and PPI are at a low point and are likely to rise significantly.”
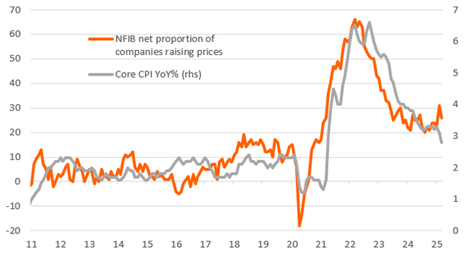
Then there is the NFIB prices survey. The NFIB is the National Federation of Independent (small) businesses. Small business owners are getting nervous about input costs. They are raising prices to offset them.
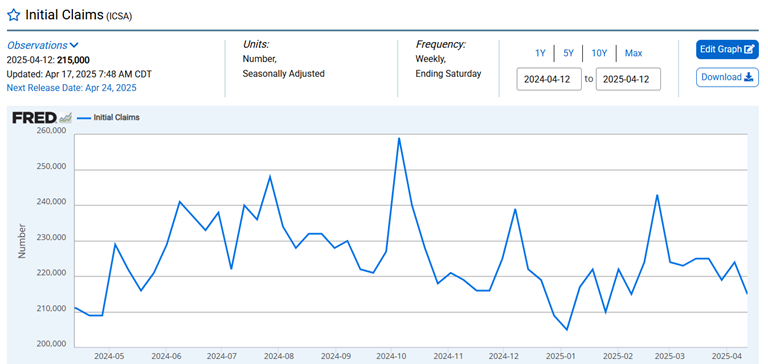
Meanwhile, there’s no sign of significant weakening in the jobs market. Weekly jobless claims are a good leading indicator of the jobs market. The one-year chart shows no weakening.
The stock market is in a downtrend. Earnings estimates are falling. The Fed is still on hold. Uncertainty is sky high. Caution is the watchword of the day. A retest of the 4,805.34 low sometime in the next few weeks wouldn’t be surprising at all.
(Nothing in the newsletter should be considered investment advice.)
Regards,
Christopher R Norwood, CFA
Chief Market Strategist