Executive Summary
- The S&P 500 had its best weekly gain since 2023 due to the suspension of most tariffs
- The Trade War and tariffs have dominated stock market action
- Daily announcements on the tariff front have led to high volatility
- The market is still in a downtrend
- Tariffs will negatively affect the U.S. economy
- Rising prices will reduce consumer demand
- U.S. earnings estimates are coming down; currently $267 and falling
- Pay attention to what bond investors are thinking
- The weakening dollar fell to its lowest level since 2022
- The U.S. needs foreign capital

The Stock Market
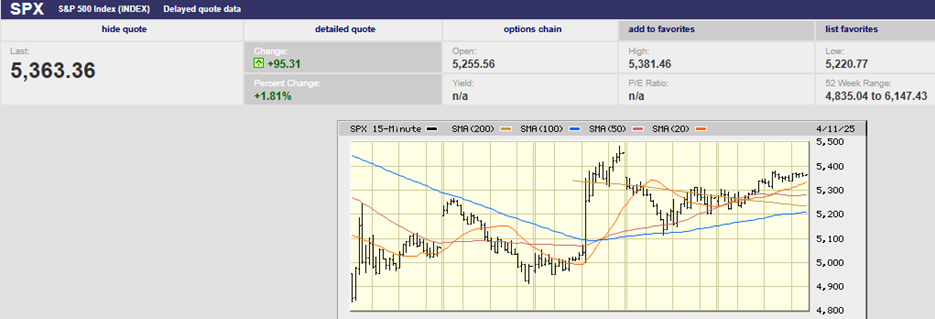
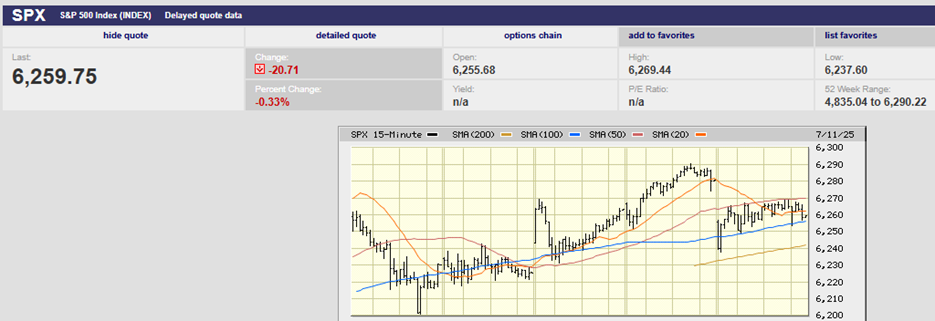
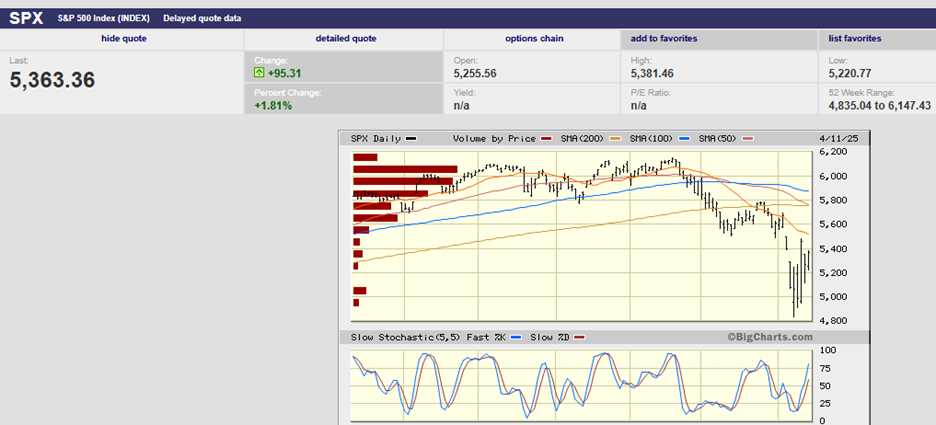
S&P 500 5-Day Chart
The S&P 500 had its best weekly gain since 2023, according to Barron’s. The index rose 5.7%. It is down 12.8% since its all-time high on February 19th. The S&P bottomed at 4,835.04 on 7 April, down 21.3% from the February high. Trump’s suspension of most tariffs on Wednesday led to a furious rally, which saw the S&P gain 9.5% that day. It was the index's largest daily gain since 2008.
The Trade War and tariffs have dominated stock market action since Trump’s Rose Garden speech on 2 April. The S&P is down 4.8% since the speech. Trump on Wednesday announced that more than 75 countries had reached out for trade negotiations. He said there would be a 90-day pause in reciprocal tariffs for those countries. China was not one of the countries. It was hit with an even higher tariff rate of 145%, following China's retaliation earlier in the day. Also, the baseline 10% tariff that took effect on 5 April is still in place for all countries.
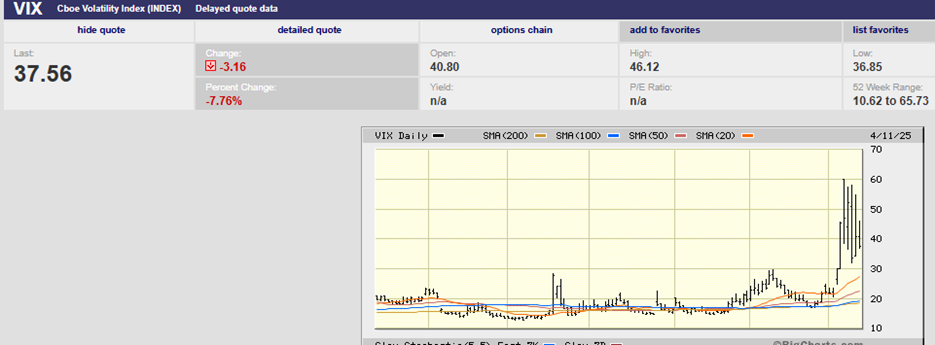
Volatility Index (VIX) 6-Month Chart
Trump’s almost daily announcements on the tariff front have led to high volatility. The Volatility Index (VIX) hit a high of 60.13 on Monday. Investors are willing to pay a high price for protection, signaling fear. The VIX hit highs of 57.52 on Tuesday, 57.96 on Wednesday, and 54.87 on Thursday. The high Friday was a “mere” 46.12. Normal for the fear gauge is under 20. The stock market usually finds at least a short-term bottom when the VIX climbs above 35 or so. The short-term bottom can last anywhere from a few weeks to a few months.
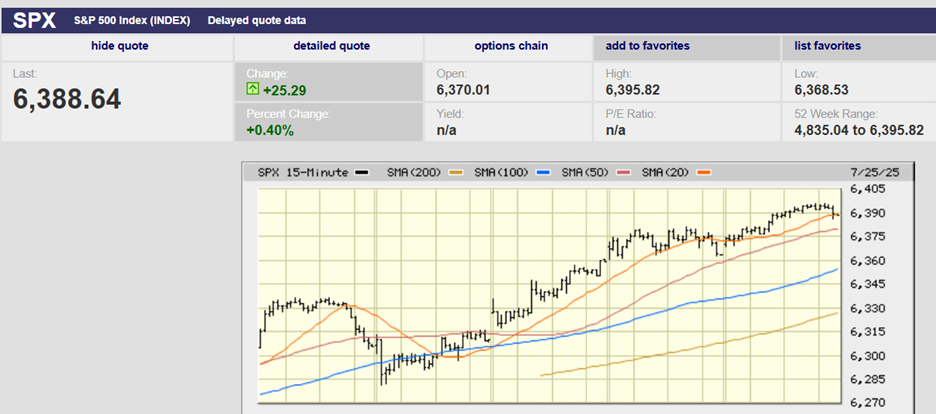
S&P 500 6-month chart
It does look as if a short-term bottom is already in place. The SPX had higher lows every day last week (chart above). It’s up 10.9% from the Monday low.
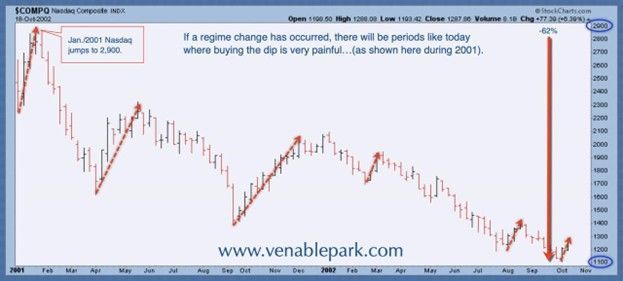
The 2000-2002 Bear Market Nasdaq. Bear market rallies are normal.
It’s unlikely that the downtrend is over, though. The type of bounce we saw last week has all the hallmarks of a bear market rally. The fundamental issues facing the stock market are still there. Uncertain trade policy will impact S&P earnings despite the 90-day hold on most tariffs. The 145% tariffs still in place on China will negatively affect the U.S. economy all on its own. China is our third biggest trading partner. Last year it exported around $400 billion of goods to the U.S.
The 145% tariff will all but shut down imports from China. The 125% Chinese retaliatory tariffs will make U.S. exports to China uncompetitive. Around 41% of the total revenue generated by S&P 500 companies comes from sources outside the United States. Some of those overseas sales are to China. U.S. businesses, including farmers, will see revenue from China fall. Prices will rise in the U.S. because of the 145% tariff on imports from China. Rising prices will reduce consumer demand as well.
U.S. earnings estimates are coming down. The consensus earnings growth estimate for 2025 is 10.2%. The consensus for 2026 is a lofty 14.3%. Both estimates are too high. Wall Street analysts are already cutting their 2025 sales and earnings forecasts. Estimates for 2025 S&P 500 earnings were $273 in early November, according to FactSet. They’re at $267 now and falling. 22V Research’s Dennis DeBusschere says that the money managers he’s spoken with expect an average of $258 for 2025. That number is only 6.3% higher than 2024's $242.7.
Many economists expect the trade war to slow U.S. economic growth by over 1 percent, according to Barron's. BofA Securities wrote last week that tariffs could cause S&P earnings to fall 5% to 35%. UBS's chief strategist sees earnings rising by low single digits if the temporary 10% global tariff rate holds and the Chinese rate is negotiated down to 50%.
The ICE BofA US High Yield Index is signaling trouble with the economy. The index measures the yield spread of non-investment grade bonds to Treasuries. A widening spread signals deteriorating conditions in the corporate financial world. It is a reliable leading indicator of economic stress. Bond investors are better than stock investors at detecting trouble. It’s wise to pay attention to what bond investors are thinking.
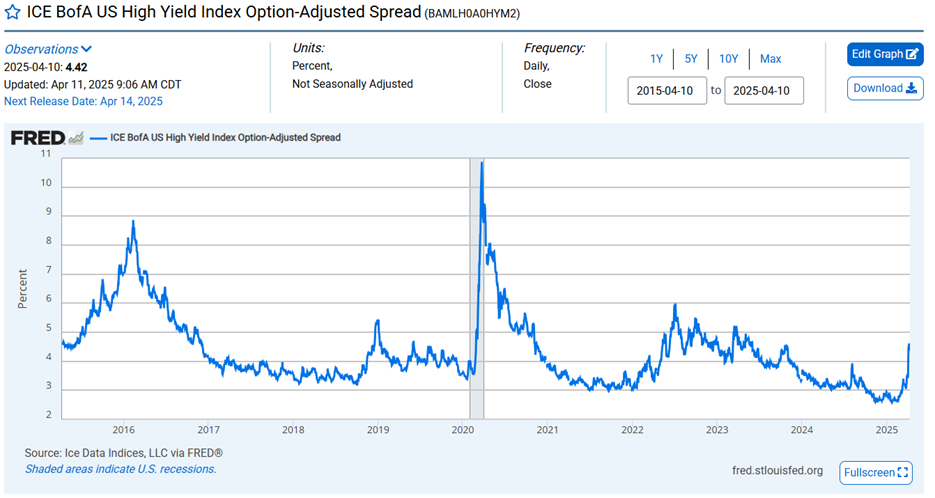
Spreads widen when investors begin to worry about the economy and recession. Falling cash flows mean more risk of default. The ICE BofA Index (chart above) is widening as bond investors price in the greater risk of corporate default.
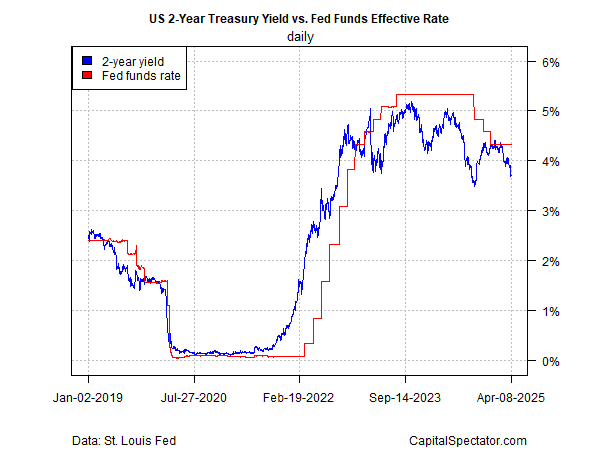
Bond investors are also pricing in more Fed funds rate cuts. The U.S. two-year Treasury yield has been falling (chart below). It is the maturity most closely tied to the Federal Funds Rate.
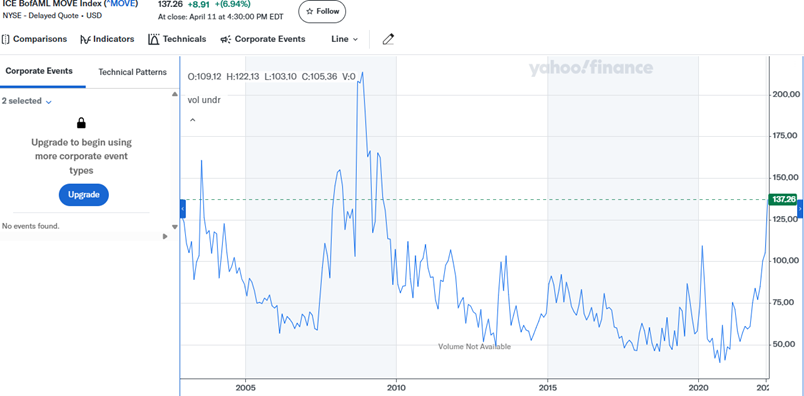
The $28 trillion Treasury bond market offers a referendum on global confidence in the U.S. It's been flashing a warning. The ICE BofAML MOVE index (chart below) is the VIX of bonds. It helps investors track volatility across U.S. Treasuries. Volatility has been rising in the Treasury Market.
The 10-Year Treasury yield rose almost one-half percentage point last week to 4.49%. Friday saw the 10-year yield hit a two-month high of 4.58%. The trading was chaotic last week, according to former Treasury Secretary Larry Summers. He likened it to what you might see in an emerging market, according to Barron's. The 30-year Treasury came close to 5% on Friday before pulling back to a 4.9% yield. Bond yields should be falling, not rising. Slowing inflation, falling consumer confidence, and slowing economic growth usually mean lower rates. That rates are rising is worrisome.
"U.S. Treasury Secretary Bessent said that they saw nothing unusual in yesterday’s (Thursday’s) market moves. The 30-year Treasury yield experienced its biggest increase since 1982; while equities are falling, the dollar is weakening, and gold has hit an all-time high. Economists might consider this pattern not entirely usual," UBS’s Donovan wrote on Friday. Barclays said Friday that this week's swings in the bond market are the “most worrisome part of price action”. "Bond markets are in trouble,” Barclays added.
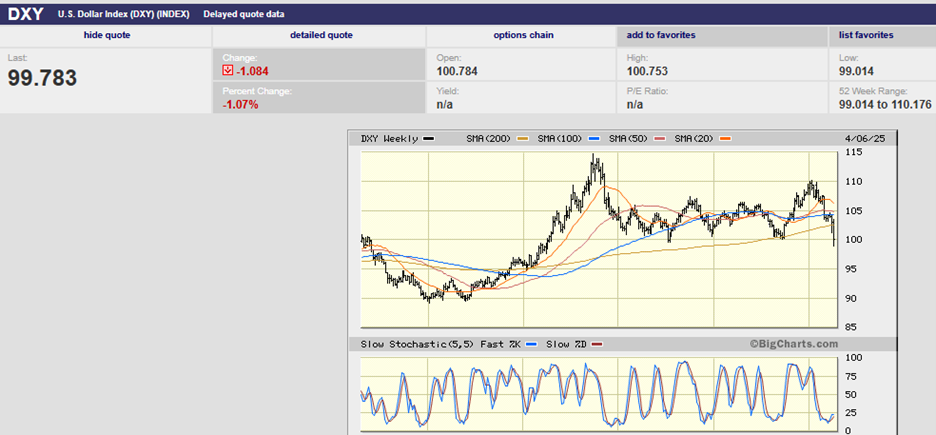
US Dollar Index 5 year chart
Meanwhile the dollar has been weakening. The dollar fell to its lowest level since 2022 last week. Gold surged 7% in the past week to over $3,200 an ounce, bringing its year-to-date gain to 23%. The dollar fell, losing 3% against the euro, which ended at $1.12. The dollar’s weakness could make it tougher for the Federal Reserve to cut rates. The U.S. is a debtor nation. It's running a budget deficit of over 6%, or around 2 trillion. It needs capital to flow in from the rest of the world. A falling dollar makes investing in the U.S. less appealing. So do lower interest rates.
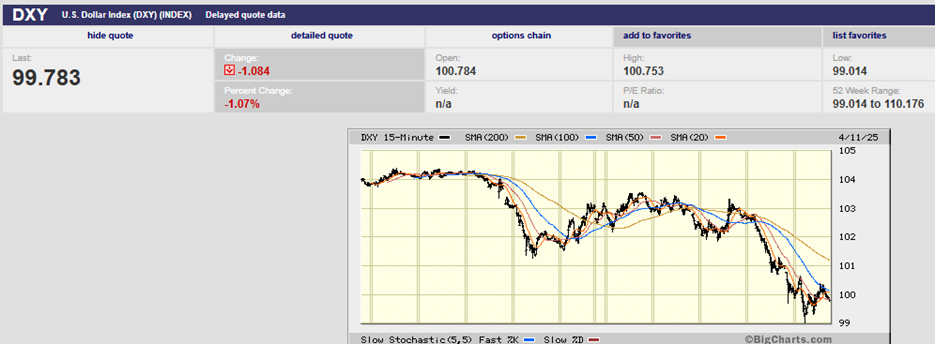
US Dollar Index 5-day chart
The dollar tried to pair its loss ahead of the North American open on Friday after its big drop on Thursday. The U.S. Dollar Index (DXY) did rebound from 99.014 early, but half of the G10 currencies still gained more than 1% against the greenback on Friday. The Swiss franc has led this week's moves with a 5% gain. The New Zealand dollar is in second place with a 3.7% gain. The euro was right behind the New Zealand dollar, also with a 3.7% gain. Gold climbed to a record high near $3230, a roughly 6.3% gain this week. “First, the US equity market cracked. Then, it was the bond market. Now it is the dollar,” wrote currency analyst Marc Chandler on Friday.
More from Chandler:
“It began in earnest Thursday, with a nearly 2% drop in the Dollar Index and a new low for the year (100.70). Follow through selling Friday has knocked it back another 1.6% today to around 99.20, its lowest level in three years. The euro rallied strongly in North America to take out not only this year's high set last week near $1.1145 but the 2024 high near $1.1215 as well. It reached $1.1240 yesterday and surged to nearly $1.1475 today, a three-year high, before pulling back to around $1.1360.”
Why do weaknesses in the U.S. bond market and the U.S. dollar matter? Because of an inconvenient truth. The U.S. needs foreign capital. It can’t afford to alienate the rest of the world. Our budget deficit is expected to hit $2 trillion in the current fiscal year. The U.S. budget deficit has already reached $1.3 trillion. It is the second largest six-month deficit on record. The Congressional Budget Office (CBO) estimates a $1.9 trillion deficit for the full year. The trade deficit for 2025 is estimated at over $1 trillion. Together, that means around $3 trillion in funds needed, or over 10% of GDP.
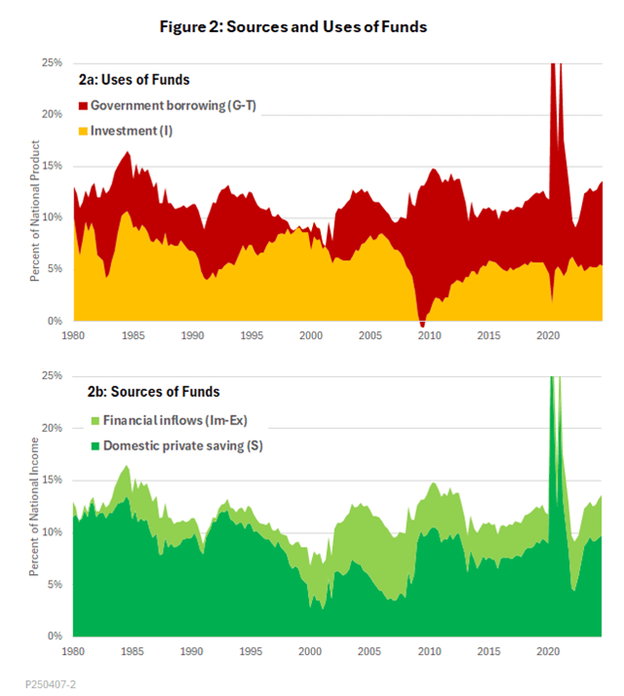
Private savings is insufficient to cover needed U.S. investments and government borrowing (chart above). The U.S. needs financial inflows from abroad. Financial inflows (chart above) come from other countries needing to invest the dollars the U.S. exports overseas (due to the trade deficit). We exchange promissory notes (paper dollars) for valuable goods and services. It is a good deal for America. In turn, other countries invest those promissory notes back into the U.S. America gets much-needed capital to invest at low interest rates because of the dollar's status as the world’s reserve currency. Also a good deal for the U.S.
America can’t afford to go it alone. We built the current system to benefit America. It has done exactly that since World War II. Volatility in our Treasury market and a falling dollar are warning signs that the Pax Americana we created some 80 years ago is at risk. It would be a bad deal for America if we walked away from a system that has and continues to benefit us “bigly”.
Nerd Note:
Some basic math. The fourth equation is the bottom line.
Eq. 1: National Product = Consumption + Investment + Government purchases + (Exports – Imports), or, Y = C + I + G + (Ex-Im)
Eq. 2: National Income = Consumption + Saving + Net taxes, or Y = C + S + T
Eq. 3: I + G + Ex = S + T + Im (combining the first two equations and simplifying)
Eq. 4: S + (Im-Ex) = I + (G-T) Saving plus capital inflows = Investment + Government borrowing.
Equation 4 is an identity, which means a mathematical truth. The trade deficit is neither good nor bad. A trade surplus (capital outflow) means other countries would rather buy our goods and services. A trade deficit (capital inflow) means other countries would rather invest in America. The world wants to invest in America, at least for now. It's a good thing.
Over time, the United States has been sometimes on one end of this dynamic and sometimes the other. Neither condition has prevented the United States economy from prospering. Our economy is the envy of the world. Let's hope 200 years of prosperity aren't derailed by bad economics applied by politicians.
Regards,
Christopher R Norwood, CFA
Chief Market Strategist