Executive Summary
- The S&P 500 fell 9.1% and ended the week at 5,074.08
- Bond yields are declining as investors flee stocks
- CME FedWatch tool now forecasts 3 to 4 Fed funds cuts in 2025
- Inflation is higher than the Fed’s target and trending in the wrong direction
- The Volatility Index (VIX) spiked on Friday. Investors are showing fear
- The Stock Market is due a bear market bounce
- The longer-term downtrend likely won't end until Trump’s Trade War ends
- Market strategists are raising the odds of a recession and reducing price targets
- The Fed has a dilemma. It doesn't have the tools to deal with rising inflation and slowing economic growth simultaneously
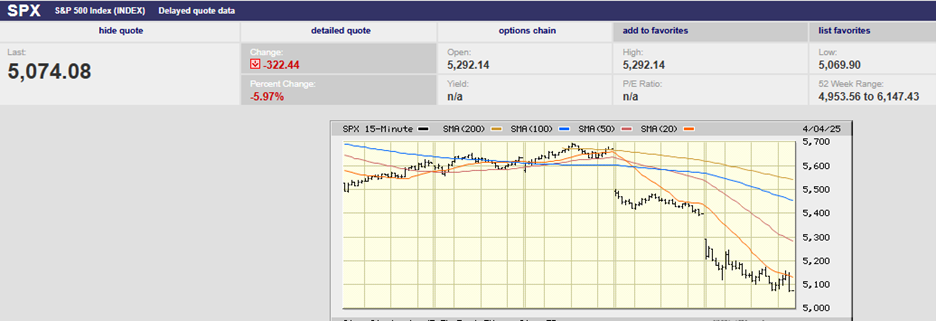
S&P 500 5-Day Chart
The S&P 500 fell 9.1% last week to finish at 5,074.08. It was the index’s worst weekly decline since a loss of 14.98% the week ending March 20, 2020. The S&P is down 17.5% from its February 19th high. The Dow fell 7.9% last week. It fell 9.3% during the last two trading days of the week and is down 15% from its high on 4 December. The Nasdaq lost 10%.
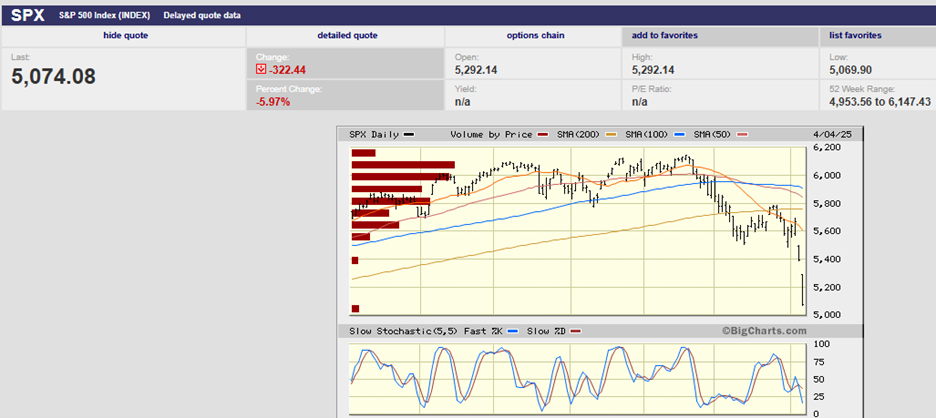
S&P 500 6-Month Chart
The stock market decline has been rapid compared to past selloffs. (see chart below)
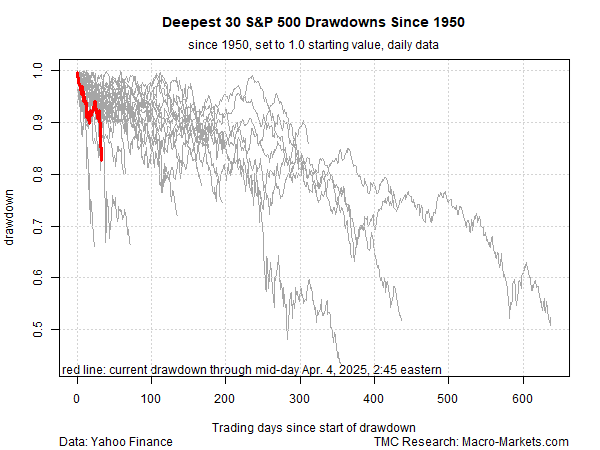
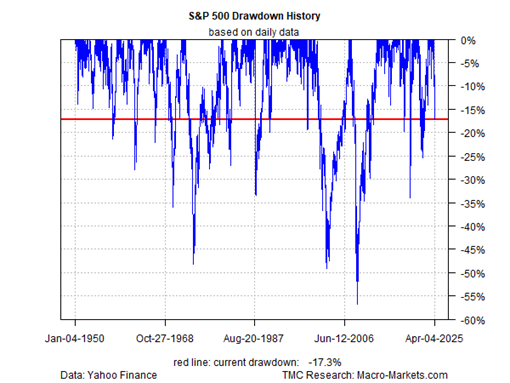
But the drawdown hasn’t been particularly deep yet. (see chart below). The median slide peak-to-trough over the last 75 years for the 30 deepest selloffs is 16.1%. The current drop is 17.5%.
Bond yields are declining as investors flee stocks. The 10-year yield fell to 4.00% by Friday from 4.25% the prior week. The 2-year yield finished the week at 3.68%, down from 3.94%. The 3-month yield closed the week at 4.3%, unchanged. The yield curve remained inverted. Bond investors are signaling more concern about slowing growth than about inflation. They are expecting the Fed to cut rates.
The forecast now is for the Fed to cut the funds rate 3 to 4 times in 2025 according to the CME FedWatch tool.
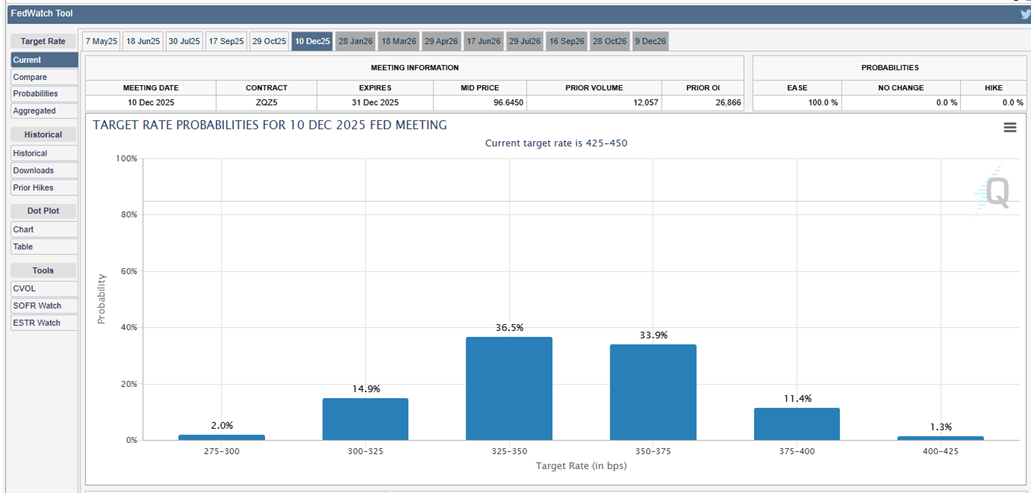
The Fed was expected to cut 1 to 2 times before President Trump unveiled his tariff plans. The first cut is forecast for June. The problem with cutting the funds rate to 3.25% - 3.50% is that inflation is higher than the Fed’s target. It is also trending in the wrong direction.
Rising inflation may prevent the Fed from moving as aggressively as the bond market expects. Wells Fargo economists have calculated the inflationary impact of the tariffs as announced. Their macroeconomic model shows an approximately 20% jump in the effective tariff rate. They expect the headline PCE inflation number to be 1.8% higher than their baseline forecast. That would put inflation back at around 5%.
The S&P is likely to bounce early this week. The Volatility Index (VIX), also known as the fear gauge, spiked on Friday. It peaked at 45.61 and closed at 45.31. The VIX is a real-time market index. It is a 30-day forward-looking estimate of volatility. It represents how much investors are willing to pay for protection. A spiking VIX indicates panicking investors willing to pay high prices to hedge their portfolios. The Fear Gauge isn't the only measure of investor unease. The ratio of put options to calls—or bearish bets to bullish ones—hit its highest level in a year, according to Barron’s. Also, the tone of trading changed Friday. The stocks coming under selling pressure on Thursday made sense, given the tariff catalyst. Everything was sold on Friday. It had the feel of a washout day.
The selling has done too much damage to expect the downtrend to end anytime soon, though. It would take an about-face from Trump on his tariff policies. While possible, it is unlikely Trump will capitulate quite so fast. The time frame for a change in course is more likely months than weeks. Expect a bear market rally that recovers some of last week's losses to begin in the next few days. Also, expect more downside following any counter rally. Stock markets don't move in straight lines. But most 10% or more declines do end in a matter of months.
“Since 1950, there have been 56 pullbacks of 10% or more. Twelve months after those corrections, stocks were higher 49 times. Of the seven times they failed to rebound, six of them came during a recession,” according to Truist Advisory Services.
Keeping history in mind, the odds of a quick bounce back look low. Because, of course, the market turmoil is the result of President Trump’s Trade War. The imposition of the steepest trade barriers in over a century has hammered sentiment across the globe. Earnings estimates are falling.
Market strategists are raising their estimates of the likelihood of a recession in the next 12 months as well. Goldman Sachs raised the probability of a U.S. recession to 35% from 20%. Moody’s Analytics has raised the probability of recession to 40% up from 15% at the start of 2025. The reason for the pessimism is straightforward. Trump's tariffs amount to the biggest tax hike since 1968. And make no mistake, tariffs are a tax on businesses and the American consumer. Trump's tax hike increases the effective rate from 2.5% at the end of 2024 to more than 20%. That is the highest level since the 1930s after the Smoot-Hawley Tariff Act was passed.
Market strategists are also cutting their price targets for the S&P 500 for 2025. RBC Capital Markets on Friday cut its 2025 target by 11% to 5,500. RBC sees growth-scare risks rising amid Trump's tariff plans. Goldman has cut its price target twice from 6,500 to 5,700. A slew of other strategists are reducing price targets as well. “It’s a pity to see the administration take a perfectly good economy and hit it with a wrecking ball,” says Ed Yardeni, president of Yardeni Research.
The UBS economics team believes that U.S. gross domestic product could take a 1.5-to-two percentage-point hit, according to Barron's. UBS also thinks inflation could rise to 5%. “The magnitude of damage they could cause to the U.S. economy makes one’s rational mind regard the possibility of them sticking as low,” UBS strategist Bhanu Baweja writes of the tariffs.
JPMorgan’s take, "We now expect real GDP to contract under the weight of the tariffs… we now look for real GDP growth of -0.3%, down from 1.3% previously." JPMorgan also thinks the unemployment rate will rise to 5.3% by year end. JPMorgan's Michael Feroli believes the hit to consumers from tariff-sparked inflation could rival the price increase seen after the COVID-19 pandemic.
"The most readily quantifiable effect of higher tariffs on activity runs through higher inflation, and hence lower real income and lower real consumer spending. The pinch from higher prices that we expect in coming months may hit harder than in the post-pandemic inflation spike, as nominal income growth has been moderating recently, as opposed to accelerating in the earlier episode," Feroli told Barron’s. "The forecasted contraction in economic activity is expected to depress hiring and, over time, to lift the unemployment rate to 5.3%. If realized, our stagflationary forecast would present a dilemma to Fed policymakers," he added.
The Fed’s dilemma is how to handle both inflation and slowing economic growth simultaneously.
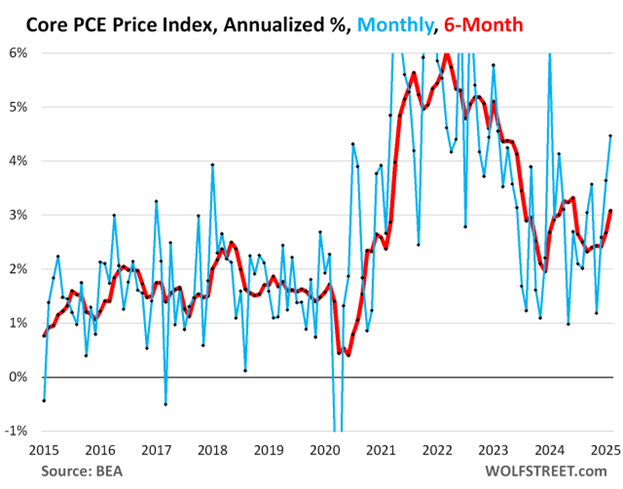
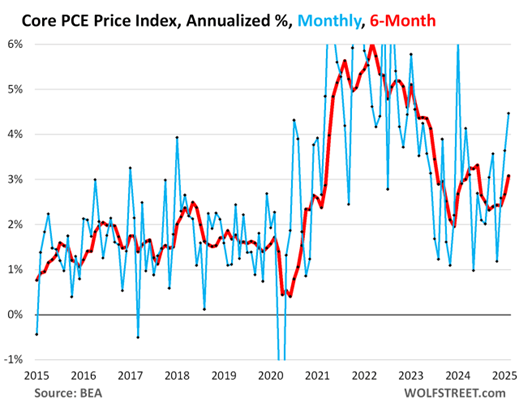
The core PCE price index accelerated to +0.37% (+4.5% annualized) in February from January. It was the worst increase in 13 months. January was revised higher as well, according to data from the Bureau of Economic Analysis (BEA). The 3-month core PCE price index accelerated to +3.6% annualized, the worst increase since March 2024. The 6-month core PCE price index (see chart above) accelerated to +3.1% annualized, the biggest increase since June 2024.
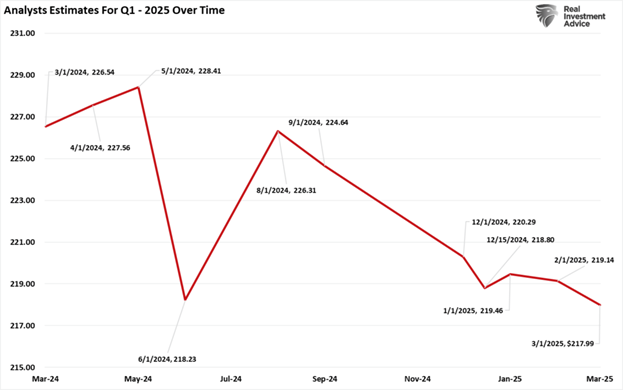
Uncertainty is high. The odds of a rapid end to the trade war are low. The world economy and U.S. economy will suffer in the meantime. S&P 500 earnings growth is unlikely to meet current expectations. Earnings estimates for 2025 have fallen to $268.9 from around $274 six months ago. There may be no earnings growth in 2025. Earnings of $242.7 (2024’s number) puts the S&P price-to-earnings multiple at 21x earnings. The long-run average is around 16.5x. Expect high volatility for at least the next few weeks. Expect the stock market to struggle for the rest of 2025, barring an unexpected end to the Trump Trade War.
(Nothing in this newsletter should be considered investment advice. Short-term market forecasts are highly uncertain and should not be used for trading.)
Regards,
Christopher R Norwood, CFA
Chief Market Strategist