Executive Summary
- The S&P 500 fell 1.5% and ended the week at 5,580.94
- The energy & healthcare sectors are the leading gainers year to date
- The S&P early highs and late lows are a sign of market weakness
- The fixed income market is signaling higher for longer
- Mortgage rates seem high to younger home buyers
- Mortgage rates were higher from 1972-2002
- Earnings & GDP growth estimates are coming down
- The stock market reflects the economy
- Consumer confidence plunged to a 12-year low
- The economy is vulnerable to a declining stock market

The Stock Market
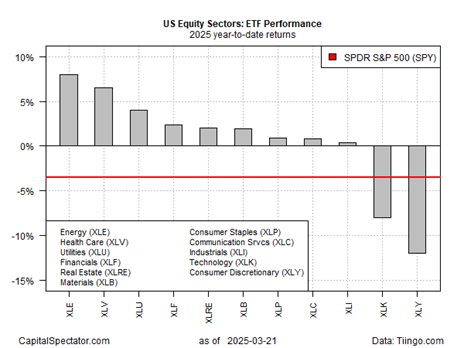
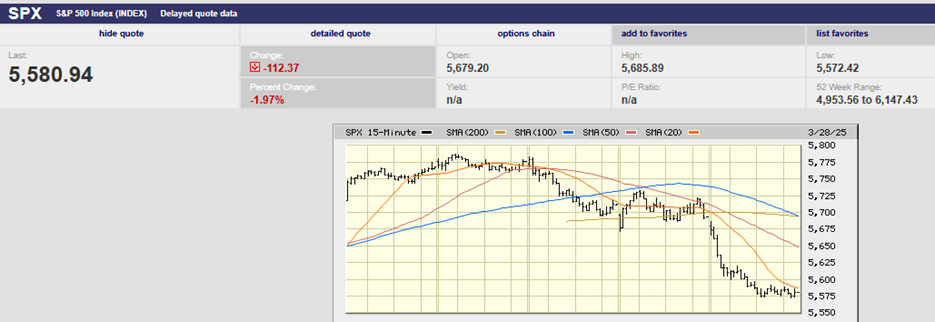
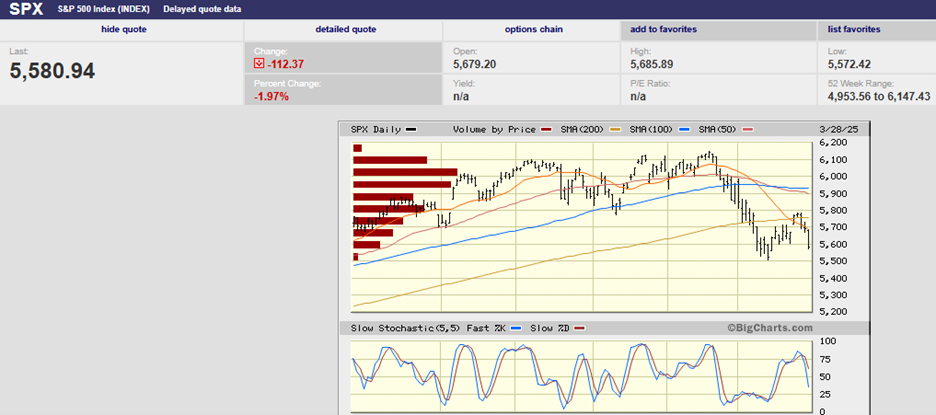
The S&P 500 fell 1.5% and ended the week at 5,580.94. The Nasdaq fell 2.67% for the week. The Dow dropped 1%. The S&P is down 5.11% year-to-date. It is down 9.2% from its all-time high reached in mid-February. Consumer discretionary stocks are leading the decline, down 12.17% year-to-date. Technology is the next worst performer, down 11.24% YTD. Energy is leading the gainers, up 7.90% on the year. Healthcare is the next best, up 5.05% YTD. Energy is a late-cycle sector. Health Care is a defensive sector.
We wrote last week, “It’s unlikely the market will clear the 200-day M.A. at 5,740, let alone push through resistance to a new high. There would need to be a marked improvement in the trade war news first.” We wrote two weeks ago, “The next resistance is around 5,800. There is also stiff resistance in the 5,900 – 6,100 range, the market’s trading range for the last four-plus months.” Finally, we wrote last week that “Too much damage has been done to expect the uptrend to re-establish itself anytime soon. Again, it would take a major improvement on the trade war front first. That seems unlikely in the near term.”
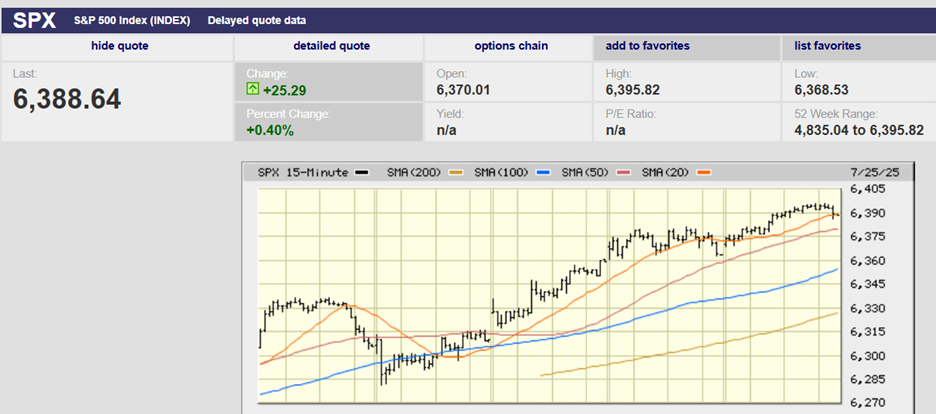
S&P 500 5-Day Chart
Last week’s trading confirmed our analysis, although the S&P did manage to move above the 200-day moving average for a few days (chart below). It closed above the 200-day Monday and Tuesday but couldn’t stay above it. The index saw early highs Tuesday through Friday. It experienced late lows Wednesday through Friday. Early highs and late lows are a sign of market weakness. We can expect more selling this week.
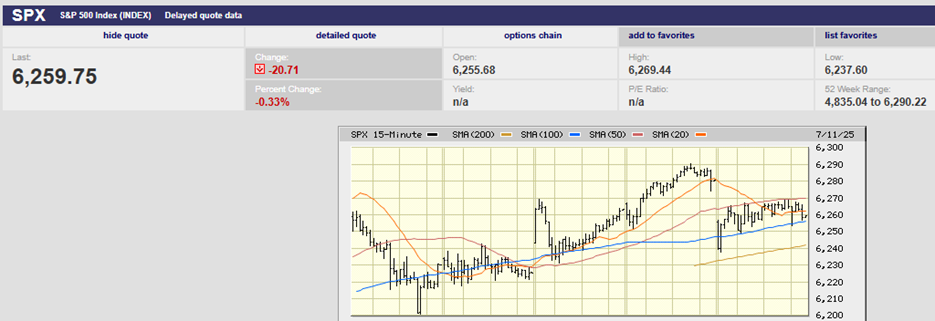
S&P 500 6-Month Chart
There was a three-day top in place by the close on Wednesday. A three-day top predisposes the market to the downside for at least a few days. Still, the S&P managed to trade sideways on Thursday. The S&P did experience a sharp decline on Friday though. The Personal Consumption Expenditures (PCE) Price index was the reason given. The S&P would likely have fallen on Friday regardless, although we’ll never know. First support is at the 13 March low of 5,504.65. Next up would be support at 5,400.
There is one caveat to the technical picture. A Trump announcement weakening the 2 April tariffs would trigger a relief rally. The market is likely to continue to fall in the short-term otherwise. The VIX only hit 22.18 on Friday. It couldn’t push above 30 earlier this month. A spike into the mid to high 30s is likely needed before a short-term bottom is in place.
The fixed income market is signaling higher for longer. The 2-Year Treasury yield closed the week at 3.94%, down from 3.96%. The 10-year Treasury yield remained at 4.25%. The 3-month yield finished the week at 4.33%, keeping the 3M/10Yr curve inverted.
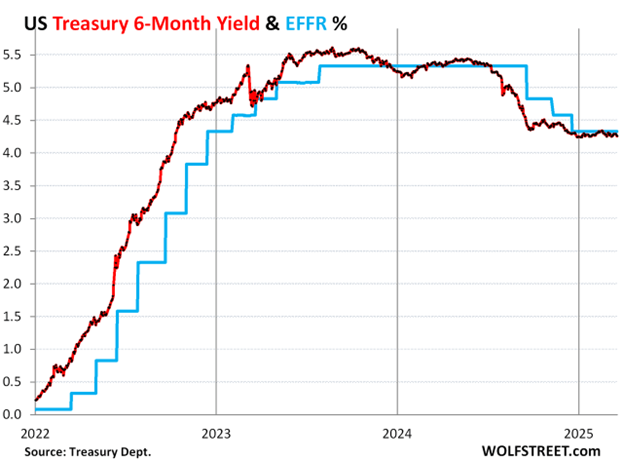
The 6-month Treasury isn’t pricing in a cut within its window.
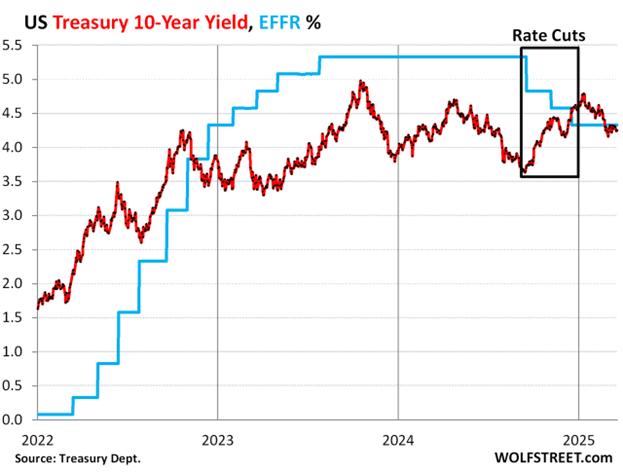
The 10-year yield is signaling investor concern about inflation. The yield is up since the Fed started cutting.
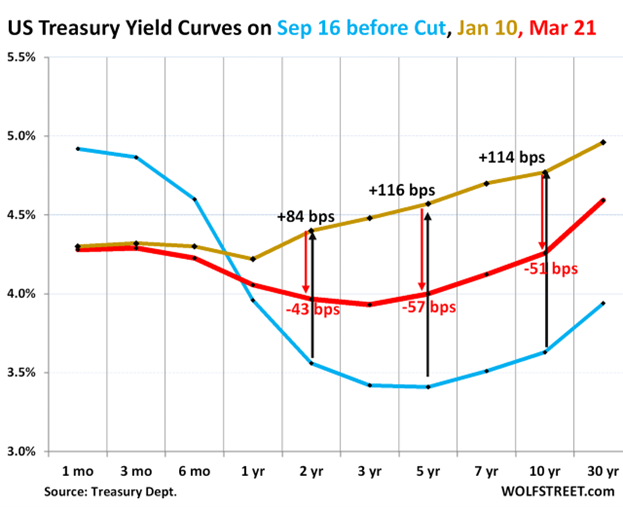
Only the 20-year and 30-year yields are higher than shorter-term yields.
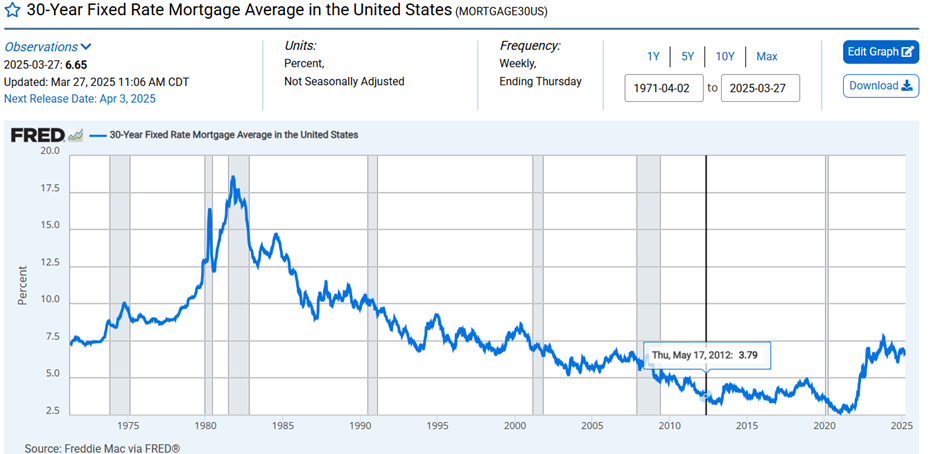
Mortgage rates seem high to home buyers. They are compared to the last twenty years.
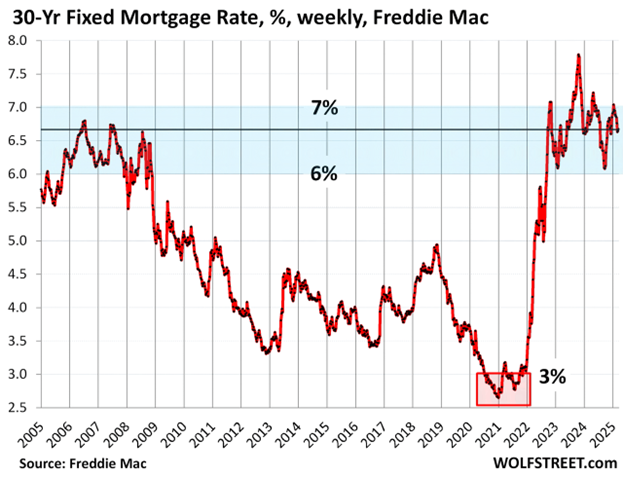
They are not when looking at the long run. In the three decades between 1972 and 2002, 7% was the lower edge of the range for 30-year fixed mortgages. For most of that time, rates were above 8%.
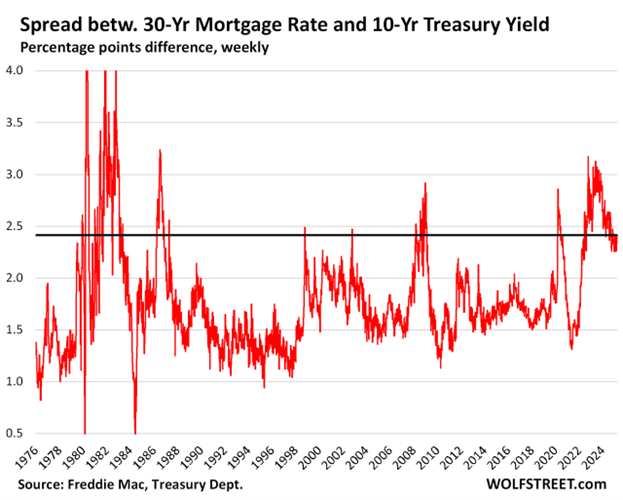
Quantitative tightening (QT) caused the spread between the 10-year Treasury and 30-year fixed mortgage to widen. QT was announced in the spring of 2022 and begun in July 2022. Mortgage rates increased faster and further than the 10-year Treasury yield. The spread exceeded 3 percentage points at one point (chart below), wide by historic standards and last seen in 1986. The spread has since narrowed to 2.41 percentage points. That is still wide. A return to a more normal spread is likely. Either 10-year Treasury yields need to rise or 30-year fixed mortgage rates need to fall, or both.
The stock market reflects the economy. The stock market's technical picture is weakening. Fundamentals are weakening as well. The housing market isn't healthy. Corporate earnings growth estimates are coming down too. A “stagflatonary combination” of economic data ahead of next week’s tariff announcement from the Trump administration sent “traders flocking towards their bunkers,” José Torres, senior economist at Interactive Brokers, said Friday. Trivariate Research founder Adam Parker believes the fundamental message is clear. “It’s not (just) a growth scare if things are slowing,” he says. The Atlanta Fed GDPNow estimate for Q1 2025 was negative 2.8% on March 28, down from negative 1.8% on March 26.
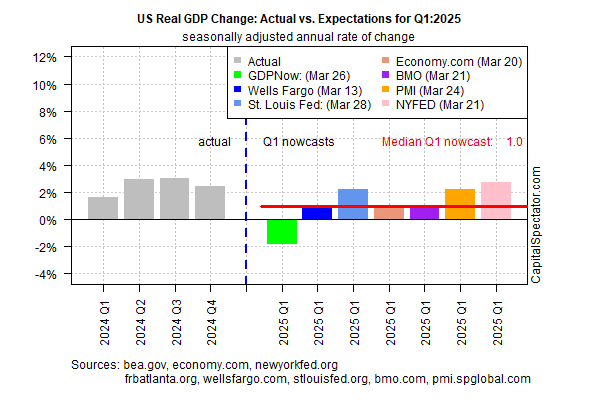
Earnings growth estimates are coming down right along with GDP growth estimates. The aggregate earnings from the S&P 500 are expected to total $268.77—down from $272.15 at the end of last year, according to Barron’s. That would still be a 10% increase from 2024’s $243.72. “The S&P 500 index is likely pricing in something close to $259, but even that is likely too high,” according to Lawrence McDonald of the Bear Traps Report. McDonald is looking for earnings closer to $230 in 2025. At $270, the S&P 500 trades at 20.64 times earnings; at $259, it trades for 22 times; and at $230, it would trade for 24.8 times. The long-term average for the S&P 500 is around 16.5x. “Estimates are still too high based on the rate of change and the way chief financial officers have acted,” McDonald told Barron’s.
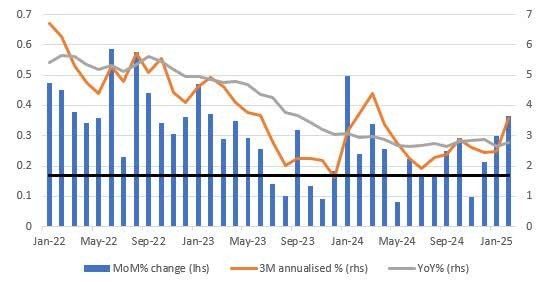
Core PCE price inflation came in hotter than expected on Friday. The PCE is the Fed's favored measure of inflation. And the impact of tariffs isn’t in the numbers yet. The University of Michigan Consumer Sentiment survey showed inflation expectations rising as well. Consumer inflation expectations that are not “well anchored” get the Fed’s attention. Also, consumer confidence plunged to a 12-year low, the Conference Board reported last week. The drop corroborated similar downbeat recent readings from the University of Michigan.
The core PCE index rose 0.4% in the month, above the consensus call of 0.3%, pushing up the year-on-year gain to 2.8% from 2.7% in January. Personal income jumped 0.8% in the latest month, twice the forecast. Most of the rise was due to government benefits. Real earnings net of transfer payments isn’t up much, only around 1% from a year ago, according to Barron’s.
The economy is vulnerable to a declining stock market. The top 10% of incomes account for nearly half of all consumer spending. The top 10% of American earners controlled 87% of all household ownership of equities, according to the Fed. Arbor Data Science found that equity ownership among the top 1% doubled from 2020 to 2024. Equity ownership has risen to $18 trillion, thanks to the bull market. Likewise, the value of stockholdings of the next 19% more than doubled, to $22.5 trillion from $10.4 trillion. A declining stock market may have an impact on consumer spending. Consumers watching investment accounts decline are more likely to save than spend.
Regards,
Christopher R Norwood, CFA
Chief Market Strategist