

Executive Summary
- The S&P 500 rose 0.7% last week to finish at 6,840.20
- The S&P is up 16.3% year-to-date
- A stock represents ownership in a business
- The S&P 500 is rising at an increasing rate, and that can't go on forever
- Profit margins have been stable over the long run
- The Federal Reserve cut the Fed funds rate by one quarter point last Wednesday, but why?
- Inflation appears nowhere near declining to the Fed’s 2% target
- The annualized headline CPI September number was the second-highest since January
- Inflation is hurting the lowest 50% of income earners in the U.S.

Last week’s stock Market (chart above)
The S&P 500 rose 0.7% last week to finish at 6,840.20. The Nasdaq 100 rose 1.9% last week, and the Dow rose 0.7%. The S&P is up 16.3% year-to-date. It is up 19.89% in the previous 12 months. It is up 109.18% over the trailing 5 years. Meanwhile, the Nasdaq is up 37% over the last 7 months.
A stock represents ownership in a business. Owners are entitled to their share of the profits. The 500 stocks that make up the S&P 500 have not doubled their profits in the last five years. Investors are paying more for every dollar of profits. The S&P is trading at almost 32 times trailing twelve-month reported earnings. The long-term average is around 16 times. (chart below)

The S&P 500 is rising in a parabolic curve. (chart below).

S&P 500 Since 2004
A parabolic curve has an increasing slope. A parabolic stock market move can’t last forever. That is because the stock market can’t increase at an increasing rate forever. Profits don't increase at an increasing rate forever. Stock investors have demanded a 9% to 10% return on their stock investments going back to 1871. We know that to be the case because the stock market has returned between 9% and 10% going back to 1871.
The long-run return isn't a haphazard number. Nominal GDP has grown around 6% per year dating back to 1871. Profit margins have been stable over the long run. Nominal GDP growth of 6% means nominal net profit growth of around 6%, given stable profit margins. Tack on inflation of around 3.5% over the long run, and lo and behold - you have a 9.5% return on stocks. A real return of 6.5% is, in fact, the return investors have earned dating back to 1871, according to Dr. Robert Shiller.
The S&P 500 is trading at a price/earnings ratio of 24 times next-12-month earnings projections, according to S&P Capital IQ. It's a 42% premium to its 20-year average. It's more than two standard deviations above the long-term average. The S&P 500 is also trading 13% above its 200-day moving average. The index traded 9% above the 200-day moving average in early 2022. It dropped by over 27% from its January 4th, 2022, high to its October 10th low. The Fed hiking the Fed funds rate was the catalyst for the bear market in 2022. The Fed is cutting rates now. So perhaps the extended market can remain extended for a while longer.
The Federal Reserve cut the Fed funds rate by one quarter point last Wednesday. It is the second rate cut in as many months. The question is, why is the Fed cutting rates?
Kansas City Federal Reserve Bank President Jeffrey Schmid asked the same question in his dissent. He cited easy financial conditions as one reason for his dissent. Equity markets are near record highs. Corporate bond spreads are narrow. High-yield bond issuance is robust. There appears to be plenty of liquidity in the financial system. Schmid wrote in his dissent that monetary policy isn’t restrictive. (He’s right). Schmid also pointed out that inflation has exceeded the Fed’s 2% target for more than four years. Core PCE is expected to remain above the Fed's target until year-end 2028. The Fed has no real insight into the economy or inflation three years from now.
The bond market took notice of the Fed’s rate cut. Interest rates rose on Wednesday. The selloff in the bond market was blamed by some on Powell’s press conference. Specifically, investors pointed to Powell’s comment that a December rate cut was far from a sure thing. But bonds began selling off early Wednesday morning. Prices didn’t stabilize until early Thursday morning. The sell-off was underway well before Powell began speaking at 2 p.m.
Inflation appears nowhere near declining to the Fed’s 2% target. Rising bond yields make sense. Inflation is a bond investor's enemy. There is an increasing likelihood of higher, not lower, longer-term bond yields in 2026.
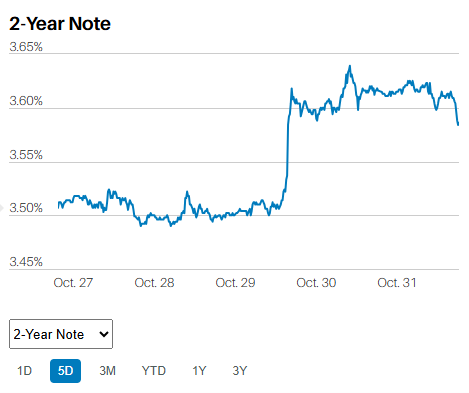
The two-year rate (chart above) most closely tracks the Fed funds rate (FFR).

The 10-year Treasury yield most influences the 30-year fixed mortgage rate. The long-run average yield for the 10-year Treasury is around 4.5%. The long-run average 30-year fixed mortgage rate is around 7.0%. A 2.5% spread between the two is normal. A move higher in the 10-year yield to 4.5% - 5.0% would cause the 30-year fixed mortgage rate to rise. It would impact the housing market. The Trump administration is planning on issuing more Treasury bills and fewer 10-year bonds. The hope is to keep the 10-year yield from rising, or even cause it to fall by some amount. Meghan Swiber of BofA Securities estimates the Trump plan would reduce the benchmark yield by around 32 basis points (0.32%).
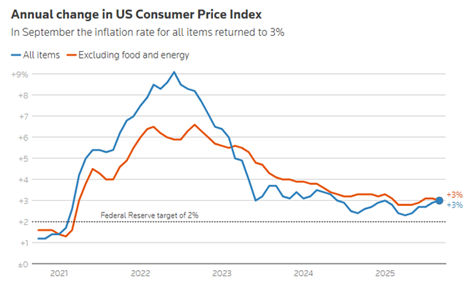
The Fed cutting and the Trump administration pushing on the longer end of the yield curve. More easing while Inflation is still a problem. The Fed’s decision to focus on the job market may lead to rising inflation in 2026. Headline CPI rose 0.31% in September. It rose to a 3.8% annualized rate. Core CPI rose by 0.23% in September. The year-over-year increase was 3.0%. The September CPI readings would’ve been worse if not for the Owners’ Equivalent of Rent (OER) number. OER accounts for 26% of headline CPI and 33% of core CPI. It accounts for 44% of the core services CPI.
Wolf Richter thinks the understaffed BLS put out a bad number for OER. The 0.13% September number is too big of a change from the prior month’s 0.38% reading, he wrote last week. A nasty revision is pending if Richter is correct. As it is, inflation is still too high.
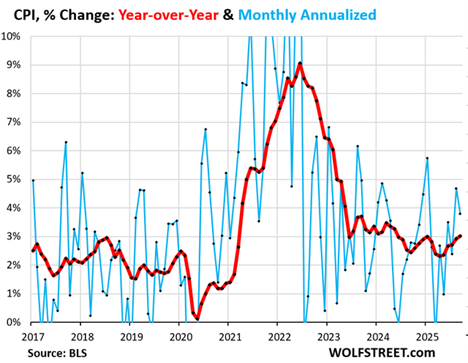
The annualized headline CPI September number was the second highest since January (blue in chart below). The year-over-year headline CPI rose 3.01% (red below). It was the worst increase since 2024 and the sixth acceleration in a row, according to Richter.
“Core” CPI showed the massive push-down from the OER outlier (core excludes food and energy). Core rose by only 0.23% (2.8% annualized) in September from August (blue), which caused the year-over-year increase to decelerate to +3.0% (red)."

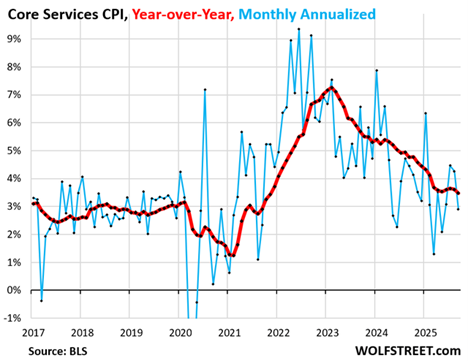
Core services are about 60% of the headline CPI. They include many of the essentials that consumers cannot do without. Those services include OER, medical care, health insurance, and auto insurance. Core services also include telephone, internet, and wireless services; lodging, rental cars, airline fares, education, movies, sports events, club memberships, water, sewer, trash collection, motor vehicle maintenance, and repair. So, the stuff that almost everyone needs to pay for.
Inflation is too high, regardless of whether Richter is right about OER. Yet the Fed is cutting. The odds of rising inflation in 2026 are increasing. The lower 50% of income earners in the U.S. are already suffering. They will suffer more if inflation doesn't continue to fall to below 2%.
For that matter, it’s far from clear that the Fed needs to cut to save the jobs market. The Labor Department hasn’t released official estimates of weekly initial jobless claims since early October. The government shutdown is ongoing. Citigroup economists estimate initial jobless claims fell to 220,000 for the week ending Oct. 25. They estimate claims in the prior week were 232,000. Citigroup is using available state data to generate its estimates. If Citigroup is right, one of the best leading indicators for jobs is signaling a strong jobs market.
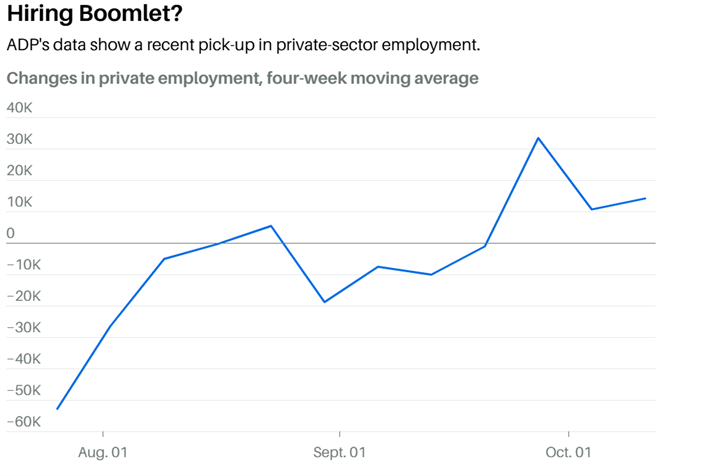
Also, ADP reported on Tuesday that total private employment grew by a four-week moving average of 14,250 jobs in the week ended Oct. 11. That is up from a four-week average gain of 10,750 jobs in the week ended Oct. 4.
The Dallas Fed Weekly Economic Index tracks weekly changes in consumer behavior, the labor market, and production. The Dallas Fed uses the Weekly Economic Index to estimate real economic growth. Currently, the Weekly Economic Index implies growth of 2% to 2.5% in Q3 and so far in Q4. As well, the Atlanta Fed’s GDPNow tool is estimating Q3 GDP growth of 3.9% as of 27 October. Bank of America points to total credit-card spending per household. BofA reports that spending rose 0.8% in the year ending 25 October, a strong number. Finally, small businesses are signaling plans for increased hiring.
The American economy is growing. Unemployment and initial jobless claims are low. Inflation is high. Financial conditions are easy. Why is the Fed cutting?
(None of this newsletter is intended as specific or appropriate investment advice. Consult a financial planner or advisor for advice that may be appropriate for your situation.)
Regards,
Christopher R Norwood, CFA
Chief Market Strategist


