

Executive Summary
- The S&P 500 rose 1.7% last week to finish at 6664.01
- The Nasdaq & the Dow Jones rose as well last week
- We had an inside day last Monday, then an inside week
- Earnings season is here
- The four credit events might snowball into something more serious
- Credit spreads have started to react, widening over the last two weeks
- Bond yields fell (yields down, price up) last week
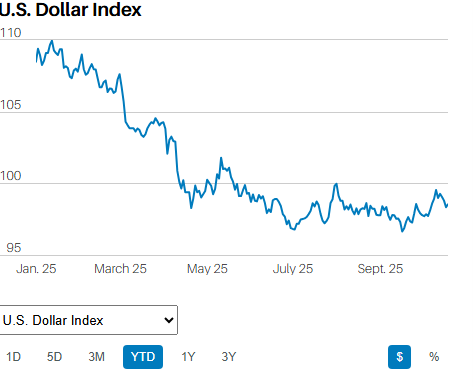
- The dollar index is also falling
- The Federal Reserve has been draining excess reserves from the system since 2022
- It appears as if the Fed has no choice but to end its Quantitative Tightening (QT) program
The Stock Market
The S&P 500 rose 1.7% last week to finish at 6664.01. The Nasdaq 100 was up 2.4% and the Dow was up around 1.5%.

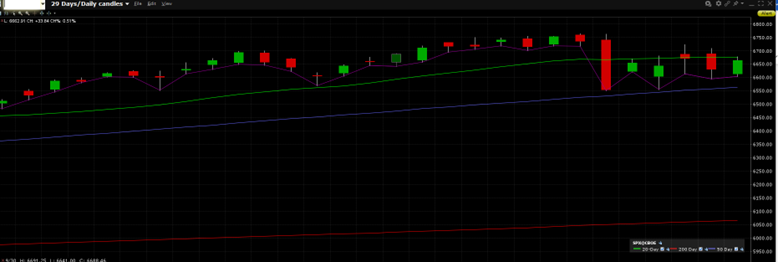
S&P 500 5-Day Chart
The S&P 500 spent the entire week inside the low and high set a week ago Friday. That’s unusual to say the least.
S&P 500 index
We had an inside day last Monday. (An inside day is a price chart pattern where the high and low are within the range of the previous day's high and low.) And then we had an inside week, something I’ve not seen before. The pattern usually indicates market consolidation. Investors don’t push the index higher or lower. Instead, the index sits there with investors unsure whether to push higher or sell it down. It’s a market without a clear trend. Uncertainty reigns.
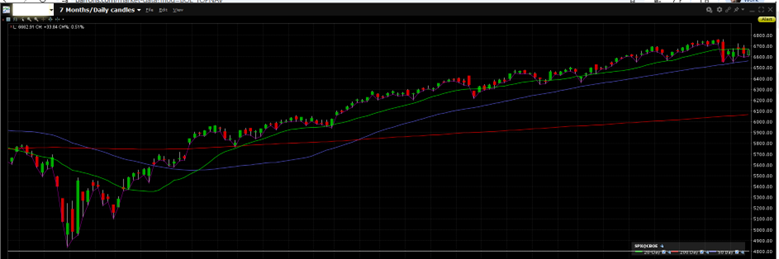
S&P 500 since the April low
The chart above shows that the longer-term direction is up. The short-term direction is far less certain. The S&P might continue to consolidate this week. It might resume its long-term uptrend. It might also head lower.
Earnings season is here. The consensus estimate is for a modest rise of 6.7% in earnings in Q3. The bar is low. Upside surprises would push the stock market higher. Earnings disappointments would likely trigger a correction. The correction could be 10% plus, given the stretched nature of the stock market. Low earnings expectations, the Fed cutting interest rates, and upside momentum give us reason to expect gains. On the other side of the ledger is an overbought, expensive market. Credit cracks provide us with reason to expect a correction, also. Time will tell which forces are stronger.
The credit crack narrative made an appearance last week. Stock investors heard bad news from two regional banks. Zions Bancorp said it would take a $50 million charge-off related to fraudulent loans. Western Alliance Bancorp stated it had sued a borrower in August, seeking to recover $100 million. The credit events occurred not too long after two auto-related businesses declared bankruptcy. Tricolor and First Brands are private companies. They relied on the private credit market for financing. The fear is that the four credit events might snowball into something more serious.
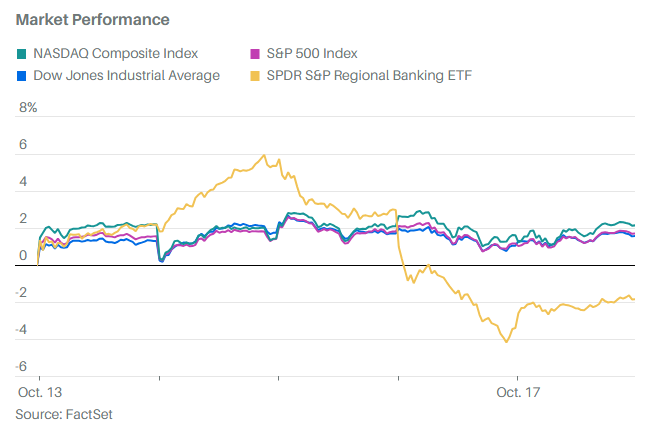
Last week’s news sent shares of regional banks sinking on Thursday. (chart below)
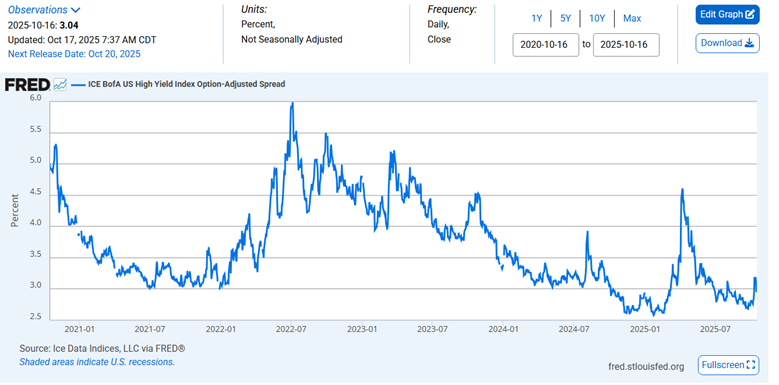
Credit spreads have started to react, widening over the last two weeks. Spreads bottomed at 2.69% on 22 September. They’ve risen as high as 3.18% by 13 October. The ICE BofA High Yield OAS closed Friday at 3.04%. The level is still low but the trend higher bears watching.
JPMorgan’s CEO Jamie Dimon warned last week that there are likely to be more credit issues. He pointed out that where there's one, there are usually more, like cockroaches. One of the problems with some of the credit concerns is the nature of the credit itself. The Shadow Banking system has grown substantially since the Great Recession. Nonfinancial depository institutions (NFDIs) are making more loans. NFDI funding is lightly regulated. Loans are made to less transparent borrowers. Hedge funds, Business Development Companies (BDCs), and private companies use leverage. Shadow Banks provide the lending.
NFDIs now account for around 33% of all commercial and industrial loans, according to J.P. Morgan data. “The scary element of this story is that with NFDIs’ less stringent lending standards, we must assume there is more (credit issues) out there,” notes Pave Finance Chief Market Strategist Peter Corey. Private credit and private equity (together, alternative investments) have ballooned to around $2 trillion, not a small number. The credit events that have surfaced and possible future credit events bear watching. More defaults could eventually shake the stock market's confidence.
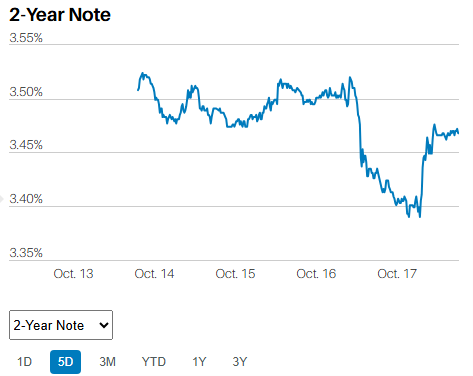
Meanwhile, bond yields fell (yields down, price up) last week. The 2-Year yield ended at 3.47%.
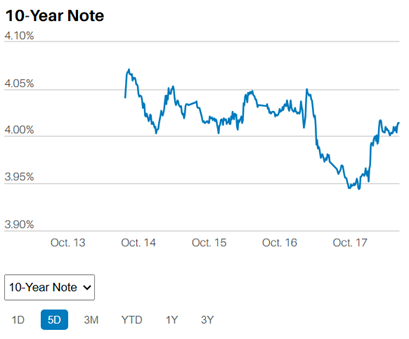
The 10-Year yield ended the week at 4.01%.
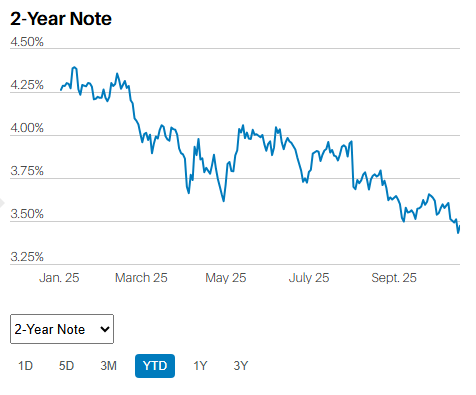
The 2-Year yield has been falling all year.
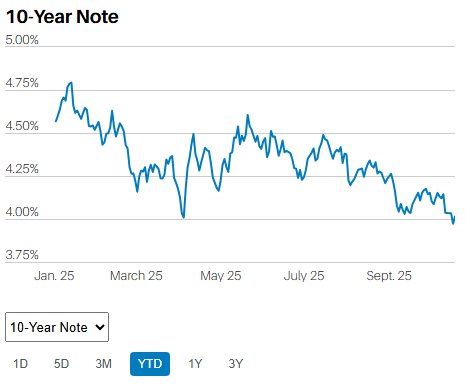
And so has the 10-Year Yield.
Yields fall as bond prices rise. It’s a mathematical relationship. It means bond investors are buying Treasuries. Falling yields occur when the economy is slowing and labor markets are struggling.
The dollar index is also falling. The dollar usually falls when the economy is slowing, and interest rates are falling.
Yet stock investors continue to bid up stocks. Gold and cryptocurrencies are trending higher as well. Stocks, gold, and cryptocurrencies tend to do well when there is a lot of liquidity. They also do well when the economy is growing at or above the trend rate, and when inflation is in the air.
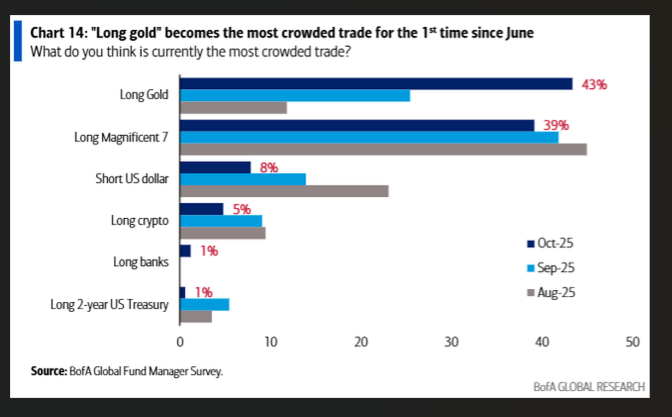
Gold is a crowded trade, more crowded even than the “Mag-7” stocks. (chart above). Is gold sniffing out a rebound in inflation? An ongoing depreciation in the dollar? A looming geopolitical event? Or is the strong uptrend simply the result of momentum at this point?
Regardless, someone is wrong. The stock market will fall if bond investors are right. The stock market will rise if stock, gold, and crypto investors are right. For what it's worth, bond investors have a better track record.
There is another possible crack developing in the financial system besides souring loans. Liquidity is drying up. Liquidity is the grease that makes our economic system go. The economy was flooded with liquidity during the Covid crisis. That was besides the fire hose of liquidity during and immediately following the Great Recession years. The Federal Reserve has been draining excess reserves from the system since 2022.
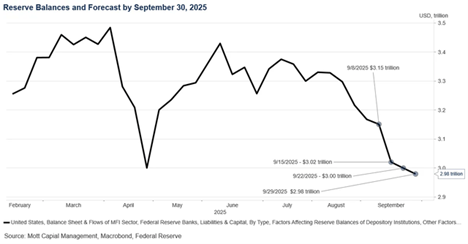
Reserve balances are running low.
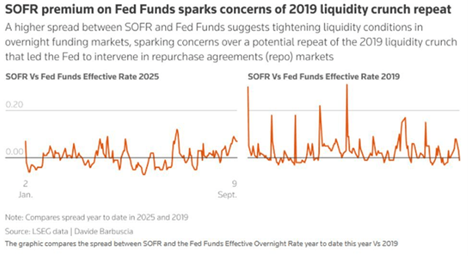
(Secured Overnight Financing Rate (SOFR). SOFR is a broad measure of the cost of borrowing cash overnight. It has replaced LIBOR. SOFR is trading above the Fed Funds effective rate (2025) See chart above)
SOFR vs Fed Funds Effective Rate flashing liquidity warning. SOFR is beginning to trade above the Fed Funds rate. (chart above). That suggests tightening liquidity conditions.
Michael Kramer of Mott Capital had this to say about the chart below:
SOFR has been generally trending higher compared to interest on reserve balances and has been much more volatile than historical trends, indicating that liquidity in the overnight funding market is not as abundant as it once was. Part of what is driving this volatility in the overnight funding market is not only the decline in reserve balance but also the consistent need for the Treasury to issue new debt, which continues to suck liquidity from the overall market.
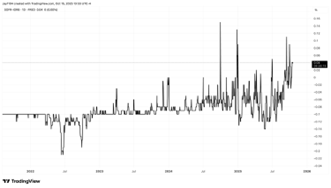
SOFR volatility is rising (chart above)
Finally, usage of the Fed’s overnight reverse repo (RRP) facility has collapsed. The RRP facility has fallen from roughly $2.5 trillion at the 2022 peak to under $100 billion today. The financial system’s liquidity buffer has thinned as a result.
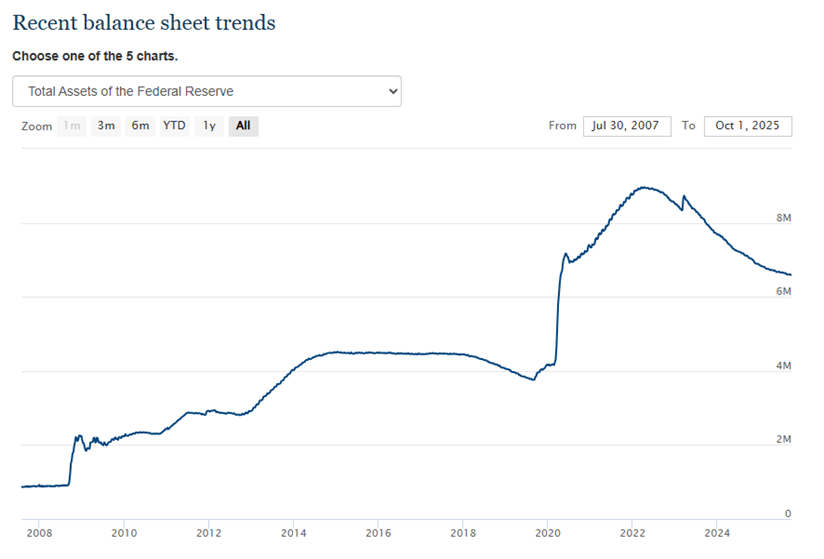
Taken all together, it appears as if the Fed has no choice but to end its Quantitative Tightening (QT) program. It has been able to shrink its balance sheet from around $9 trillion to around $6.4 trillion. (chart below) Reserves are still ample, but overnight liquidity is increasingly stressed. No one wants another liquidity crisis like in 2019.
(None of this newsletter is intended as specific or appropriate investment advice. Consult a financial planner or advisor for advice that may be appropriate for your situation.)
Regards,
Christopher R Norwood, CFA
Chief Market Strategist


