Executive Summary
- The S&P 500 was flat last week
- The U.S. government is once again open for business
- Markets thrive when liquidity rises
- GDP grows faster when the government spends more
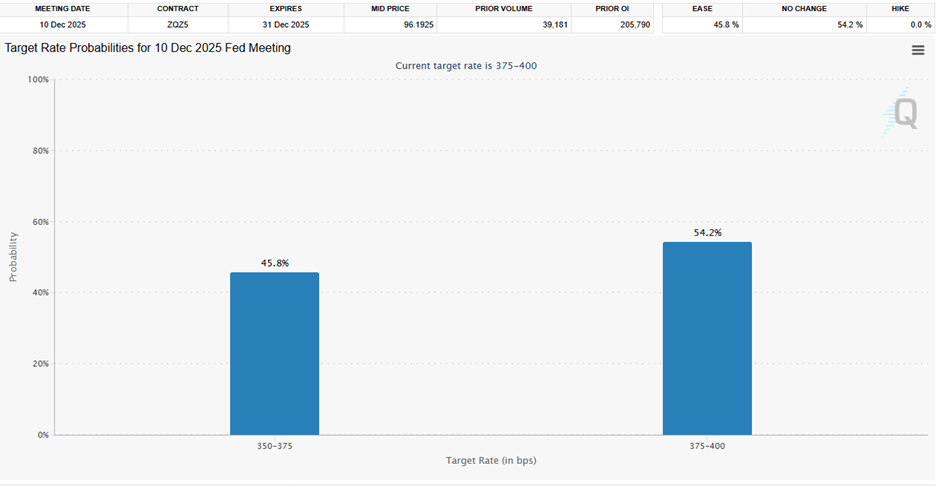
- The odds that the Fed will cut a quarter-point on December 10th fell to 45.8%
- The S&P 500 is a concentrated index, heavily weighted toward technology
- Diversification reduces risk without necessarily reducing return
- Deciding when to take Social Security is about maximizing your benefit
(A quick note this week due to travel on my part. You’ll find a variety of comments about last week’s market and events that may impact the stock and bond markets. Also, some thoughts on conversations with clients.)
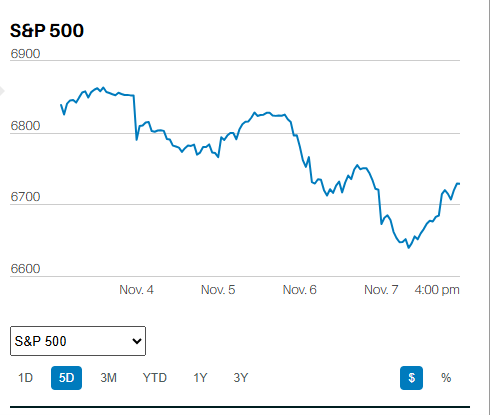
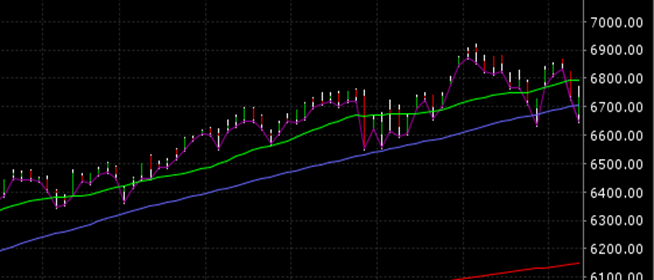
The S&P 500 was flat last week and is testing its 50-day moving average again (purple line below). We may see a down week this week. A fall below November 7th’s low of 6631.44 would likely lead to a further drop. A lower high and lower low would be in place, the definition of a down trend.
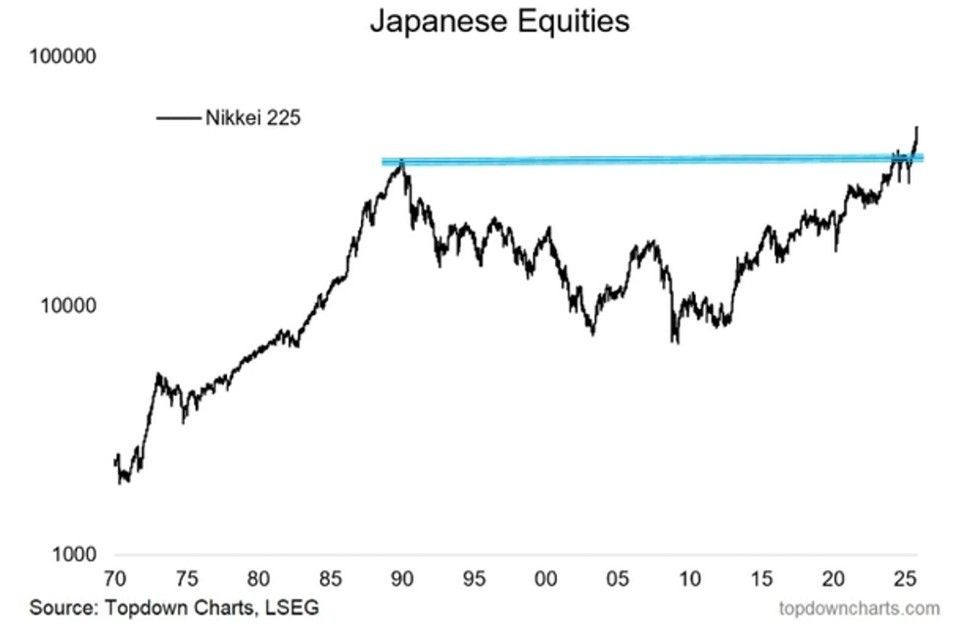
Cisco Systems finally topped its year 2000 share price of $78 last week. The Nasdaq fell by some 82% during the dot.com bust. It took 18 years for the tech sector to catch up to the S&P 500 index. It took the Nikkei 225 36 years to surpass its 1989 high. The Nikkei finally reached its new high this year.
The U.S. government is once again open for business. Liquidity should improve as the Treasury General Account (TGA) is tapped to pay the bills. Markets thrive when liquidity rises. There is also the direct impact of government spending on Gross Domestic Product (GDP). GDP = Consumer + Government + Business Investment + Net Exports. GDP grows faster when the government spends more.
Investors are less certain that the Fed will cut on December 10th. The CME FedWatch tool has the odds of standing pat at 54.2%. The odds of a quarter-point cut fell to 45.8%.
Perhaps that is why the 10-Year yield rose last week to 4.16%.
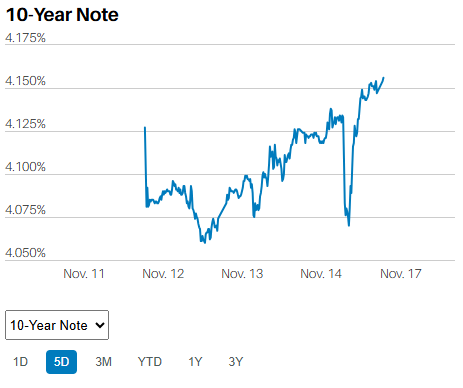
The other possibility is that investors are sniffing out more large deficits and ongoing inflation. The 10-year Treasury yield and gold rose last week after Trump signed the spending bill.
Nvidia has a higher correlation with the S&P 500 than the S&P 500 does with the equal-weighted S&P 500. Nvidia’s market cap represents 7.7% of the S&P 500 market cap. It is no longer your grandfather’s stock market. It isn’t even your father’s stock market. The S&P 500 is a concentrated index, heavily weighted toward technology. How concentrated?
This concentrated:
A Fidelity Announcement:
Effective November 10, 2025, Fidelity updated the diversification policy for the following equity index funds to allow them to operate as non-diversified when needed, to better match their index weightings.
Fidelity 500 Index Fund (FXAIX) Benchmark: S&P 500® Index
Fidelity Total Market Index Fund (FSKAX) Benchmark: Dow Jones U.S Total Stock Market Index
*VIP Index 500 Portfolio (Initial Class, Service Class and Service Class 2) Benchmark: S&P 500® Index
Why is this important? Index funds are designed to closely track their performance benchmarks. When an index becomes concentrated, such as when a few U.S. companies represent a historically large share of the index, a diversified fund may struggle to match the index’s constituents’ weightings. To address this, the SEC has provided relief that permits certain diversified index funds to operate as non-diversified when needed. This flexibility is a modification to each fund’s diversification policy. The funds will retain their diversified status, but will be permitted, when necessary, to operate as non-diversified to match the constituent weightings in their index. This flexibility can help the funds track their benchmarks more closely, minimize tracking error, and reduce trading costs.
The S&P 500 is concentrated and no longer qualifies as a diversified index at times. The Securities and Exchange Commission (SEC) is waiving the concentration rules so that Fidelity and other indexers can better track a concentrated index.
Diversification reduces risk without necessarily reducing return. Concentrating a portfolio increases risk without necessarily increasing return. Folks should diversify their investments.
Social Security is a benefit, part of the social safety net. You earn the benefit in part by paying into the Social Security trust fund. It’s possible to receive 124% of the benefit by waiting until age 70 to start taking Social Security. People born before 1960 receive an even higher percentage of the full retirement age (FRA) benefit. Break-even is 82 years of age. The decision to wait or not comes down to a bet on your longevity. My dad and mom are both 92. My uncle is 94. My Grandpa was 97 when he died, and my Grandma was just shy of 100. My other Grandma lived to 88 years of age. I’m waiting until 70 to start collecting. I expect to receive at least $100,000 more by waiting until 70. All I have to do is live to be 92.
Blue is better than shrimp, or so many financial advisors would have you believe. They would have you believe that calculating how to maximize your lifetime Social Security benefit can be compared to investing your savings. Turn on your social security early. Save it rather than spend it (ya right). Attempt to earn more than 8% per year with your savings. Ignore the fact that 8% is the increase in guaranteed yearly cash flow received by waiting an extra 12 months before taking Social Security. It is a lifetime guarantee. It is not comparable to attempting to earn an 8% return on your investment portfolio from one year to the next. Instead, wait three years and get an extra 24% in cash flow for the rest of your life (or your spouse's life if they outlive you).
Is blue better than shrimp?
A 60/40 stock/bond portfolio will earn around 7.5% on average using historical returns. But there is no guarantee. And ratcheting up your stock exposure means taking on more risk.
The years surrounding your retirement are most sensitive to your investment returns. It's called “sequence of return” risk. A 30-year-old can lose 50% and not have their retirement affected much, if at all. A 60-year-old who loses 50% is likely to have their retirement affected. It matters when big losses happen. That is why an 85-year-old can take more investment risk than a 65-year-old. The 85-year-old is farther away from their retirement and has fewer spending goals as a result. Their retirement is less sensitive to investment returns.
Don’t let a financial advisor talk you into taking your guaranteed inflation-adjusted benefit early so they can invest your money in the stock market. Deciding when to take Social Security is about maximizing your benefit. It is not about what you may or may not be able to earn with your savings.
(None of this newsletter is intended as specific or appropriate investment advice. Consult a financial planner or advisor for advice that may be appropriate for your situation.)
Regards,
Christopher R Norwood, CFA
Chief Market Strategist