

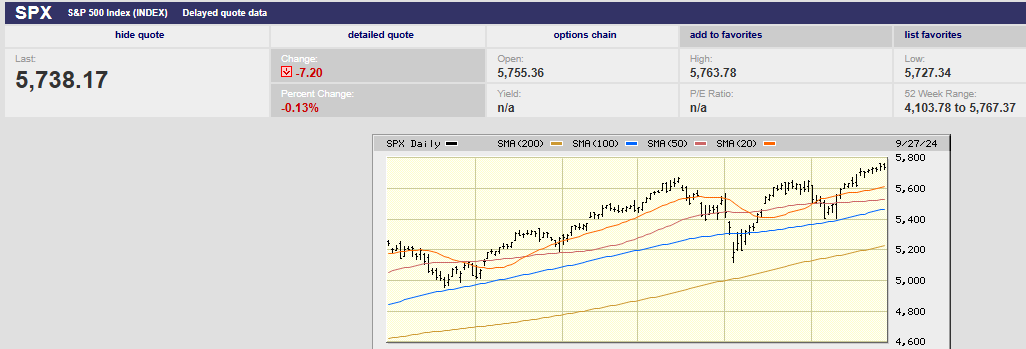
The S&P continues to rise but more slowly (6-month chart)
Executive Summary
- The S&P 500 set a new high last week
- Bonds continue to paint a bearish economic picture
- The Fed seems determined to continue cutting rates
- The Fed may not be able to cut as much as it would like due to inflationary pressures
- The U.S. personal savings ratio is "super low"
- Consumers say jobs are increasingly hard to get
- Dividends are an important part of total returns
Market Update/Economic Indicators
The S&P 500 rose 0.7% to finish the week at 5,738.17. The index set new records along the way, peaking on Thursday at 5,767.37. The Nasdaq 100 rose 1.1% on the week. The 10-year Treasury yield rose to 3.75% from 3.73% the prior week. The 10-year yield was 3.62% on 16 September, two days before the Fed rate cut. The two-year Treasury yield remained at 3.59% last week.
Interest rates dropped in the weeks before the Fed rate cut. It’s possible it's been a “buy the rumor sell the news” event. Perhaps the backup in rates is nothing more than some profit-taking. It’s also possible that the two-year Treasury bond is sending a warning. It is signaling more rate cuts to come. Rate cuts are usually about saving the economy or the financial system.
Meanwhile, the rise in the 10-year yield may signal that investors have had enough of deficit spending. Government interest expenses already exceed defense spending after all. The government's massive borrowing could be creating more supply than the market can absorb. It was reportedly the reason the Treasury shifted more of its borrowing to the short end of the curve in 2023. An increase in supply means falling prices and rising yields. It's too early to tell whether the bond market is saying nomas, but worth keeping an eye on.
Regardless, the S&P’s uptrend is intact. The rally has broadened, a positive. September is coming to an end and a momentum-fueled run into year-end is consensus. One cautionary flag is the lack of confirming new highs for the Nasdaq and Russell 2000. It’s a minor caution though given the broad participation in the rally since July.
The Fed seems determined to keep cutting. A rate-cut cycle while the stock market is climbing to record highs is unusual. Other oddities include tight credit spreads, record gold prices and a 3.1% GDPNow forecast for Q3. The 3.1% forecast is above the sustainable non-inflationary rate, estimated at around 1.8% by the Fed. Wage growth is at 4.6% according to the Atlanta Fed. Sticky price inflation is trending down but still at 4.10% as of August. Initial jobless claims last week were a low 218,000 down from 222,000. All in all, not the norm during a rate-cut cycle.
The Fed may not be able to cut as much as it would like. Pricing pressures could return given a seemingly strong economy with inflationary hotspots. “In my view, the upside risks to inflation remain prominent,” Fed Governor Michelle Bowman said on Tuesday. “Global supply chains continue to be susceptible to labor strikes and increased geopolitical tensions, which could result in inflationary effects on food, energy, and other commodity markets. Expansionary fiscal spending could also lead to inflationary risks, as could an increased demand for housing given the longstanding limited supply, especially of affordable housing.” Bowman was the lone dissent during the Fed meeting. She wanted a quarter-point cut. Her dissent was the first by a Fed governor since 2005.
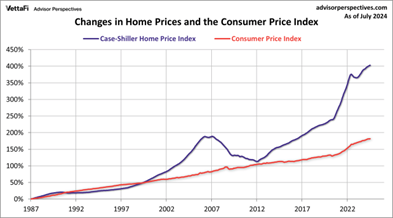
One need look no further than housing to see continued inflation in shelter costs in our future. Economists expected shelter costs to start falling by mid-2024. They have not.
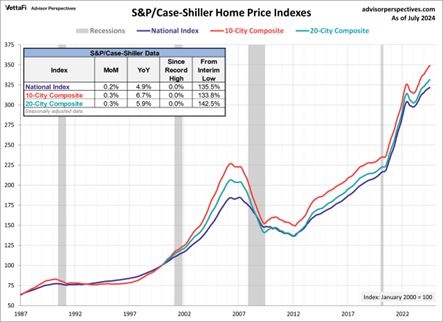
A housing shortage means likely inflationary pressure from shelter costs for the foreseeable future.
For now however, inflation appears to be cooperating.
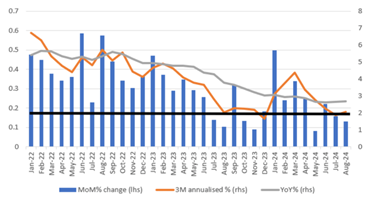
Friday’s core Personal Consumption Expenditure (PCE) index clocked in at 0.13%. The inflation measure climbed to 2.7% from 2.6% year-over-year. The YoY rate should fall again next month. It should then hold in the mid-2% area through year-end. Tough monthly comparisons from last year makes a pause in declines likely. Readings averaged 0.14% over the final three months of the year in 2023. Core PCE should resume its decline in the first quarter of 2025 given a series of 0.3% and 0.4% MoM reports at the start of 2024.
Bond investors are front-running what they believe will be an aggressive rate-cutting campaign.
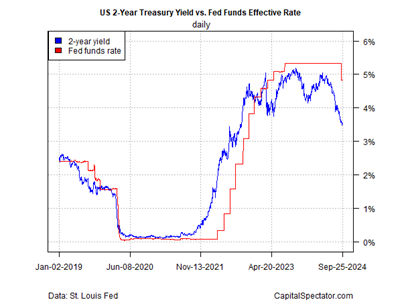
The 2-year yield chart above shows that investors are expecting a rapid drop in the Fed funds rate.
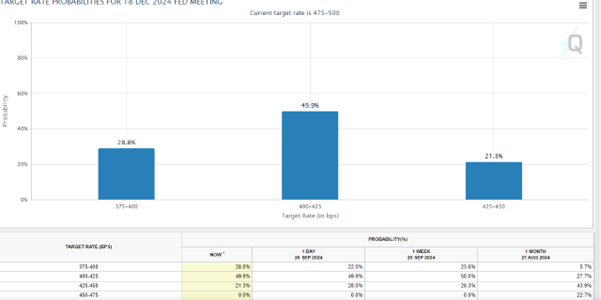
The Fed funds future market points to a rapid rate cut cycle as well. Investors are expecting the funds rate to fall another 0.75% to 1.00% by the end of the year.
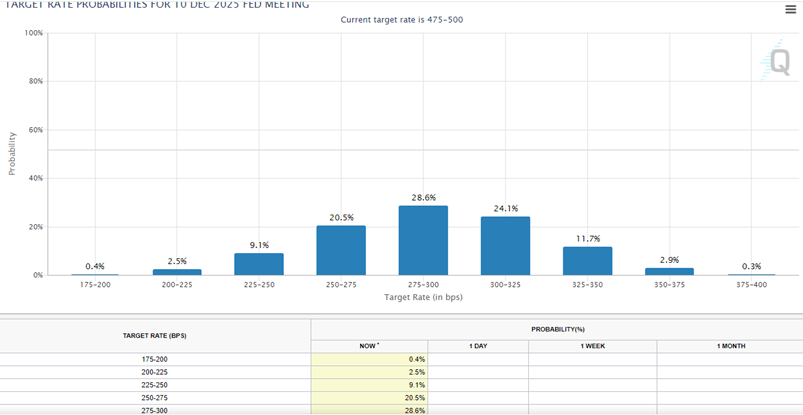
Investors see a better than 50% chance the funds rate will be at least 2.00% lower by year end 2025. (See chart below).
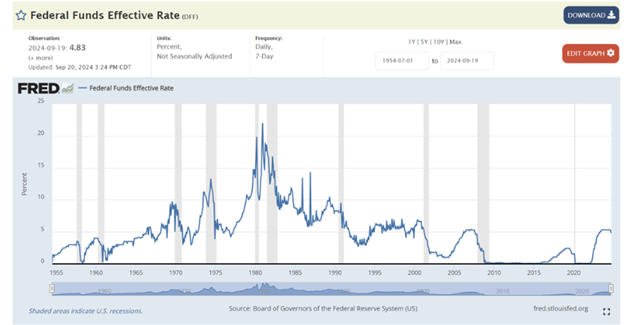
Investors are frantic to have rates drop. Yet real rates aren’t high except compared to the period following the Great Recession.
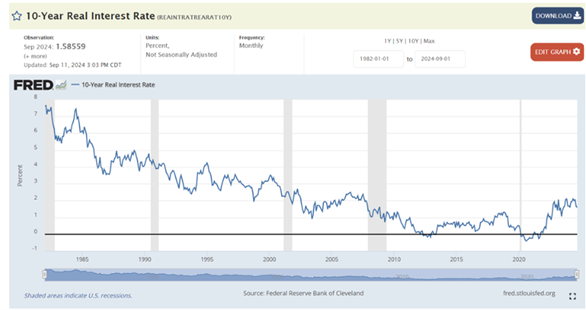
Nor is the Fed funds rate high compared to history (again excepting the Great Recession). What stands out in both the chart above and below is the extraordinarily low rates during the 2010s.
The Fed is forecasting a slower pace of cuts than bond investors. The September dot plot median forecast is for a 1.00% total cut in 2024 and another 1.00% in 2025. The futures market has the funds rate 0.50% or so lower by the finish of 2025. Of course, it’s all subject to change depending on what happens in the economy and with inflation.
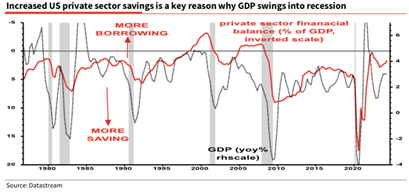
There are more signs the economy is beginning to slow. A drop in the U.S. personal saving ratio is firing off a recession alert, according to Societe Generale's Chief Global Strategist Albert Edwards. The U.S. personal saving ratio dropped to 2.9% in July. It is a “super-low” figure that’s bound to move higher, and in turn, hurt the economy, Edwards said in a note Wednesday. Edwards called July's ratio a "ticking economic timebomb."
The chart below shows borrowing (red line, left scale) rising into recessions.
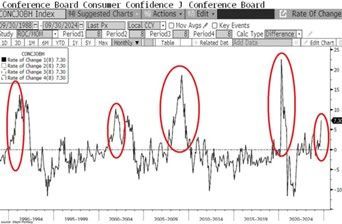
As well, the Conference Board consumer confidence report was released last week. The MarketWatch headline read, “Consumer confidence plunges on weaker job market and high cost of living.” The consumer confidence number fell to a three-month low. The September number was 98.7 down from 105.6 in August. Expectations dropped from 86.3 to 81.7 while the current conditions index dropped 10.3 points to 124.3. It’s the weakest outcome since March 2021 for current conditions. The expectations index is just above the 80 threshold that usually signals a recession.
Also troubling was the rise in the number of consumers who said jobs were hard to get. The percentage saying jobs were hard to get has risen by 7.3% over the last eight months. It is a change consistent with previous recessions since the 1980s. (See the chart below).
Investors are ecstatic about the Fed’s rate cut on 18 September. Except rate cuts have always been reactionary. The chart below from Cory Venable highlights the 50 basis point cuts since 1968.
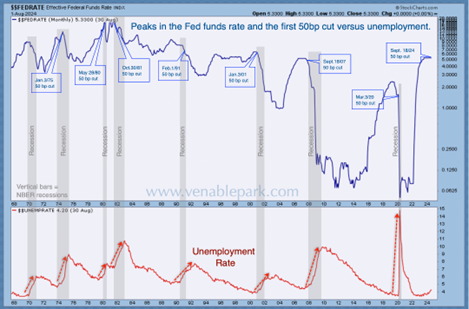
Unemployment (in red above) has risen through past cutting cycles. Recessions (grey bars above) have always started within a few months of a first 50 bp cut.
One might take comfort in the strong GDP numbers. GDP growth has averaged more than 3% over the trailing twelve-months. A recession is nowhere in sight looking at GDP growth. The chart below showing the year-over-year rate of economic change should dispel any complacency.
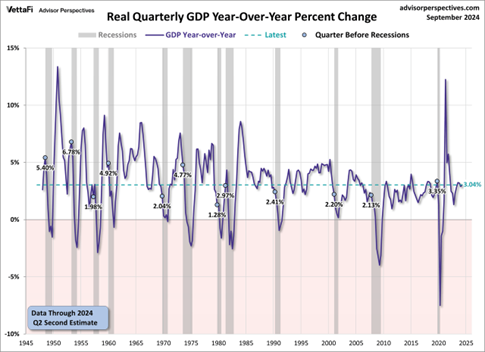
The circles highlight the GDP growth in the quarter before the start of a recession.
The average year-over-year rate of change at the start of recessions is 3.2% beginning in 1947, according to Doug Short of Advisor Perspectives. The average range is 1.28% to 6.78%. The current year-over-year rate of change for real GDP is at 3.04%, a level at or below 5 of the 12 recessions starts.
Uncertainty remains high and risk management a priority.
Don’t Forget the Dividends
I had a phone call with a client last week. He wanted to know about a few of our stock holdings and whether we intended to sell them anytime soon. One of the companies is a slow grower paying a big dividend. Many of our stocks fit that description at Norwood Economics. (Think lower risk investing). He said something to the effect that we’re back up to break even or a bit better. He followed up by asking how much longer we planned on holding the stock.
The stock in question has an 8.07% forward dividend yield currently. The client has owned the stock since 30 May 2019. We bought more for him most recently on 12 December 2023. The client owns 833 shares. The total position across two accounts represents 3.4% of his portfolio. The position has an unrealized gain of 5.34%, hardly awe-inspiring. But that isn’t the whole story.
The stock pays a hefty dividend. The dividend was $627.88 in the most recent quarter. The stock pays dividends quarterly. The $2,511.52 he’ll receive at the current dividend rate equals a yield of 8.02%. And that’s without counting on any dividend increases. In fact, the dividend has increased every year since we first bought shares for the client. The dividend in 2019 was $2.03. It is $2.97 currently. The yield has been as high as 9.91% in 2023 and as low as 6.09% in 2019. The average yield over the holding period has been 7.55%.
One must add dividends into the total return calculation when assessing performance. The client has received approximately $13.77 per share in dividends total. $13.77 divided by the cost basis generates a return of 37.4%. Adding the 5.34% increases the total return to 42.7%. Dividing by the holding period gives you an annual return of 7.9%. Nothing to brag about, but a return close to that of the stock market over the long term after adjusting for risk. Speaking of risk, the beta on this stock is 0.73, meaning it is 73% as volatile as the S&P 500. It is a consumer defensive stock with a wide moat according to Morningstar. It’s currently trading at $36.84. Morningstar has fair value at $50.00.
We have no plans to sell. Consumer defensive, 8% dividend yield, a single P/E stock trading at a 26% discount to fair value. We like the stock at the current price. We aren’t buying more currently only because it’s up over 30% since April. A pullback into the low 30s and we’d be buyers again.
Income from interest and dividends from all positions represents around 42% of gains for all clients over the last five years. Most of the income came from dividends. Capital appreciation represents the other 58%. Income represents 57% of returns over the trailing three-year period. Again most of that income came from dividends.
So don’t forget the dividends! They matter.
Regards,
Christopher R Norwood, CFA
Chief Market Strategist


