Dow Jones down for eight weeks in a row
Christopher Norwood • May 23, 2022

Recency bias leads to mistakes

Market Update

The S&P 500 fell for the seventh week in a row. It lost 3% and is down 18.7% from its all-time high. The Dow Jones Industrial Average has declined eight weeks in a row. The Dow hasn’t fallen eight weeks in a row since 1932. The Nasdaq fell 3.8% last week and is down 28.2% from its January high.


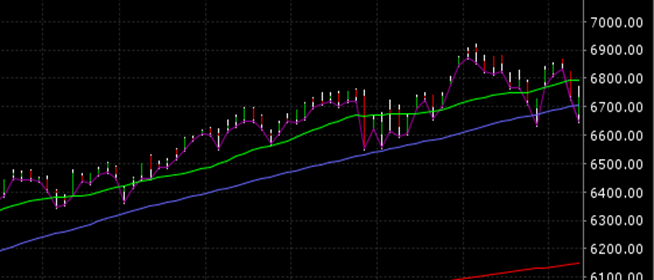
We wrote last week that the most likely path for the S&P 500 was a bear market rally back toward 4100-4200 before a retest of the 3858.87 low. The index hit 4090.72 on Tuesday before selling off. It bottomed at 3810.32 on Friday, reaching a new low and confirming the downtrend. Lower lows and lower highs are the definition of a downtrend. The 3810.32 low touched the bottom of the trading channel once again. (See chart above). The S&P rallied 2.4% in the final 2 ½ hours of trading Friday. It’s a toss-up whether the algorithms will attempt to push the index higher on Monday before another sell-off hits. Instead, investors might push the sell button from the get-go. Regardless, we will likely see a retest of the 3810.32 low sometime in the coming week.


The S&P 500 trades at 16.6 times 12-month forward earnings, down from 21.5 times in January. The index has traded for 15.5x 12-month forward earnings on average over the long run. Earnings estimates are likely too high though. Margin pressure from inflation is leading to earnings disappointments. Last week both Walmart and Target missed on earnings due to margin compression. They won’t be the only companies to miss their earnings estimates in the coming quarters.


The current consensus for 2022 earnings is $228.58, putting the S&P 500 at 17x 2022 earnings. The current consensus for 2023 is $251.06 or 15.5x earnings. Price-to-earnings multiples are reasonable once again. Earnings misses will likely lead to further selling though. Declines often take markets into undervalued territory. Earnings misses make that more likely as disappointed investors sell.


It is the madness of crowds that dictate short-term market movements, not fundamentals. By some measures, sentiment is suggesting it is time to buy. Michael Hartnett is the chief investment strategist at BofA Securities. He points out that the BofA Bull & Bear Indicator has fallen into “unambiguous contrarian territory.” But Evercore ISI strategist Julian Emanuel wants to see more signs of exhaustion, according to Barron’s. He’d like the Volatility index (VIX) to top 40. He’d also like a put-call ratio over 1.35 and a large volume day to signal the selloff is ending, Barron’s writes.


Market timing is tricky. Buy too soon and suffer heavy losses. Buy too late and miss large gains. The S&P 500 gained 39% on average following the previous losing streaks of seven weeks or more, according to Frank Cappelleri, chief market technician at Instinet. Norwood Economics recommends buying good companies on sale whenever you find them. Ignore what you think the stock market might do.


Economic Indicators

Retail sales at U.S. retailers rose 0.9% in April. Real sales rose as well after adjusting for inflation. Real sales rose 0.6%. Prior month sales were adjusted higher, rising 1.4% up from an originally reported 0.7%. Consumers account for about 70% of spending and retail sales are a big part of consumer spending. Strong real retail sales in March and April point toward a strong economy. Meanwhile, industrial production rose 1.1% in April. It rose 0.9% in March.


The leading economic indicators fell 0.3% in April after rising 0.1% in March. The LEI is a weighted gauge of 10 indicators. The index is designed to show whether the economy is getting better or worse. The leading index is in line with a moderate growth outlook in the near term, according to Ataman Ozyildirim, senior director of economic research at the Conference Board.


Recency Bias

Recency bias is one of the behavioral biases found in all of us. We are not built to make sound financial decisions. Our brain tricks us at every turn. Status quo bias is a classic example. We don’t like change. Status quo bias is the source of several well-known sayings. “A bird in the hand is worth two in the bush.” “Better the devil you know than that one you don’t. The endowment effect is another powerful bias that leads to irrational pricing. A coffee mug is worth more to you once you own it. It is the same $10 coffee mug but now it is your coffee mug.


Recency bias is placing too much importance on events that are more recent. Recency bias can cause 401(k) participants to make poor choices. I’ve had a number of 401(k) participants ask me recently if they should stop deferring into their 401(k) since the market is falling. “What’s the point of putting money into my account when it’s just disappearing?” one participant asked me last week. “I should stop my deferrals,” he went on to say. “I’d be better off putting my money into a savings account than my 401(k),” another told me. “I’ll have more money when I retire since I won’t be losing it in the market,” they said.


Wrong! Wrong! Wrong! The S&P 500 rose by double digits three years in a row before 2022. Investors made a lot of money. The S&P finished 2018 at 2531.94. It is up 54% since then even after the 18% decline in 2022. Perhaps the S&P falls all the way to 3,000 during the current downtrend as some strategists are forecasting. Even then an investor will have earned 18.5% plus dividends since December 31st, 2018. Let's call it 24.5% including dividends. Divide 24.5% by four and you get 6.1% annually, far more than you can earn in a savings account.


Furthermore, the S&P 500 will be trading for around 12 times 2023 forecast earnings if it ends 2022 at 3,000. Cut the $251 current earnings estimate by 20% and the S&P would still be trading at only 15x earnings if it falls to 3,000 by year-end. The likelihood of earning double digits in the stock market from 3,000 over the following several years would be high. Perhaps it takes three years to regain the 4818 all-time high. A 60% gain over three years is 20% per annum. A 401(k)participant would be deferring and buying stocks the entire time. Their 401(k) account would grow to a personal all-time high sooner than 2025. We’ll ignore that though and stick with 4818 in the S&P by 2025. Your total return from December 31st, 2018, until December 31st, 2025, would be about 100%, including dividends but ignoring additional earnings from additional savings. A 100% gain over a seven-year period is 14.3% per annum. Try to earn that in a savings account!


Regards,


Christopher R Norwood, CFA


Chief Market Strategist


By Christopher Norwood November 17, 2025
Executive Summary The S&P 500 was flat last week The U.S. government is once again open for business Markets thrive when liquidity rises GDP grows faster when the government spends more The odds that the Fed will cut a quarter-point on December 10th fell to 45.8% The S&P 500 is a concentrated index, heavily weighted toward technology Diversification reduces risk without necessarily reducing return Deciding when to take Social Security is about maximizing your benefit (A quick note this week due to travel on my part. You’ll find a variety of comments about last week’s market and events that may impact the stock and bond markets. Also, some thoughts on conversations with clients.) The S&P 500 was flat last week and is testing its 50-day moving average again (purple line below). We may see a down week this week. A fall below November 7th’s low of 6631.44 would likely lead to a further drop. A lower high and lower low would be in place, the definition of a down trend.
By Christopher Norwood November 10, 2025
Executive Summary The S&P 500 fell 1.6% last week to close at 6,728.8 There was a widespread sell-off in the Tech space The Nasdaq Composite had its worst week since the week ending April 4th The jobs market is a concern for the Federal Reserve Data is scarce, but the jobs market seems steady U.S. services sector economic activity picked up in October A diversified portfolio is more important for risk management than ever The S&P 500 fell 1.6% last week to close at 6,728.8. The Nasdaq 100 fell 3.1% on the week. The declines were blamed on a report released Thursday by Challenger, Gray & Christmas, according to Barron’s. But the market fell throughout the week. The Challenger Gray report wasn't released until Thursday. The report may have helped sink the market last week, but it wasn't the lone catalyst.
By Christopher Norwood November 3, 2025
Executive Summary The S&P 500 rose 0.7% last week to finish at 6,840.20 The S&P is up 16.3% year-to-date A stock represents ownership in a business The S&P 500 is rising at an increasing rate, and that can't go on forever Profit margins have been stable over the long run The Federal Reserve cut the Fed funds rate by one quarter point last Wednesday, but why? Inflation appears nowhere near declining to the Fed’s 2% target The annualized headline CPI September number was the second-highest since January Inflation is hurting the lowest 50% of income earners in the U.S.
By Christopher Norwood October 27, 2025
Executive Summary The S&P 500 rose 1.9% last week The Fed will cut the Fed funds rate by 0.25% this week. The funds rate is currently 4.00% to 4.25%. Financial conditions are already easy The stock market is setting new highs Gold typically does best when liquidity is abundant Gold is up 54% YTD Bond investors seem to be signaling a recession ahead Stock investors see blue skies instead The Stock Market
By Christopher Norwood October 20, 2025
Executive Summary The S&P 500 rose 1.7% last week to finish at 6664.01 The Nasdaq & the Dow Jones rose as well last week We had an inside day last Monday, then an inside week Earnings season is here The four credit events might snowball into something more serious Credit spreads have started to react, widening over the last two weeks Bond yields fell (yields down, price up) last week The dollar index is also falling The Federal Reserve has been draining excess reserves from the system since 2022 It appears as if the Fed has no choice but to end its Quantitative Tightening (QT) program The Stock Market The S&P 500 rose 1.7% last week to finish at 6664.01. The Nasdaq 100 was up 2.4% and the Dow was up around 1.5%.
By Christopher Norwood October 13, 2025
Executive Summary The S&P 500, Nasdaq & the Dow Jones fell last week President Trump tanked the market Friday with a post about trade talk troubles with China The S&P 500 still has a lot of momentum, though Bond investors aren’t expecting a recession any time soon The Atlanta Fed GDPNow tool is estimating 3.8% real GDP growth for Q3 The AI boom is increasingly dependent on circular cash flows The U.S. stock market has a lot of exposure to AI The Stock Market
By Christopher Norwood October 6, 2025
Executive Summary The S&P 500 rose 1.1% to close the week at 6715.79 The Nasdaq was down 0.3% last week The Dow Jones Industrial Average was up 1.99%. The government shutdown materialized on Wednesday The Fed is expected to cut the funds rate by another quarter point in October Unemployment isn’t rising, and consumers are still spending Recession red flags The last 18 years have been unusual A recession is not Norwood Economics’ base case
By Christopher Norwood September 29, 2025
Executive Summary The S&P 500 fell 0.3% last week to finish at 6,643.66 The Dow, Nasdaq, and Tech sector ended lower as well The S&P average annual total return is 7.9% since the 2000 market peak The economy grew 3.8% in Q2 (third estimate), up from the prior 3.3% second estimate Financial conditions remain loose The 10-year Treasury yield has little room to fall from current levels The elderly and poor suffer most from the impacts of inflation Norwood Economics manages diversified portfolios This time is NOT different The S&P might see negative returns over the next decade Economic growth is the lowest in the past 25 years There are no piles of cash sitting on the sidelines The Stock Market
By Christopher Norwood September 22, 2025
Executive Summary The S&P 500 rose 1.2% last week to finish at 6,664.36 The S&P 500 is up 13.31% year-to-date The S&P is expensive The Fed updated its “Dot Plot” The 10-year yield rose last week despite the Fed’s rate cut The Fed is signaling at least two more rate cuts by year's end A pullback of 10% or so wouldn’t be unusual, but there’s no data signaling recession yet The top ten most expensive S&P 500 companies make up over 39% of the market cap UBS economists estimate a 93% chance that the US will slip into a recession this year Investors should review their portfolios before the next bear market The Stock Market
By Christopher Norwood September 15, 2025
Executive Summary The S&P 500 rose 1.6% last week to finish at 6,584.3 The stock market rises long-term due to earnings growth and interest rates A stock is ownership in a business Investors are willing to pay more for a dollar’s worth of earnings today than in the past Profit margins are already near record highs The Volatility Index (VIX) closed the week at 14.76 The market is setting new highs The CME FedWatch tool places the odds at 100% for a rate cut Wednesday The August jobs report and last week’s jobs revision are driving rate cut expectations Cutting the fed funds rate isn’t the answer to slower job growth Higher long-term rates will negate any benefit from a rate cut The Stock Market