

- An Inverted Yield Curve has Been a Reliable Recession Indicator
- Traders Continue to Play Their Trading Games
- Push Me Pull You Market
- Signs Consumers Are Starting To Falter
Market Update/Economic Indicators
The S&P 500 rose 0.2% and closed at 5,648.40 last week. The Nasdaq 100 fell 0.7%. The 10-year Treasury Yield ended the week at 3.90%. The two-year Treasury Yield closed Friday at 3.95%. The 2yr/10yr inversion is almost history. The 3M/10Yr is still firmly inverted though. The 3mth Treasury yield closed Friday at 5.17%. The spread is still negative 1.27%, a significant inversion. The more interest rate sensitive parts of the economy are particularly impacted.
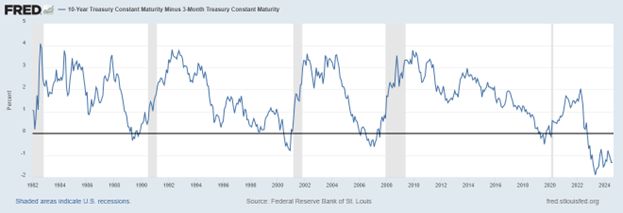
An inverted yield curve has been a reliable recession indicator. There have been 11 recessions since 1948. The 3-mth/10-yr curve inversion has predicted every recession with no false positives. The 2yr/10yr curve inversion got it wrong once. We will know in the next 12 months whether the 3mth/10yr curve has given the first ever false positive.
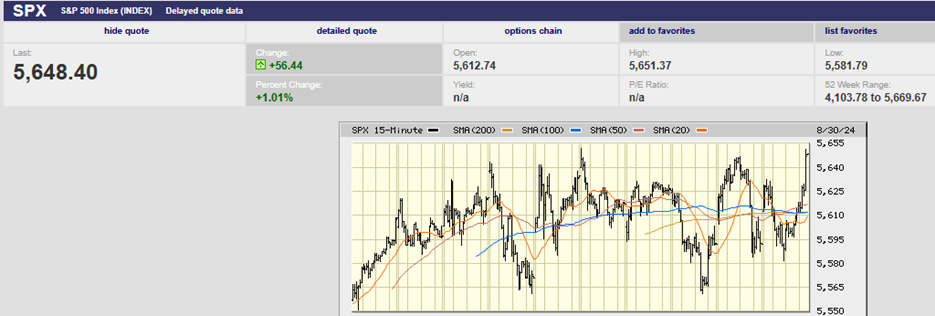
Meanwhile, traders continue to play their trading games. We wrote last week about resistance at 5,641.82 and 5,643.22, Thursday and Friday’s highs. We also wrote that traders spent last Friday trying to push above those numbers but failed. “The S&P traded sideways for 90 minutes, capped at 5,620. Buyers finally broke through and took a run at the day’s high of 5,641.82, hit in the first hour of trading. They fell a few points short of 5,640. Given the momentum in the market it’s likely that traders will try to open the market Monday on a gap up to clear resistance at 5,640. They’ll try to take out the 16 July high at 5,669.67 once they conquer 5,640.”
S&P 500 10-day Chart
The gap up open we predicted for Monday came to pass. Traders opened the market at 5,640. The index peaked at 5,651.62 in the first fifteen minutes of trading. But sellers showed up and knocked the S&P 500 down to 5,602.34 by 12:15. It was another failed attempt to restart the rally that stalled 10 trading days ago. The S&P hit a high of 5,651.62 on Monday. It hit a high on Friday of 5,651.37. Not a coincidence.
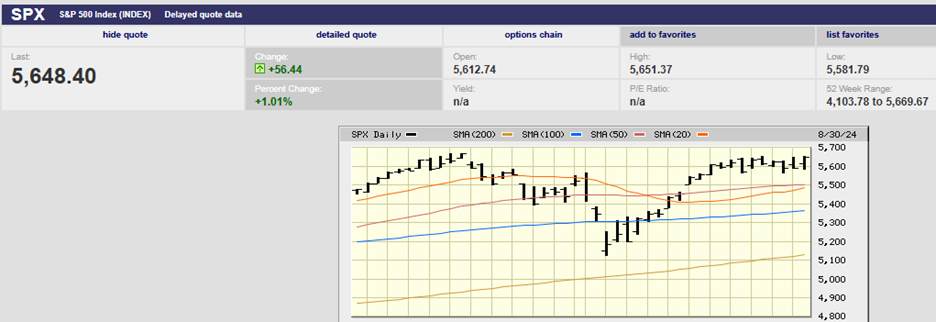
S&P 500 Two-Month Chart
Someone spiked the market in the last half hour of trading though to get there.

S&P 500 5-Day Chart
The S&P rose from 5,626 to 5,651.37 during the second to last fifteen-minute trading interval. Traders seemed to be positioning the market for another gap up open this coming Tuesday. The goal is to clear resting sell orders at the open, hoping to restart the rally that began 5 August. Traders on the long side haven't been able to clear resistance in the 5,640 - 5,669 area. Sellers are still stepping in to take profits.
The push me pull you market action continues. Markets can correct overbought conditions in time as well as price. Strong markets are more likely to trade sideways than pullback when consolidating gains. We’ve had a strong market most of the year. The explosive move off the August 5th 5,119.26 low has run out of steam for now though.
But the odds still favor a continuation of the rally after more consolidation. We may get a 3% to 5% pullback in September first. Any sustained down move is unlikely, at least until negative economic news arrives.
Which brings us to fundamentals. There appears to be a difference of opinion between bond and stock investors. There also appears to be a difference of opinion between Wall Street and Main Street.
Bond investors appear to be expecting a recession. Stock investors appear to see nothing but clear skies ahead. Bond investors are expecting cuts of 200 basis points by the Federal Reserve by year-end 2025. The cuts are expected to start in September. The Federal Reserve won’t cut the funds rate to 3.25% unless the labor market weakens significantly. Bond investors seem to believe that’s exactly what will happen. Stock investors see double-digit earnings growth in Q4 of 2024 with earnings growth of 9.5% for all 2024. They are forecasting earnings growth of 15.2% for 2025 and 12.7% for 2026. Recession? What recession?
Yet the futures market has the Fed funds rate at or below 3.25%-3.50% by year end 2025. The CME FedWatch tool has the odds at 26.4% for a funds rate of 3.00%-3.25%. The next highest odds are for 3.25%-3.50% at 24.4%. Strong earnings growth. An economy that needs 200 basis points or more of Fed cuts. It's hard to reconcile the two.
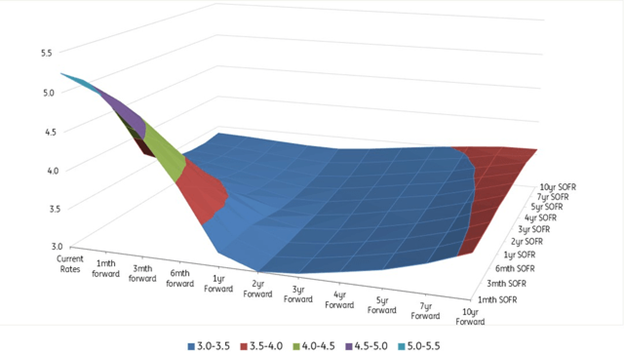
Bond investors have the entire curve out to 10 years gapping down to 3% to 3.5% in the next year. They have yields staying in the 3.0% to 3.5% range for the next five years (blue area in the chart above). What are bond investors seeing that stock investors aren't?
There are some signs that consumers are starting to falter. First, unemployment has been rising. Unemployment has risen from 3.4% to 4.3% since April 2023. Unemployment isn’t expected to keep rising though. The U.S. employment report will be released Friday. The consensus forecast is for 162,000 new jobs in August up from 114,000 in July. The unemployment rate is expected to fall to 4.2% from 4.3%. Hourly wages are expected to rise by 0.3% in August up from 0.2% in July. Hourly wages year-over-year are expected to rise by 3.8%, up from 3.6%. Hard to see the need for an interest rate cut in September should the strong labor reports come to pass on Friday (If the Fed is really data-dependent).
There is evidence that consumers are starting to falter though if you look a little more closely.
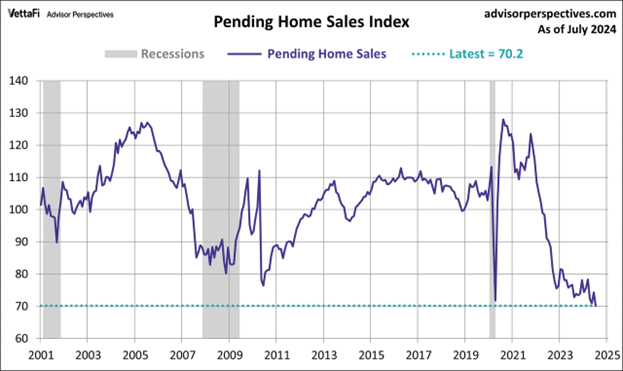
Pending home sales have fallen off a cliff in July. The National Association of Realtors (NAR) said pending home sales unexpectedly fell 5.5% in July to 70.2. It’s the lowest level in history. The index is down 8.5% from one year ago.
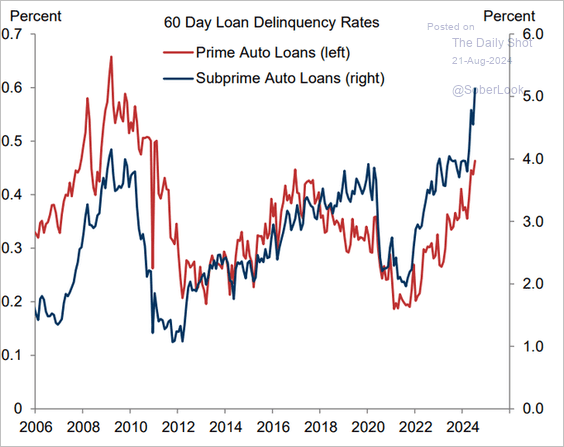
The spike in prime and subprime loans now 60 days delinquent is the worst since 2008 (below since 2006).
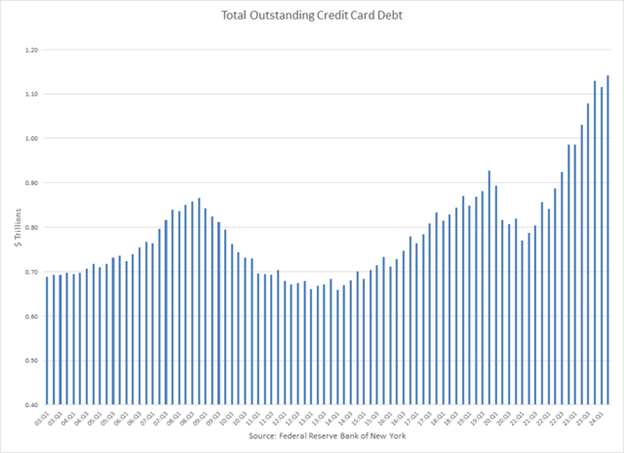
Credit card debt outstanding grew to a record $1.14 trillion as of 2Q24. In the past three years, credit card debt has increased by 48%, or an average annual rate of 14%.
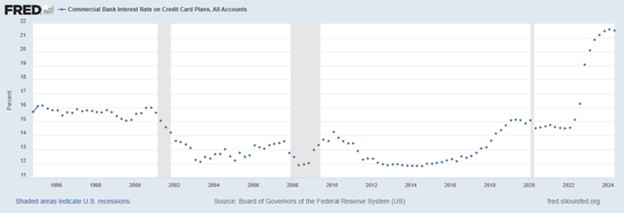
The current interest rate for all credit card accounts is 21.5%, a record high in the forty years of available data. This is up from 14.5% when the Fed began tightening in 1Q22. The Fed has raised the Fed funds rate by 525 basis points since 2022. Credit card issuers have raised rates by 700 basis points during that same period.
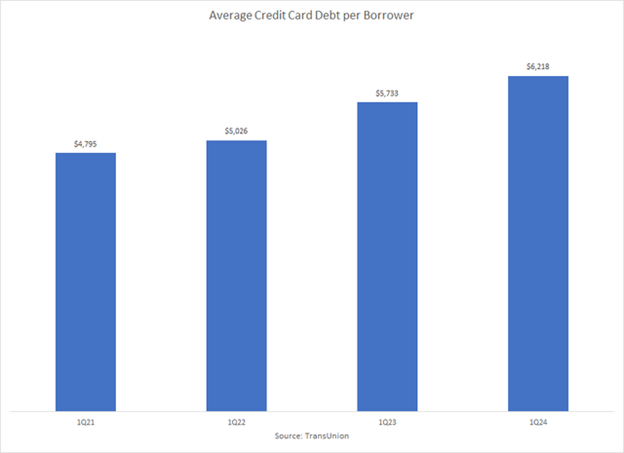
Average credit card balances are rising. Average Credit Card Debt per user rose to $6,218 in 1Q24, a 29.5% increase in three years, or an average annual gain of 9%.
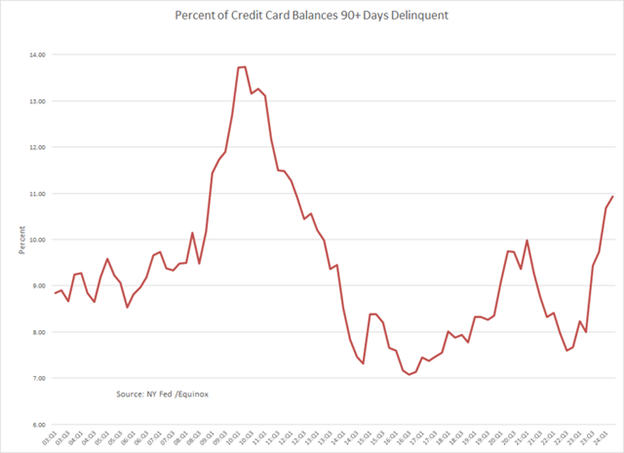
Delinquencies of 90 days or greater have risen to 10.93% of credit card balances as of 2Q24. It is the highest level in twelve years, and a 45% increase since 2Q22.
And then there is the disconnect between investor confidence and consumer confidence. The latest AAII Sentiment Survey shows bullish sentiment at 51.2%, high. The historical average is 37.5%. Bearish sentiment is 27.0% below the historical average of 31.0%.
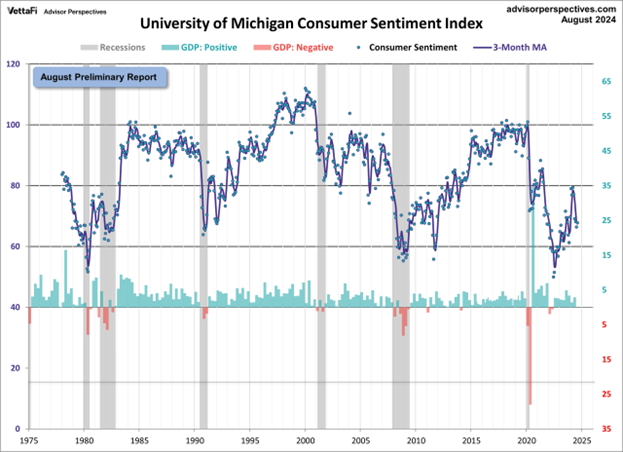
Meanwhile consumer sentiment continues to be at levels associated with recessions. The current level of 67.8 is below the index's level at the start of 5 of the 6 recessions since the index's inception. The bottom half of the chart shows real GDP.
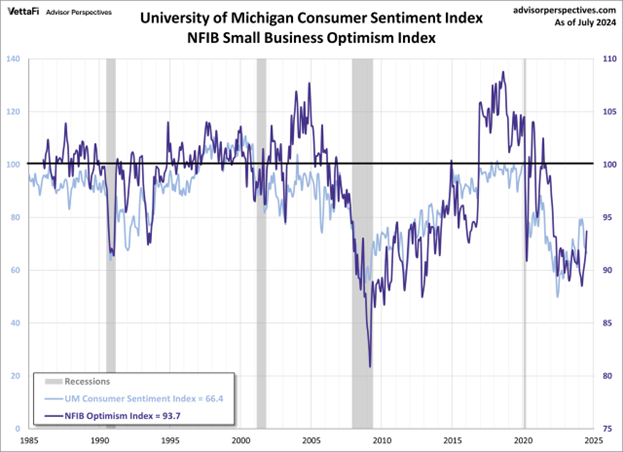
Wall Street is euphoric. Main Street and consumers are not. The National Federation of Independent Businesses (NFIB) optimism index and consumer sentiment are correlated. Both are at levels associated with recession. Conditions are bad as seen through the eyes of consumers and small business owners.
The likelihood of a recession is higher than normal. Risk management continues to be a priority.
Kids are Expensive, so is Healthcare
Norwood Economics is a wealth management firm. We help clients with financial planning. We also help them with estate planning, insurance, tax planning, and investing. We’ve found that many of our clients underestimate the cost of raising children. They also underestimate healthcare costs in retirement. The rising cost of raising children is making it harder for clients to save for retirement. The rising cost of healthcare is making it harder for clients to meet retirement spending goals.
A middle-income family earning from $73,100 to $132,600 will spend an estimated $310,605 to raise a child born in 2015 through age 17, according to the Brookings Institution. That’s over $18,000 per year. The estimate doesn’t include the cost of college tuition. Nor does it include expenses associated with launching children into early adulthood. Costs continue to rise rapidly.
Total annual expenses for families with young children have grown 35% since the mid-1980s, according to the Bureau of Labor Statistics (BLS). The average annual cost of a family health-insurance premium has risen 47% since 2013, according to the 2023 KFF Employer Health Benefits Survey. Parents reported spending 24% of their household income on child-care last year, according to Care.com’s 2024 Cost of Care Report.
And then there is healthcare in retirement.
A 65-year-old retiring today can expect to spend an average of $165,000 in healthcare expenses in retirement, according to Fidelity Investments 23rd annual Retiree Health Care Cost Estimate. It’s a 5% increase from last year. It’s also more than double the average American’s estimate of healthcare expenses in retirement, according to Fidelity.
Healthcare costs in retirement are a major spending goal. Many of our clients are unaware of how much they will spend annually on healthcare. There are important choices to be made that can impact your expenses. For instance, a major decision when signing up for Medicare is whether to choose Traditional Medicare or a Medicare Advantage plan.
Medicare Advantage plans cost less, until you get sick. Retirees with below-average health can expect to spend between 9% and 39% more than those in average health with a Medicare Advantage plan, according to Milliman, an independent health benefits firm.
Financial planning needs to include realistic healthcare cost estimates in retirement. Otherwise, spending goals are at risk. The cost of having children must be included in financial planning as well. It is an expensive decision that greatly impacts how much a couple can save for retirement.
Decisions, decisions, decisions….
Regards,
Christopher R Norwood, CFA
Chief Market Strategist


