

Expect Inflation to Stay Higher for Longer. The Government Needs Inflation.
Market Update
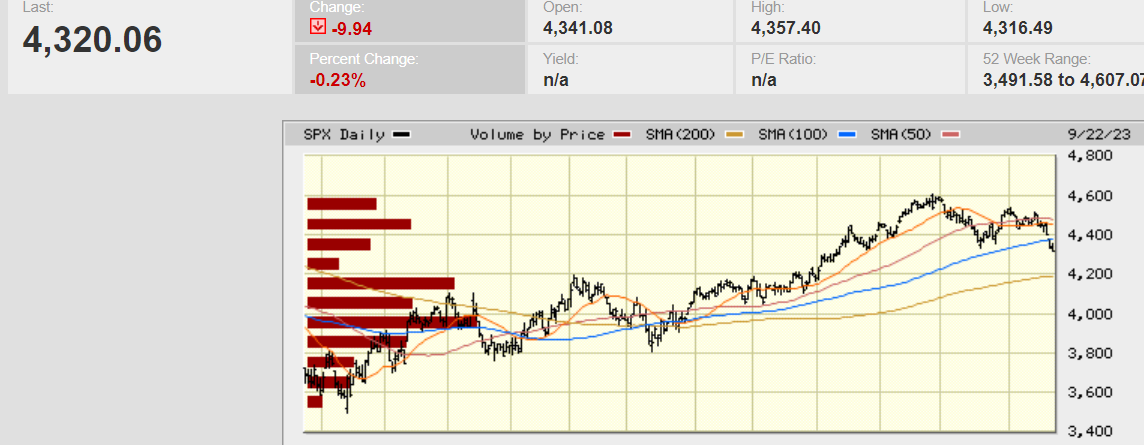
The S&P lost 2.9% last week. It closed on Friday at 4320.06. The Nasdaq fell 3.6%. It was the worst week for the indices since March. The S&P is down 10.3% since its all-time high of 4818. It hit 4818 on 4 January 2022, 21 months ago. The Nasdaq hasn't had a new high since November of 2021. The S&P is up 12.5% year-to-date. It was down 18.2% last year. The trading range action of the last almost two years is normal given the surge in prices from 2017 through 2021. It takes time for earnings to catch up to price. Whether we have a resumption of the bear market or not remains to be seen. The good news is that the equal-weighted S&P is now trading at 16x earnings. That means the average stock is no longer expensive.
We wrote last week that, “it’s possible the S&P is putting in a top. A breach of 4,335.31 would open the door for a drop to the 200-day moving average.” Thursday’s low was 4,329.17. The close on Thursday was 4,330.00. Friday’s low was 4,316.49. The 4,335.31 low reached on 18 August did not hold. Investors may rally the market back toward 4,400 in the next few days but the 200-day moving average beckons. It’s at 4,200.
Regardless, the short-term trend is now down. A lower high and lower low are in place. The algorithms will take the downtrend into account. Traders will shift to take advantage of it. (As a reminder: technical analysis is useful because people use it. A lower high and lower low triggers trading strategies that anticipate a falling market.)
Rising long-term interest rates triggered the selling last week. The Federal Reserve held the funds rate steady at 5.25%-5.50%. That was expected. The change in the Summary of Economic Projections (SEP) was not expected. The Fed funds futures market was pricing in four quarter-point rate cuts for 2024 before the release of the SEP. The updated SEP indicates the Fed expects one more rate hike in 2023. It also indicates only two rate cuts in 2024. Long-term Treasury yields responded by rising. The 10-year Treasury topped 4.5% briefly before settling Friday at 4.438%. The 4.5% yield was a 16-year high.
Stocks haven’t had competition for investor dollars since before the Great Recession. Now they do. The S&P is trading at 18.5x the next 12 months earnings. Estimates are for low double-digit growth. Any earnings growth at all is unlikely if recession visits in 2024. Still, the stock market is expensive even if earnings meet forecasts over the next 12 months. The long-term average price-to-earnings is closer to 15.5. Stocks would need to fall to around 3,600 to return to an average valuation level. For more than a decade the excuse for high stock prices has been low bond yields. The 10-year Treasury yield hit an all-time low of 0.318% in 2020. It is now 4.438%. The long-run equity risk premium is around 3.0% to 3.5%. Stocks would need to have an earnings yield of around 7.5% to match the average equity risk premium. That equity yield equates to a price-to-earnings ratio of 13.3. The S&P would need to fall to 3,100 for the risk premium to return to something close to average. Or bond yields would need to fall.
The thing is that bond yields aren’t particularly high compared to the long-term average. In fact, a 4.5% 10-year Treasury yield represents the long-term average for U.S. government debt. It’s been the average yield going back to 1790 according to Jim Reid of Deutsche Bank. Reid is head of global fundamental credit strategy.
Ten-year Treasury yields might go higher over the next six months. The fed-funds rate and the 10-year Treasury have tended to peak around the same level, according to Jawad Mian. Mian is the managing editor of Stray Reflections, an independent global macro research and trading advisory firm. The 10-year yield would need to rise to around 5.5% if it’s going to peak around the same level as the funds rate this time. That would be painful for bond investors who’ve already suffered heavy losses the last 2 ½ years. When yields rise bond prices fall. It would also be painful for stock investors. It’s hard to imagine the stock market would hold up if the 10-year yield were to rise another 100 basis points. Uncertainty remains high and risk management remains a priority.
Economic Indicators
The big news last week came out of the Fed meeting. The Fed didn’t hike but it did confirm that rates were expected to be higher for longer. The September SEP maintained a 5.6% mid-point for the federal funds rate, signaling another rate hike in 2023. The updated SEP also signaled two rate cuts in 2024 rather than four. Stock investors didn’t react well.
The Consumer Conference Board Leading Economic Indicators (LEI) index fell for the 17th month in a row. The index dropped 0.4% in August following a decline of 0.3% in July. The index is down 3.8% over the six-month period between February and August 2023. It was down 3.9% over the previous six-month period. The Conference Board is expecting a recession by year-end. The coincident economic indicator (CEI) isn’t showing recession yet though. It rose by 0.2% in August and 0.3% in July. The CEI is up 0.8% over the six-month period between February and August 2023. It rose 0.5% in the previous six-month period.
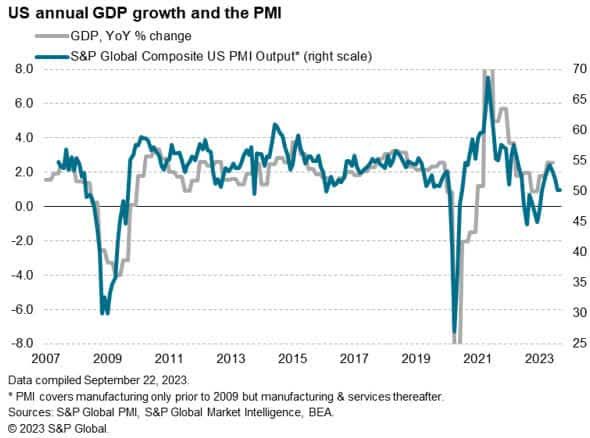
The S&P flash U.S. services PMI fell to 50.2 in September from 50.5 the prior month. The U.S. manufacturing PMI rose to 48.9 in September from 47.9 the prior month. The PMI indicators point to a slowing economy. Companies reported that demand is suffering from the increased cost of living and higher interest rates. Service sector growth has slowed as a result. Manufacturing remains in contraction. New orders for goods fell for a fifth consecutive month. Backlogs fell in September as well. New orders are a leading indicator.
The economy is slowing. Inflation is as well although not fast enough for the Fed’s liking. Recession should arrive in the next two to three quarters.
Inflation and Retirement
I had two meetings last week in which clients asked the same question. What does inflation mean for our retirement? The second client also asked a follow-up question. How will our portfolio hold up in an inflationary environment?
Inflation threatens purchasing power. It is a general rise in prices, which includes wages. No harm, no foul if wage growth matches the inflation rate. Retirees don’t have wages, unfortunately. Social Security has a cost-of-living feature but cost-of-living adjustments lag. Also, they don’t always make up for the entire rise in prices. Tracking inflation is not a precise undertaking after all.
A stock portfolio can offset expected inflation over time. Corporations have pricing power. They can raise prices to offset the increase in input costs, thus preserving profits. Some companies have more pricing power than others. Inelastic demand for necessary services and goods allows companies to offset the impact of inflation in its entirety. Think of essential goods and services such as food and electricity. Other companies sell products and services that consumers avoid if prices are rising too fast. Think restaurants and luxury goods.
The types of stocks you own when inflation hits are important. Consumer defensive, utilities, and health care will hold up better than consumer discretionary. Interest rates rise when inflation rises. Growth stocks underperform value stocks in a rising interest rate environment. The Nasdaq fell 32% in 2022 as interest rates rose. Future earnings are worth less as interest rates rise. Low-price-to-earnings stocks will do better in an inflationary environment. Dividend-paying stocks will do better as well. Cash given to shareholders today is worth more than cash given a year from now.
So what does inflation mean for your retirement? It means that your spending goals will be harder to meet all else equal. It means owning more dividend paying value stocks and fewer bonds and growth stocks. You are more likely to preserve purchasing power if you do.
Norwood Economics is forecasting inflation between 3% and 6% in the foreseeable future. There could well be periods in which inflation drops below 3% for a time. But the government needs higher inflation. The tremendous debt taken on since the Great Recession can't be repaid otherwise. At the same time, the government can’t afford to pay high-interest rates on that debt.
Interest on the debt is set to skyrocket in the next few years as debt rolls over. The government knows the clock is ticking. Expect interest rates to come down soon and further than is warranted by inflation. Own low-price-to-earnings stocks that pay above-average dividends. Those stocks will serve as a better hedge against inflation than high price-to-earnings stocks or bonds.
Regards,
Christopher R Norwood, CFA
Chief Market Strategist


