

- S&P Needs to Climb to a New All-time High to Prevent a Sell-off
- A Decreased Reserve balance decreases the Margin balance lowering Equity values
- Value Investing Requires Patience
S&P 500 5-Day Chart
Market Update
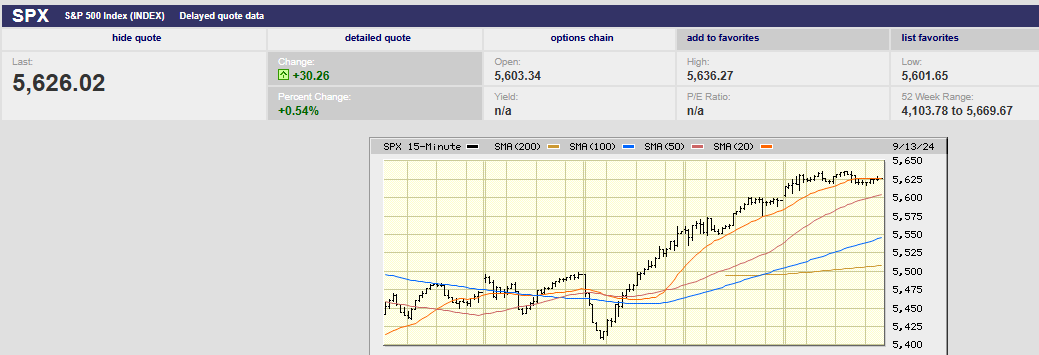
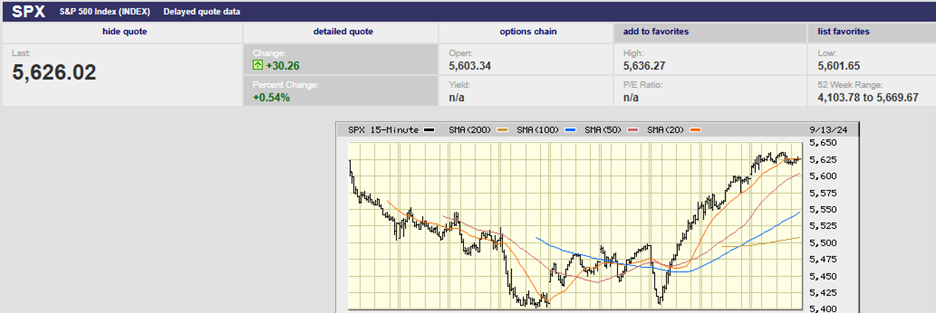
The S&P 500 climbed 4.1% last week to finish at 5,628.74. The index rose every day. It even rose on Wednesday, despite a 1.6% sell-off in the morning. The index swung 2.8% from low to high Wednesday. It fell to 5,406.96, bounced off the 100-day moving average and then powered higher. The low a week ago Friday was 5,402.62.
S&P 500 10-Day Chart
The Nasdaq composite rose 5.9% and the Dow rose 2.8% last week. Meanwhile, the 10-year Treasury yield fell to 3.66% and the two-year Treasury yield fell to 3.62%. The 3-month Treasury yield dropped to 4.90% from more than 5% the week prior. The bond market is pricing in a rate cut. The futures market shows a 50% chance of a quarter-point cut. It also shows a 50% chance of a half-point cut. A toss-up. Importantly, the futures market shows a 100% chance of a cut. Investors are excited that the Fed is finally ready to start a rate-cut cycle.
The initial selling in the S&P 500 on Wednesday was blamed on a stronger-than-expected core CPI report. Barron’s provided a weak explanation for the reversal. It wrote that the CPI report triggered the morning sell-off. Barron's also wrote that the sell-off turned into a rally as “investors bet it (the CPI report) was still weak enough for at least a quarter-point rate cut.” Basically, Barron’s is claiming that investors hated the CPI report for the first two-and-half hours following its release. And then changed their minds. Doesn't say much for the Efficient Market Hypothesis, does it?
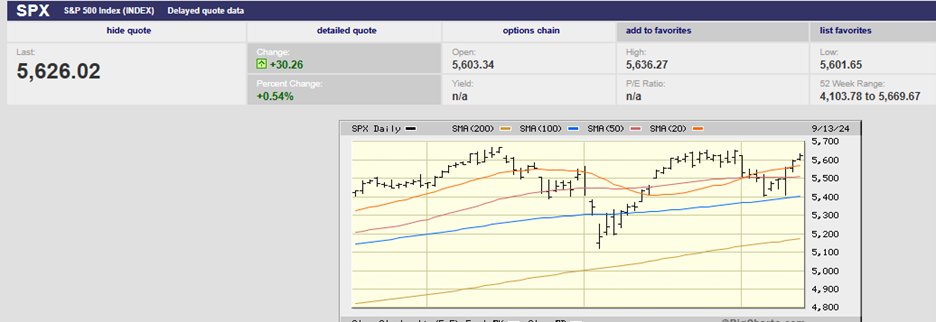
S&P 500 3-Month Chart
More likely, traders had buy orders waiting near Friday’s low and the 100-day moving average. Traders likely also had sell-stop loss orders placed below the 100-day moving average. The selling likely would’ve intensified had the index broken through support as stop loss sell orders triggered. The next downside targets would’ve been the 200-day at 5,190 and the August 5th low at 5,119.26. But the 100-day held, sparking a buying frenzy that pushed the S&P as high as 5,560.41 Wednesday.
It is doubtful fundamentals had anything to do with Wednesday’s action. After all, the futures market’s estimate of a rate cut never meaningfully shifted Wednesday morning after the CPI report. What’s more the CME FedWatch tool is now showing a 33.2% chance of the fed funds rate finishing the year at 4.25%. It shows a 41.3% chance of the fed funds rate finishing the year at 4.0%. The latter would be a drop of 1.25% in the funds rate in only three months.
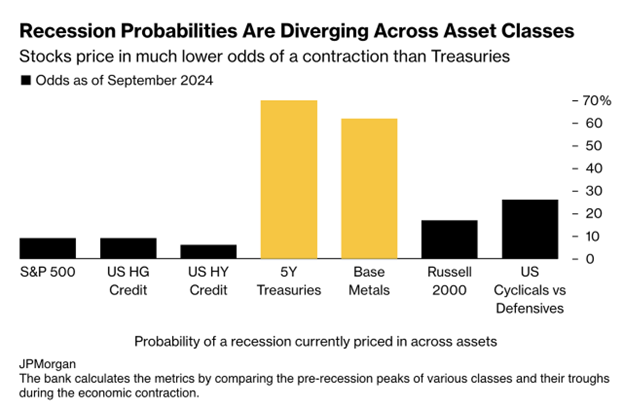
Bonds and Fed funds futures are pricing in higher odds of a recession than stocks. Earnings growth will likely turn into earnings declines if the economy slides into recession.
Earnings growth estimates of 14% for next year are overly optimistic even without a recession, according to investment bank Roth MKM. Michael Darda, chief economist and market strategist for Roth MKM, pointed out recently that analysts' 12-month earnings forecasts tend to be about 30% too high at cycle peaks. Peaks are typically near the time the Fed starts lowering the fed funds rate. Darda also points out that the 14% earnings growth estimate for next year hasn’t changed despite “leading indicators for earnings and capital spending pointing south.” Darda noted that “inflation and inflation expectations have fallen sharply, suggesting weakening in topline growth and corporate pricing power.” “Recession or no recession, 14% earnings growth seems to be quite a stretch against the backdrop of slowing inflation, falling inflation expectations, and a Fed that is likely falling behind the neutral rate curve,” Darda concluded in the Tuesday note.
Back to last week’s stock market…
The buying continued Thursday and Friday, although Friday was a sideways day. The S&P 500 peaked around 1:30 at 5,636.27. The July 16th high of 5,669.67 beckons. The S&P is coming to a juncture. It needs to climb to a new all-time high soon. Otherwise, repeated failures to do so will lead to profit-taking. Another failed attempt to break through to a new all-time high could result in a more severe sell-off. Investors will want to protect profits, especially as the year winds down.
There are technical warning signs. Volume has been declining during this last advance. The Relative Strength Index (RSI) shows a negative divergence as well. Also, investors are heavily allocated toward stocks already. It begs the question of who’s left to buy. Bank of America notes that its private clients hold about 63% of their portfolios in equities. That is up from around 60% earlier this year and above the long-term average of 56%, according to Barron’s. Historically, the mid-60s is where the bank’s clients stop increasing their stock market exposure.
Traders are likely to be on a hair trigger if the S&P fails yet again to set a new high in the next few weeks. Wednesday’s Fed announcement could well be a buy-the-rumor (of a rate cut) and sell-the-news event. Expect volatility to pick up in the next few weeks as the Fed begins to cut.
There is another reason to expect volatility to rise between now and the end of the quarter. And it has little to do with earnings.
Liquidity drives the stock market in the short term. And liquidity might dry up over the next few weeks because of changes in the Fed’s reverse repurchase facility* and the Treasury’s General Account. Neither impact stock market fundamentals, but both can impact stock prices. That’s because seasonal movements in the Fed’s repo facility and the Treasury’s General Account can lead to declining bank reserve balances held at the Fed. The decline in bank reserves could lead to a deterioration in market liquidity, according to Mott Capital.
How does it work? Well, The Treasury General Account will likely rise due to the collection of quarterly taxes due September 16th. The Treasury General Account is a liability on the Fed's balance sheet. When the TGA rises, it draws down excess bank reserves held at the Fed. Also, The Fed’s reverse repo facility is a liability on the Fed’s balance sheet. Bank reserve balances held at the Fed fall as use of the reverse repo facility rises around quarter end. Mott Capital estimates that total reserve balances could fall by as much as $300 billion over the final two weeks of September. Why should we care?
Because changes in the reserve balance are linked to changes in the margin balance in the equity market. Margin balances have increased when reserve balances have increased. That leads to more liquidity in the market and higher asset prices. When reserves have fallen, margin balances have declined, leading to lower equity values.
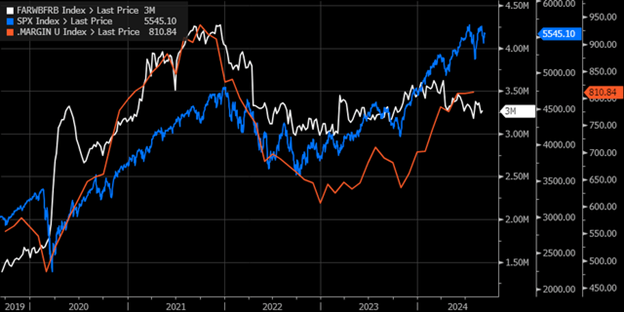
Reserve balances are the white line in the chart above.
Stock market movements in the short term aren’t always about earnings and interest rates. Changes in excess reserve balances held at the Fed can cause volatility to rise and asset prices to move without any changes in economic forecasts. We may see a couple of rough weeks in the stock market as liquidity dries up. It would be a buying opportunity for long-term value investors like us.
*The Overnight Reverse Repo Facility (ON RRP) helps provide a floor under overnight interest rates by acting as an alternative investment for a broad base of money market investors when rates fall below the interest on reserve balances (IORB) rate.
Economic Indicators
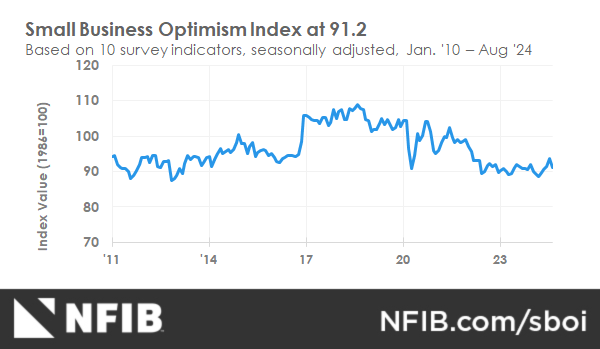
The NFIB Optimism Index was released Monday. It fell by 2.5 points in August to 91.2, erasing all July’s gains. It is the 32nd consecutive month below the 50-year average of 98. The Uncertainty Index rose to 92, its highest level since October 2020. Inflation remains the top issue among small business owners. 24% of owners reported it as their top small business operating issue, down one point from July.
“The mood on Main Street worsened in August, despite last month’s gains,” said NFIB Chief Economist Bill Dunkelberg. “High inflation remains the top issue for owners as sales expectations plummet and cost pressures increase. Uncertainty among small business owners continues to rise. Expectations for future business conditions continue to worsen.”
Main Street continues to be far more pessimistic than Wall Street.
The CPI report Wednesday had core CPI at 0.3% against a forecast of 0.2%. The 12-month increase in the core rate was unchanged at 3.2%. The core PPI report came out Thursday. Core PPI increased by 0.3% against a forecast of 0.2%.
The Fed’s preferred super core inflation measure rose 0.33% in the most recent report. The measure excludes shelter from core services. It is significantly driven by wage costs. The super core inflation measure increased 0.2% in the prior month. The annual super core figure is flat at 4.5% in August. Meanwhile, average hourly earnings rose by 0.4% month-on-month and 3.8% year-on-year. It was above expectations.
The Fed’s preferred inflation measure for conducting monetary policy is the trimmed mean Personal Consumption Expenditure index (PCE). The one-month PCE inflation annual rate is 1.7%. The six-month PCE inflation annual rate is 2.4%. The 12-month PCE inflation annual rate is 2.7%. It’s time to cut.
A tail risk though is rising inflation in 2025. Services inflation and wage increases point to that possibility. It’s 100% likely the Fed will cut this week. It's far less certain whether the Fed will cut the funds rate by 1.25% by year-end 2025, let alone by year-end 2024.
Stock Picking
Norwood Economics buys individual stocks for its clients. We are value investors seeking to buy good companies on sale. A good company is one that is profitable. It has a long operating history and is available at a discount to its average P/B, P/S, P/CF and dividend yield. We buy good companies when we think we can earn an acceptable risk-adjusted return. Our time horizon is a three-to-five-year period.
A new Morningstar study has confirmed what Dalbar Research has reported for the last 25 years. People aren't good at trading. They aren't good at timing. The more active investors are the worse they do. The Morningstar study shows that investors underperform by 1.9% per year due to bad trading with mutual funds. The leakage is even worse with investors who use ETFs. The underperformance averages 3.1%. Trading too much isn't good. Yet most investors and financial advisors still do it. Jack Bogle of Vanguard fame was often quoted as saying, "Don't just stand there, do nothing."
I met with a client a few weeks ago who was unhappy that we are trailing our benchmark over the last year. He wasn’t consoled at all by the fact that we were handily beating our benchmark over the three- and five-year periods. I told him that we could shift our goal to relative outperformance over shorter periods of time. I also told him that would require us to have a shorter time horizon and to make more decisions. I let him know that we might track the overall market more closely most of the time. I also let him know we'd likely give up much of the alpha (excess risk adjusted return) that we have captured over longer periods of time.
That is because we can’t time the market, which means we aren’t able to time the buying and selling of individual stocks. We can identify undervalued businesses, buy them, and wait for the market to recognize its mistake. We have been able to earn reasonable risk-adjusted returns over longer periods with our approach.
Value investing adds around 4.3% to returns over the very long term. But returns are lumpy. A stock might go nowhere for a year or two before the market notices its mistake. Value investing requires patience. Value investing tends to be less volatile. Portfolios tend to hold up better during bear markets. There’s a lot to recommend value investing. But it takes a contrarian streak. And again, it takes patience.
Regards,
Christopher R Norwood, CFA
Chief Market Strategist


