

S&P ready to challenge 5,000
Economic data was strong last week

Market Update
The S&P 500 index gained 1.4% last week to finish at 4,958.61. The Dow Jones Industrial Average was up 1.4% also. The Nasdaq lagged, rising 1.1% for the week. The 10-year Treasury bond ended the week yielding 4.02%. The two-year yield finished Friday at 4.40%.
The stock market continues to rise even though interest rates remain above 4%. The real interest rate is at 1.8%. (It was negative before the Fed started hiking.) The Fed has indicated that the neutral rate is around 0.5%. Translation: money is expensive.
The yield curve remains inverted, putting a strain on the banking system. The New York Community Bank’s (NYCB) announcement last week of a sharp jump in credit-loss provisions caused a sell-off in bank stocks Wednesday. NYCB is a large commercial real estate (CRE) lender. CRE is a potential catalyst for a credit crunch with many loans due in 2024 and 2025. NYCB’s announcement is evidence that the Fed rate hikes are still working their way through the economy. The Fed dropped the phrase the “U.S. banking system is sound and resilient”, from its post-meeting statement. Perhaps they did so in response to NYCB's announcement.
The economy is growing strongly. The Atlanta Fed GDPNow estimate for Q1 2024 is 4.2%. The U.S. economy grew 2.5% in 2023, above trend. Unemployment is at 3.7%, near 50-year lows. The jobs report Friday was strong, clocking in at 353,000, above the 185,000
forecasted. U.S. hourly wages jumped 0.6% in January, above the 0.3% forecast and faster than the 0.4% increase the prior month.
Investors are now expecting five rate cuts in 2024. The Fed’s dot plot indicates three. Fewer rate cuts seem more likely given the strength of the economy.
The S&P is ready to challenge 5,000. It’s a big round number that shouldn’t have any particular significance. Yet humans are human. We aren’t always rational. There’s a reason why the Dow flirted with 1,000 for 17 years. The Dow climbed over 1,000 for part of a day on several occasions in 1966. It wasn’t until 14 November 1972 that the Dow closed above 1,000. It fell back below shortly after, not crossing the 1,000 mark for good until 1982. Big round numbers matter to investors. It’s unlikely that it will take 17 years to cross 5,000 for good. It is possible that the index will hang around 5,000 for a while though.
It’s also likely that the stock market will underperform over the next decade. Trading above 20x 12-month forward earnings almost ensures it. The S&P is at 4,958. Twelve-month forward earnings are estimated at $242, putting the P/E at 20.5x. The long-run average is around 16x earnings. Valuations aren’t good for timing. Valuations are good for predicting decade-long returns.
How expensive is the S&P? There are 41 companies in the S&P 500 trading above 10x sales. There are 131 companies (26% of the S&P) trading above 5x sales. The S&P 500 average price-to-sales is currently 2.69x. Companies trading above 10x sales include Microsoft, Nvidia, Adobe, Visa, Mastercard, Lilly, and AMD.
Scott McNealy, then CEO of Sun Microsystems, made some comments about stocks trading at 10x sales back in 1999. He pointed out that...
At 10 times revenues, to give you a 10-year payback, I must pay you 100% of revenues for 10 straight years in dividends. To do that requires zero cost of goods sold, zero expenses, no taxes, zero R&D expense, and investors paying zero taxes on dividends. It also assumes maintaining the current revenue run rate. McNealy went on to ask, “Do you realize how ridiculous those basic assumptions are?”
Yet there are cheap companies in the S&P 500. Many of those 493 stocks that were left behind last year represent good value this year. The S&P is up 3.96% year-to-date. But much of the advance is due to that same handful of stocks that powered the S&P higher last year. Meta Platforms (Facebook) soared 20% last week and was responsible for 40% of the S&P 500’s gain. The rest of the market had a mediocre week. There were 271 stocks that finished higher on the week and 231 that finished lower. The Invesco S&P 500 Equal Weight ETF was unchanged. Almost half the stocks in the S&P 500 are down for the year.
It's going to be a stock picker’s market this year. It’s going to be a back-and-forth market this year. It’s going to be an interesting investing year given a slowing economy and a Federal Reserve poised to start cutting interest rates by the summer… maybe.
Economic Indicators
The economic news was strong last week. The jobs number was twice what economists had forecast. The economy created 353,000 jobs in January. The two preceding months were revised 126,000 jobs higher. Unemployment remained at 3.7%. Unemployment hasn’t been above 4% since December 2021. Average hourly earnings jumped by 0.6% in January. Earnings were 4.5% higher year-over-year.
True, there was a decline in the work week to 34.1 hours, down 0.2 hours. But J.P. Morgan Chief U.S. Economist Michael Feroli wrote that the shorter workweek was due to bad weather not a lack of demand for workers. Job openings rose to 9 million from 8.9 million.
Consumer confidence rose to a two-year high, climbing to 114.8 from 108.0. The increase was due to slower inflation, a strong stock market, and strong economic growth, according to the Conference Board. Meanwhile, the Employment cost index rose 0.9%, its slowest pace in 2 ½ years. Prior to the most recent reading, the ECI had climbed 1% or more for 10 straight quarters. It was the longest stretch above 1% since the 1980s.
The economic data out last week weakened the case for Fed rate cuts. The Fed likely won’t begin cutting rates until June or later. Two to three cuts are a more likely count than the five cuts currently forecast by the futures market.
Diversification and Correlation
My younger brother reached out last week with some data on the correlation between the Russell 2000 and S&P 500. He noted that the correlation between the two has been running around 0.9 the last 20 years or so. He wanted to know if small caps provided enough diversification to warrant inclusion in his portfolio.
Correlation is the relationship between two or more things. It isn’t causation but does help us understand how one thing moves in relation to another thing. For instance, there is a clear correlation between recessions and property crimes. Building a mean variance-efficient portfolio should be every investor’s goal. Why take more risk than necessary to earn the targeted rate of return? Adding some types of investments can reduce portfolio volatility without reducing return. That’s a good thing. As well, an investor can target a higher rate of return for the same amount of risk. Also, a good thing.
Below is my answer to my brother’s questions about small-cap stocks, correlation, and diversification:
“Small caps are cheap compared to large caps currently. That said, gold and long-term Treasuries have much lower correlations with the S&P 500. Gold/S&P is 0.25. Long Treasuries/S&P is 0.20. You'll give up some return by reducing stock exposure. But your risk-adjusted return will rise by adding gold and long Treasuries to your portfolio."
A correlation of 0.9 is high. Small-cap stocks don't add much diversification. Better to use Treasuries and gold to reduce portfolio volatility. But there is another reason to own small caps.
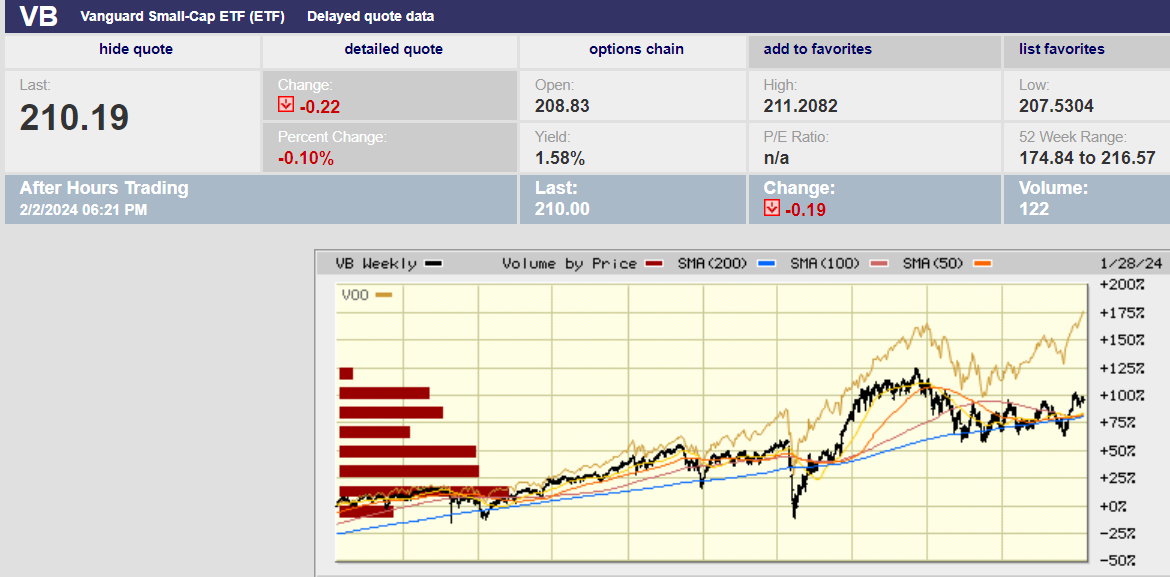
Large-cap has outperformed small-cap over the last decade
Tan line is large-cap, black line is small-cap
Small caps are inexpensive compared to large-cap stocks. We wrote a month or so ago that small caps are as cheap as they’ve ever been relative to large-cap stocks. Large-cap U.S. stocks have returned 75% more than U.S. small-cap stocks over the last decade. They’ve returned around 40% more than small caps over the last five years. It isn’t supposed to work that way.
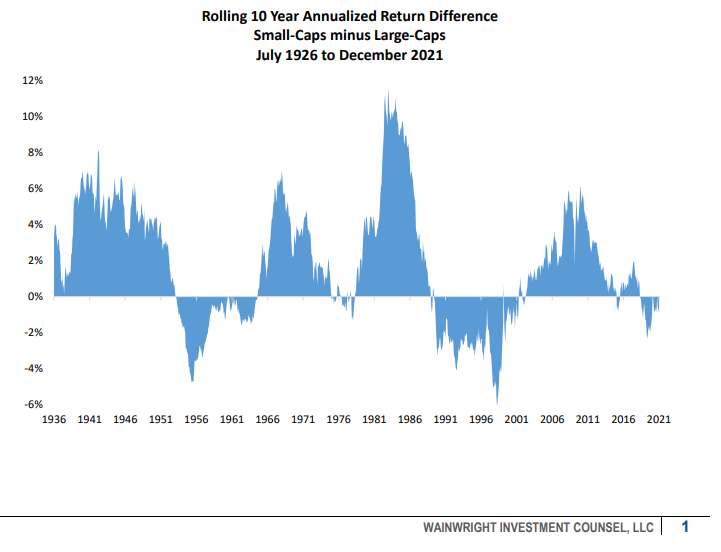
Small-cap stocks are more risky than large-cap stocks. They should return more to compensate investors for taking more risk. They haven’t over the last decade. They have over the last almost 100 years though. Small-cap stocks have an annualized return of 12.4% from July 1926 through December 2021. Large-cap stocks have returned 11.0% during that period.
Large-cap stocks have been on a tear since the Great Recession. The Federal Reserve’s massive liquidity pump has inflated assets everywhere, particularly large-cap stocks. Quantitative easing and ZIRP have distorted the normal relationship between large and small-cap stocks. Investors needed to put all that liquidity to work and large-cap stocks were the easiest way to do it. Small-cap stocks should play catch up to large-cap stocks over the next decade as the impacts of QE and ZIRP fade.
As for diversification, investors need exposure to Treasury bonds and gold if they want to create mean-variance efficient portfolios (the most return for any given level of risk). Treasury bonds and gold have low correlations to stocks and are effective in reducing portfolio volatility. How much exposure to Treasuries and gold an investor wants depends on an investor’s targeted return. And that depends on an investor’s spending goals.
Regards,
Christopher R Norwood, CFA
Chief Market Strategist


