

Investment Pros expect the stock market to be plus or minus 5% on the year
Investment Pros also predict a stock pickers market in 2024
Market Update
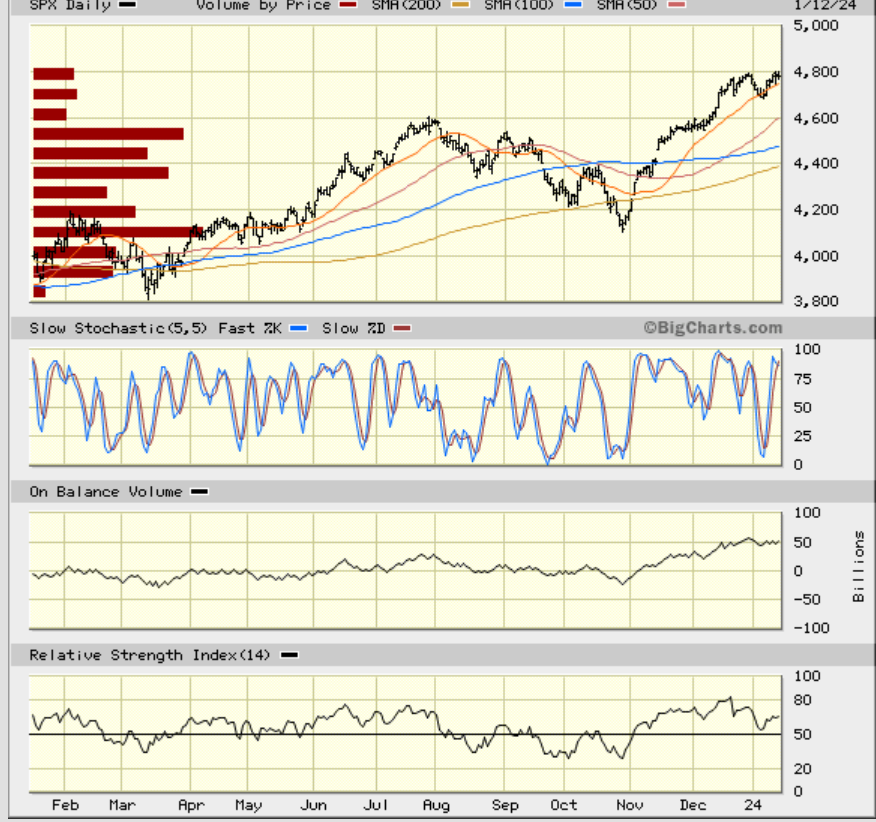
The S&P 500 rose 1.8% last week. The Nasdaq rose 3.1%. Apple climbed 3% to recover some of the 6% it lost in the first week of trading. The 10-year Treasury yield fell to 3.94% from 4.04% the week prior. The S&P is still struggling to climb and maintain above 4,800. It hit a high of 4,778.01 on 20 December. It followed with highs of 4,772.94, 4,784.72, 4,785.39, 4,793.30, and 4,788.43 over five consecutive trading days starting on 22 December. Last week the S&P hit highs of 4,790.80, 4,798.50, and 4,802.40 in the last three trading days of the week before closing at 4,783.83 on Friday. Sellers are still selling in the high 4,700s. Buyers near the highs are sitting on losses.
Corrections can take place in time as well as price. It’s possible the S&P is working off its overbought condition by chopping sideways. A pullback in price isn't necessary and doesn't always happen. It’s also possible that the algorithms will trigger profit taking before much longer. Investors get antsy when the market stops trending higher. Eventually, they start locking in profits.
The technicals are flashing some warning signs. There is a negative divergence with the relative strength indicator (RSI). The slow stochastic is rolling over. Also, earnings weren’t well received on Friday. Many reporting companies saw their stocks fall despite good earnings reports. Earnings reports that spark selling are never a good sign
Don’t be surprised if the S&P begins a pullback in the coming week. The index is sitting on top of the 20-day moving average. It may give way. A break below the moving average would be a red flag. It increases the odds of a more substantial decline occurring. A decline below 4,682.11 would be an even bigger red flag. The index hit that support on 5 January after four days of selling. Failing to hold the support at 4,682.11 this time opens the door to more selling and a test of support at 4,600. The 50-day moving average is at 4,600.
The fundamental picture is muddied. Earnings season is here. Several of the big banks reported Friday, along with a couple of airline companies. Most saw their stocks decline. JP Morgan, Bank of America, and Wells Fargo all declined in Friday trading. Delta and United lost big. But overall, earnings are expected to grow in Q4 by 1.6%, according to Barron's. That follows earnings growth of 4.9% for Q3 2023. Earnings are expected to grow strongly in 2024, rising more than 11.5%. The risk of earnings disappointing in both Q4 and 2024 is high.
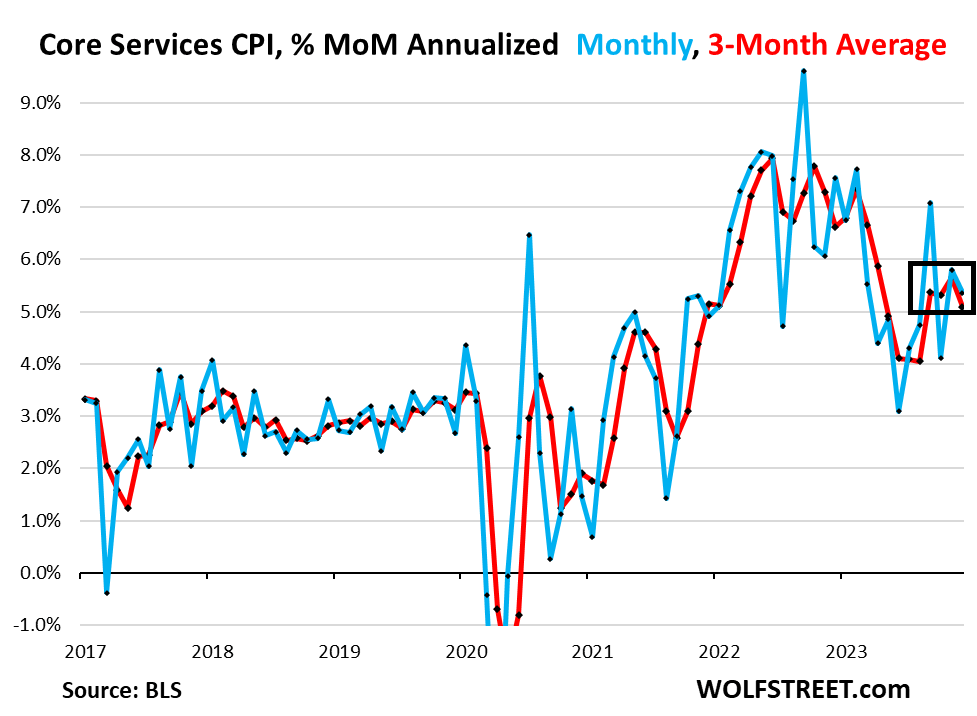
And inflation doesn’t appear to be cooperating. There are warning signs that it won’t continue to fall to 2%. The CPI increased by 0.3% last month, a tenth of a point above expectations. Prices were up 3.4% on a year-over-year basis. The headline number rose 3.1% in November. Core inflation rose 3.9%. The so-called super core CPI, which is CPI core services less housing, was 3.9% in December, flat with November. Super core inflation has risen at an annualized rate of 4.54% over the last six months. It’s risen by 4.3% over the last three months. Both numbers are a faster rise than over the last year. Chairman Powell says the super core services less housing number is important. That number isn't falling. It may even be rising. A rising number doesn't bode well for aggressive interest rate cuts in 2024. Nor does the fact that inflation is above the unemployment rate.
There is also a disagreement between the bond market and the Fed when it comes to interest rate cuts. The bond market expects six cuts. The Fed expects three. The bond market believes the first cut will be in March. The Fed doesn't. The Fed has only cut rates five times in the past 90 years when the core CPI was growing faster than the unemployment rate. Core CPI is growing 3.9% and the unemployment rate is 3.7% currently. The odds are that the Fed doesn't start cutting until the unemployment rate rises above core CPI.
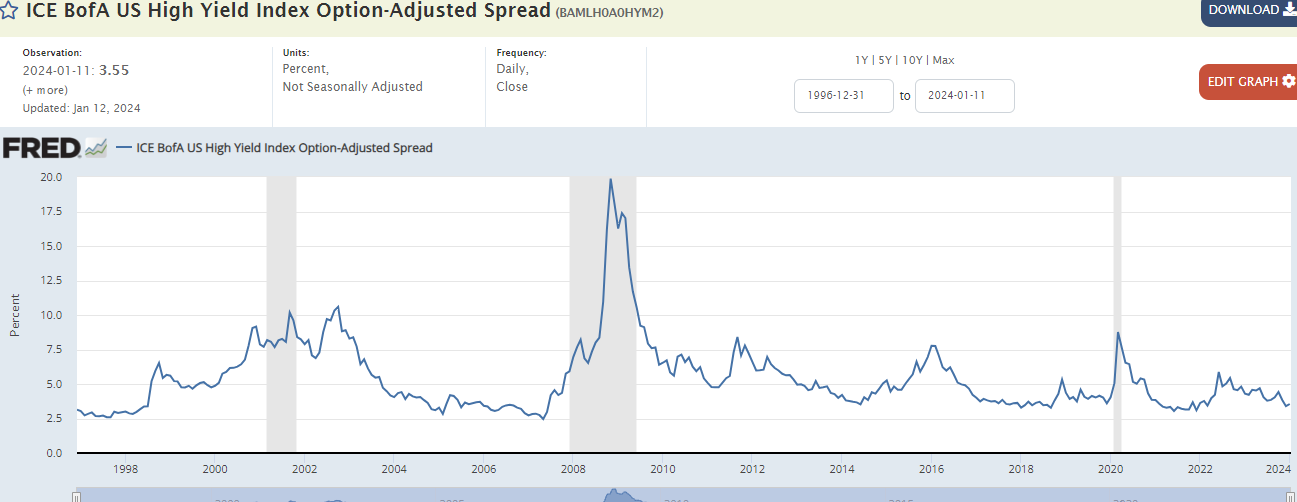
The inflation data doesn’t support the bond market’s view that the Fed will cut rates six times in 2024, beginning in March. The bond market is sending an inconsistent message as well. Six cuts for a total of 1.5% isn’t likely without accompanying economic distress. Yet the ICE BofA US High Yield Index spread is not widening. The high-yield credit market is showing no signs of stress. In fact, the spread is only 3.55%, near 10-year lows. It's true that the spread has jumped from 3.34% on 29 December to Friday’s 3.55%, but the long run average is around 5.5%. The spread will widen when leveraged companies begin to struggle to refinance. The spread can reach 10.00% or more during a recession. It peaked at 8.77% in March of 2020. It peaked at 19.88% during the Great Recession. High-yield investors aren't anticipating any problems with the high-yield market, at least not yet. Debt refinancing will increase this year. Leveraged companies may find it difficult to roll debt that's coming due in 2024. The ICE BofA index will provide an early warning if they do.
The bond market is wrong one way or another. Six cuts totaling 1.50% as the economy slips into recession. A widening of the ICE BofA index spread as companies struggle to refinance. Or fewer interest rate cuts later in the year as the economy remains strong. Continued tight high-yield spreads as corporate cash flows allow for debt refinancing. It must be one or the other. What it is unlikely to be is six rate cuts and continued tight credit spreads. Those two realities are in conflict.
One clue about the course of interest rates in 2024 stems from bankruptcy filings. There was a surge in filings in 2023. Filings rose by 18%, according to Reuters. Bankruptcy case counts are expected to keep climbing in 2024. The rise in bankruptcy filings suggests more rate cuts than the Fed anticipates. It also suggests widening credit spreads.
The weight of the fundamental and technical evidence points towards a pullback. It may have already begun. It is possible we’ll see a 10% to 15% decline by the spring. Much will depend on the Q4 earnings season and the path of inflation over the next few months.
It is a higher-than-normal risk environment. Risk management remains paramount.
Economic Indicators
Initial jobless claims clocked in at a low 202,000. Jobless claims were 223,000 the prior week. Cleveland Fed President Loretta Mester gave an interview Thursday on Bloomberg. She made it clear that March is probably too early for a rate cut. She added that the December CPI data shows that the Fed has more work to do.
Core PPI rose 0.2% in December. It rose 0.1% the prior month. PPI leads CPI. The PPI numbers have been encouraging, having fallen for three months in a row. A weak PPI often foreshadows a mild reading in the PCE index. The PCE index is the Fed’s preferred inflation gauge for conducting monetary policy. The cost of wholesale services was flat in December. Wholesale services inflation has been running hotter than wholesale goods inflation. The core PPI over the last year rose by 2.5% up from 2.4%.
The Barron’s RoundTable
Barron’s gathers investment professionals together every January for a discussion of the capital markets. I’ve been reading the Barron’s RoundTable editions for some 40 years. It’s a three-part article with the first part focused mostly on the pros' big picture outlook. One thing I’ve learned over the last four decades is that the pros often disagree with one another. But of course, that’s what makes a market.
The consensus this year is that interest rates will come down, but not necessarily by much. The panelists don’t see a big year ahead for the U.S. stock market. Plus, or minus 5% was the general view. Their main worry is that stocks are too richly valued. They believe there is little margin for error. That should sound familiar to readers of this newsletter. The S&P is trading at over 20x 12-month forward earnings. Robust earnings growth is forecast for 2024. The market has priced in strong earnings in 2024 already. Investors will likely sell if earnings don’t meet lofty expectations. The consensus is for 11.5% earnings growth in 2024 and 12.5% in 2025.
The pros pointed at a slew of potential issues that could impact the markets in 2024. The list included trade wars, China, politics, the possibility of a hard landing, and the huge and growing public debt.
One bond specialist sees the 10-year yield rising back toward 4.50% before ending the year around 4.0%. She points to the “enormously loose” debt financed fiscal policy as a major problem. The large issuance of Treasury bonds to pay for the spending puts upward pressure on interest rates. A 10-year Treasury yield above 4% would likely negatively impact both the economy and the stock market.
Many of the panelists at the RoundTable this year felt it would be a stock pickers market. Of course, most of these investment pros say that every year.
Regards,
Christopher R Norwood, CFA
Chief Market Strategist


