

This is a subtitle for your new post The Federal Reserve is Uncertain. What to do next?
Investors Hate Uncertainty.
Market Update
The S&P 500 rose 0.8% last week to finish at 4,405.71. The gain ended a three-week losing streak. The S&P 500 is down 4.4% from its 27 July peak. It is down 8.6% from its all-time high set on 4 January 2022. The Nasdaq gained 2.3% last week. It is down 10.9% from its all-time high in November 2021. The Dow finished the week down 0.5%.
Support for the S&P 500 is at 4300, says Frank Cappelleri, founder of CappThesis. The 100-day moving average is there. The S&P also spent five days in early June trying to break above that level before succeeding. Also, the S&P has formed a small head and shoulders top with the neckline around 4,330. The neckline provides support but also indicates further downside if broken. The distance between the head and neckline indicates the size of the potential decline. The distance is 277, which would take the S&P to around 4,053 if the neckline breaks, a decline of 12% from the 2023 high.
Additionally, the 20-day moving average is crossing the 50-day moving average. The cross also indicates more downside testing is likely short-term. Cappelleri says the next support is the 200-day moving average around 4135. The S&P will have lost 11% from its 2023 peak if it retraces back to its 200-day. Technical analysis is useful because so many traders use it. Support and resistance become reality because traders believe those levels are support and resistance. A self-fulfilling prophecy.
The big fundamental news came out of Jackson Hole on Friday. Federal Reserve Chairman Jerome Powell gave a morning speech that surprised no one. The stock and bond market were steady as she goes. Powell reiterated that the Fed would remain data dependent. He didn’t commit to any specific way forward, according to Barron’s. He left the door open to more interest rate hikes but didn’t say when or how much. In fact, the speech was notable for its vagueness. The 15-minute speech, “was extraordinarily vague on the policy outlook and raised more questions than it provided answers,” wrote Stephan Stanley, chief U.S. economist with Santander. He went on to write, “I believe that this accurately encapsulates the Federal Open Market Committee’s current thinking.”
In other words, the Fed doesn’t know what it will do with the funds rate the rest of the year. The CME FedWatch tool indicates an 80% probability the Fed will hold in September. The FedWatch tool shows a 55.6% probability the funds rate will move to 5.50% or higher in November. It shows a 44.5% probability of the rate staying at 5.25%. The probabilities remain the same for the December meeting. So, no hike in September and a coin flip for the rest of the year. Uncertainty breeds volatility and the Fed came across as uncertain at Jackson Hole. Expect volatility.
The uncertainty stems from differing points of view among FOMC members. For instance, Powell suggested Friday that housing inflation will decline. He expects it to return to pre-pandemic levels, although he didn't give a time frame. Housing is a large part of the current inflation rate. Meanwhile, Fed governors Christopher Wall and Michelle Bowman have raised concerns that long-awaited relief in housing costs could be short-lived. We will see who's right in the coming months.
Long-term rates have been rising. The 10-year Treasury yield peaked at 4.34% in mid-August, its highest level since November 2007. The 10-year is at 4.24% as of Friday. The 30-year yield is at 4.28%, it is near its highest since 2011. Higher long-term rates mean the bond market doesn’t believe financial conditions are tight enough to slow the economy. The Atlanta Fed’s GDPNow forecast for Q3 supports the bond market’s view. The GDPNow tool has Q3 GDP growing by 5.9% as of 24 August. That is up from 5.8% the prior week and a sharp acceleration from Q2’s 2.4%.
Rising interest rates and a Fed holding or hiking will create a headwind for stocks. An accelerating economy will provide a tailwind. The uncertainty coming out of Jackson Hole does nothing to help stock investors. The Fed's uncertainty leads to investor uncertainty. Investors hate uncertainty. They often react to uncertainty by selling both to lock in profits and reduce risk. Risk management amid higher-than-normal uncertainty remains paramount.
Economic Indicators
The economic data is showing some weakness, at odds with the Atlanta Fed’s GDPNow tool. The S&P flash U.S. services PMI declined to 51.0 in August from 52.3 the prior month. The S&P flash U.S. manufacturing PMI declined to 47.0 from 49.0. A number below 50 indicates contraction. The manufacturing economy continues in recession. The larger service economy continues to grow but is slowing. The LEI is pointing to recession. The Consumer Conference Board is forecasting a mild recession by year-end. The flash indexes seem to support its forecast.
Durable goods orders declined by 5.2% in July after rising 4.4% the prior month. Existing home sales were weaker than expected at 4.07 million in July. The forecast was for 4.15 million, down from 4.16 million the prior month. New home sales rose to 714,000 in July from 684,000 in June. It's possible people are choosing to stay put because of the rise in mortgage rates. Homeowners hanging onto low mortgage rates would crimp existing home sales. Builders can provide incentives to sell new homes. It'll be interesting to see if incentives impact homebuilders' earnings later this year.
There is a slew of economic data coming out this week. The JOLTS report is out Tuesday. Job openings are expected to fall to 9.45 million from 9.58 million in June. Wednesday brings the ADP jobs report. Economists are forecasting 198,000 jobs created in August. The ADP data showed 324,000 jobs created in July. Thursday the PCE report is expected to show a 4.2% y/y increase, up from a 4.1% increase in June. Friday’s jobs report is expected to come in at 150,000 jobs created, down from 172,000 in July. The unemployment rate is expected to hold steady at 3.5%, a 50-year low. The ISM manufacturing index is expected to show an increase from 46.4 to 47 with prices paid rising to 44 from 42.6. Stronger than expected data will lead to higher long-term interest rates and falling stocks.
Interest Rates, Credit Risk, and Recessions
Bankruptcies are rising. Around 400 hundred companies have filed so far in 2023. The ICE BofA High Yield Option Adjusted Spread index isn’t showing much concern though. The spread closed Friday at 3.91%. The spread averages closer to 5.5%. Spread widening is a leading indicator of economic stress. It is a leading indicator of stock market stress for that matter. Yet the jump in bankruptcy filings in 2023 hasn’t led to spread widening. At least not yet.
Bankruptcies are not the only sign of financial stress. Moody’s 12-month trailing default rate for high yield bonds rose to 3.8% in the second quarter, according to Barron’s. The default rate rose from 1.4% a year ago. Moody’s forecasts that defaults will rise to 5.8% in the first quarter of 2024. The ratings firm has warned that defaults could rise as high as 15% if economic conditions worsen.
It’s unusual to experience a significant rise in default rates when the economy is strong. Torsten Slok, chief economist at Apollo Global Management, noted last week that data shows default rates normally don’t accelerate until a recession starts. And they don't peak until after it has ended. “Imagine where we will be once unemployment begins to move higher,” he wrote.
The high-yield bond market is overvalued. Jeffrey Elswick of Frost Advisors points out that BB-rated bonds are trading only 2.5% over U.S. Treasuries. The average spread over the past two decades is almost 4%. Double B bonds are the first level of high yield. Around 40% of Russell 2000 companies have negative earnings. Many of those companies have high yield debt and will struggle to refinance it. Rising interest rates and negative earnings are a bad mix. Rising defaults would hit stocks as well. The next six to twelve months could see more defaults and bankruptcies. Another headwind for the stock market.
Debt Bomb
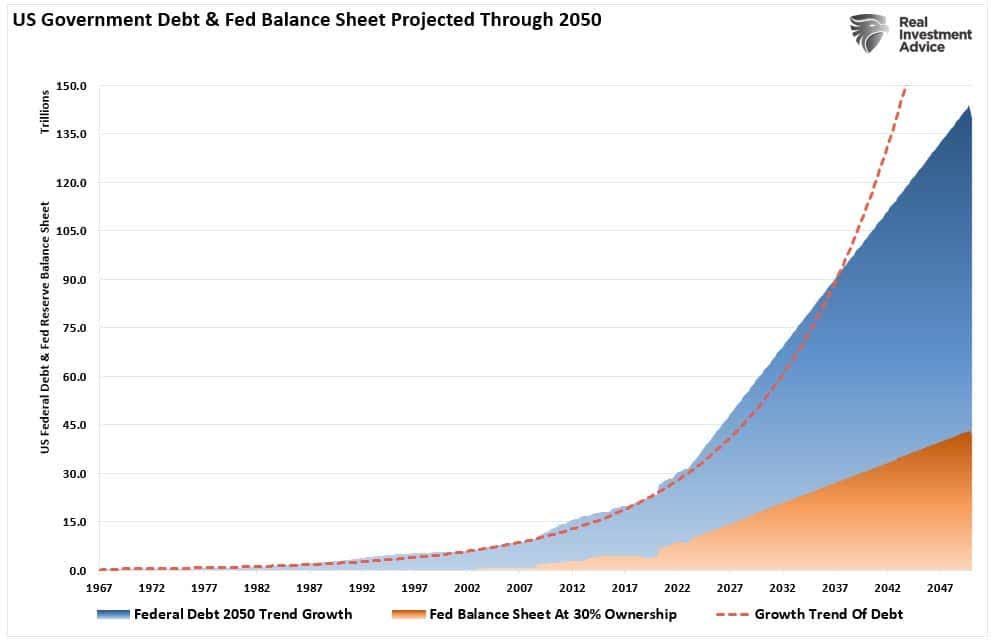
Debt has exploded since the Great Recession. The deficit ran $1.4 trillion in 2022. It is forecast to hit $1.6 trillion in 2023. The economy is around $24 trillion. The 2023 deficit will amount to 6.6% of GDP. The spending is unsustainable since debt can’t continue to grow faster than GDP forever.
At the current growth rate, the Federal debt load will climb from $32 trillion to about $140 trillion by 2050. The Fed's balance sheet will swell to $40 trillion if it continues to monetize 30% of debt issuance. The economy also will be around $40 trillion. Stop and let those numbers sink in for a minute. They just don’t work, and something will have to give. Norwood Economics believes the government will use a combination of higher inflation and lower interest rates to reduce the debt burden. It did exactly that after WWII.
Regards,
Christopher R Norwood, CFA
Chief Market Strategist


