Traders selling the S&P; Norwood still expects a 10% to 15% S&P pullback
Christopher Norwood • February 14, 2022

Earning a reasonable risk-adjusted return in a market of stocks

Market Update

The S&P 500 lost 1.8% last week to finish at 4419. The Nasdaq lost 2.2% on the week. It is now down about 12% on the year. The S&P 500 is down 7.3%. The Russell 1000 index is down 7.45% on the year while the Russell 1000 Value index is only down 2.48%. The Russell 1000 Growth index is down 12.02% on the year.


(The Russell 1000 index is a large-cap U.S. index used as a benchmark by many mutual fund managers instead of the S&P 500.)

Value continues to outperform growth. Technology stocks continue to struggle. The Select Sector Technology SPDR ETF (XLK) is down 10.92% on the year. What worked so well over the last five years isn’t working now. The S&P looks as if it will test the 4222.62 low set 24 January. The index began an oversold bounce on the 24th, peaking at 4595.31 on 2 February. It consolidated for four trading days before taking a run at the 4595.31 February 2nd high. It failed at 4590.03 on Wednesday. It failed again at 4588.92 on Thursday. Two failures were enough for traders to start selling.


Yes, the media is blaming Thursday’s and Friday’s selling on the inflation number and Russia. No, those aren’t the real reasons. Almost all short-term market movements are the result of technical factors. Fundamentals only matter over the long run. The S&P was running into selling at 4590 so traders pivoted and joined in the selling. It really is as simple as that.


A short-term double top is in place and the S&P 500 has closed below its 200-day moving average again. The most likely short-term direction is down with a retest of the 4222.62 low likely in the next week or two. Conditions are right for a full-blown correction. It’s anyone’s guess whether that’s what we are experiencing now. Investors shouldn’t be surprised if the selling in the S&P 500 continues though.


Interest rates continue to move higher. The 2-year Treasury finished the week at 1.55%. The 10-year ended the week at 1.94% and the 30-year at 2.26%. The yield curve continues to flatten. The flattening yield curve is getting frequent mention, more than it deserves. The 3-month T-bill is yielding 0.37%. The spread between it and the 10-year Treasury is 1.57% and it is that spread which is relevant. The New York Fed uses the 10 yr – 3 mth spread in its model to predict recessions two to six quarters ahead. The current 1.56% spread is above the year-ago spread of 1.11%. In other words, the yield curve is steeper than a year ago.


Norwood Economics continues to expect a 10% to 15% pullback in the S&P 500. We do not think a bear market is in the cards for 2022. Nor is a recession likely until the second half of 2023 at the earliest.


Economic Indicator

Inflation remains at the highest level since 1981. The NFIB Small Business Association’s latest survey shows small business raising average prices more than any time since 1974. Inflation was reported as the single biggest problem by 22% of owners responding to the survey. The small business optimism index fell from 98.9 to 97.1 in January. The CPI rose 7.5% year-over-year. The core CPI which excludes food and energy rose 6.0%.


High and rising inflation explains poor consumer sentiment readings. The University of Michigan consumer sentiment index dropped to 61.7 from 67.2. Consumer sentiment has fallen 19.7% from last February. The impact of higher inflation on personal finances was cited by one-third of consumers, according to the survey. Nearly half of consumers expect declines in their inflation-adjusted incomes. The sharp drop in consumer sentiment is at levels that have signaled an impending recession in the past.


An Inefficient Market

The stock market is not efficient. The Efficient Market Hypothesis does not withstand the data. There is no rational explanation for the S&P 500’s price in late 1999 and early 2000. It was trading at a price that ensured no returns for a decade, which is exactly what happened. Furthermore, there were half a dozen metrics in 2000 predicting the negative 10-year return. Few chose to believe those metrics. The S&P 500 subsequently returned zero from March of 2000 until the middle of 2013.


The same metrics are forecasting a low single-digit return for the next decade. A low single-digit return for the stock market does not necessarily mean a low single-digit return for your stock portfolio. Avoiding expensive stocks and buying the cheap stocks can allow an investor to earn a reasonable risk-adjusted return. It is a market of stocks not a stock market. The Efficient Market Hypothesis does not withstand scrutiny for the stock market. Logically, it does not withstand scrutiny for individual stocks either.


AT&T is a case in point. The stock traded between 24.06 and 26.98 on 26 January. AT&T fell 10.8% from high to low that day. The media claimed the volatility was due to comments made by CEO John Stankey. Yet, Stankey said nothing that wasn’t already well known. I’ve read dozens of articles analyzing the spin-off of Time/Warner and its merger with Discovery. A spin-off rather than a split-off was always almost a certainty. Split-offs are rare in any case. The dividend cut was well telegraphed also and had been known by the market for many months.


Nothing about the trading on 26 January indicated an efficient market. Clearly many AT&T investors were caught by surprise on the 26th. And that despite the information being in the public domain for months.


Norwood Economics buys good companies on sale. Companies go on sale because the stock market is manifestly not efficient. Thank goodness for that!


Regards,


Christopher R Norwood, CFA


Chief Market Strategist


By Christopher Norwood October 20, 2025
Executive Summary The S&P 500 rose 1.7% last week to finish at 6664.01 The Nasdaq & the Dow Jones rose as well last week We had an inside day last Monday, then an inside week Earnings season is here The four credit events might snowball into something more serious Credit spreads have started to react, widening over the last two weeks Bond yields fell (yields down, price up) last week The dollar index is also falling The Federal Reserve has been draining excess reserves from the system since 2022 It appears as if the Fed has no choice but to end its Quantitative Tightening (QT) program The Stock Market The S&P 500 rose 1.7% last week to finish at 6664.01. The Nasdaq 100 was up 2.4% and the Dow was up around 1.5%.
By Christopher Norwood October 13, 2025
Executive Summary The S&P 500, Nasdaq & the Dow Jones fell last week President Trump tanked the market Friday with a post about trade talk troubles with China The S&P 500 still has a lot of momentum, though Bond investors aren’t expecting a recession any time soon The Atlanta Fed GDPNow tool is estimating 3.8% real GDP growth for Q3 The AI boom is increasingly dependent on circular cash flows The U.S. stock market has a lot of exposure to AI The Stock Market
By Christopher Norwood October 6, 2025
Executive Summary The S&P 500 rose 1.1% to close the week at 6715.79 The Nasdaq was down 0.3% last week The Dow Jones Industrial Average was up 1.99%. The government shutdown materialized on Wednesday The Fed is expected to cut the funds rate by another quarter point in October Unemployment isn’t rising, and consumers are still spending Recession red flags The last 18 years have been unusual A recession is not Norwood Economics’ base case
By Christopher Norwood September 29, 2025
Executive Summary The S&P 500 fell 0.3% last week to finish at 6,643.66 The Dow, Nasdaq, and Tech sector ended lower as well The S&P average annual total return is 7.9% since the 2000 market peak The economy grew 3.8% in Q2 (third estimate), up from the prior 3.3% second estimate Financial conditions remain loose The 10-year Treasury yield has little room to fall from current levels The elderly and poor suffer most from the impacts of inflation Norwood Economics manages diversified portfolios This time is NOT different The S&P might see negative returns over the next decade Economic growth is the lowest in the past 25 years There are no piles of cash sitting on the sidelines The Stock Market
By Christopher Norwood September 22, 2025
Executive Summary The S&P 500 rose 1.2% last week to finish at 6,664.36 The S&P 500 is up 13.31% year-to-date The S&P is expensive The Fed updated its “Dot Plot” The 10-year yield rose last week despite the Fed’s rate cut The Fed is signaling at least two more rate cuts by year's end A pullback of 10% or so wouldn’t be unusual, but there’s no data signaling recession yet The top ten most expensive S&P 500 companies make up over 39% of the market cap UBS economists estimate a 93% chance that the US will slip into a recession this year Investors should review their portfolios before the next bear market The Stock Market
By Christopher Norwood September 15, 2025
Executive Summary The S&P 500 rose 1.6% last week to finish at 6,584.3 The stock market rises long-term due to earnings growth and interest rates A stock is ownership in a business Investors are willing to pay more for a dollar’s worth of earnings today than in the past Profit margins are already near record highs The Volatility Index (VIX) closed the week at 14.76 The market is setting new highs The CME FedWatch tool places the odds at 100% for a rate cut Wednesday The August jobs report and last week’s jobs revision are driving rate cut expectations Cutting the fed funds rate isn’t the answer to slower job growth Higher long-term rates will negate any benefit from a rate cut The Stock Market
By Christopher Norwood September 8, 2025
Executive Summary The S&P 500 fell 0.3% last week to finish at 6,481.50 The CAPE ratio is currently at its second highest reading ever Valuation is a lousy timing mechanism, but an excellent predictor of future returns Interest rates declined last week The 2-Year Treasury yield fell to 3.51% by the close on Friday The 10-Year Treasury yield also fell, ending the week at 4.10%. The CME FedWatch tool has the odds at 73% of a Fed funds rate of 3.50% to 3.75% or lower by year's end The weak jobs report on Friday showed that only 22,000 new jobs were added in August Unemployment rose to 4.3% from 4.2%. The aggregate weekly payrolls index fell to 4.4% in August “We’re back in that world of uncertainty," states Art Hogan, chief market strategist at B. Riley Wealth  The Stock Market
By Christopher Norwood September 2, 2025
Executive Summary The S&P 500 finished down 0.1% at 6,460.26 last week The S&P is up 9.8% on the year. Industrials and Communication Services are leading the way Personal income rose in line with expectations for July, climbing 0.4% up from 0.3% the prior month A weak payroll number on 5 September means a Fed rate cut on 17 September Unemployment is expected to rise, but it is still low relative to history Wage growth close to 4% will make it hard for inflation to fall to 2% The predictions market has the odds of a recession at 8% The ICE BofA US High Yield Index spread is near all-time lows A bear steepener is increasingly likely. A bear steepener is when the yield curve falls at the short end but rises at the long end
By Christopher Norwood August 25, 2025
Executive Summary The S&P 500 rose 0.3% last week to close at 6466.91 The CME FedWatch tool initially raised the chances of a September rate cut to 84.7% The stock and bond markets opted to buy Fed Chairman Powell’s Friday morning speech Investors now seem certain that the Fed will start cutting again The current five-year breakeven is 2.48% The 10-year breakeven is 2.41% The core Consumer Price Index (CPI) is 3.1% Disinflation appears to be over as the inflation rate is no longer falling The St Louis Fed’s Financial Stress Index is negative 0.8153. A negative number means below-average financial market stress The real 10-year interest rate is falling. Money is getting cheaper. The Fed’s balance sheet is shrinking, but is still 22% of GDP An indebted economy can’t withstand high interest rates  The Stock Market
By Christopher Norwood August 18, 2025
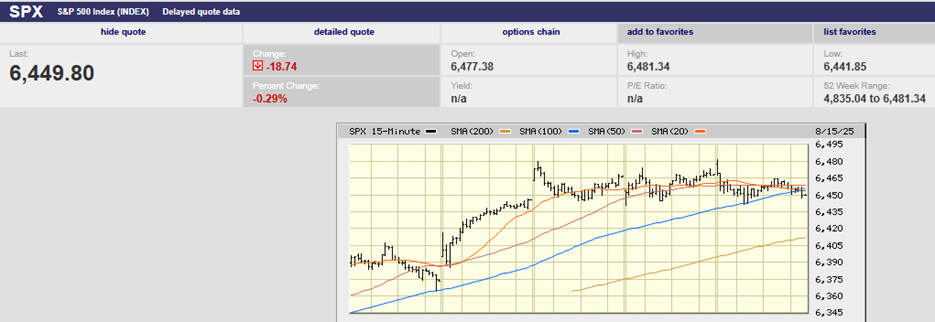
Executive Summary The S&P 500 rose 1.01% last week to finish at 6,449.80 The stock market keeps hitting new highs Market strategists are expecting earnings growth to accelerate in 2026 Margins remain near record highs Corporate profit margins will likely take a hit from tariffs Passing tariff costs on to the consumer means raising prices Core CPI rose by 0.3% in July The PPI jumped 0.9% last month, the largest monthly increase in more than three years Buffett says it’s dangerous when the market cap rises to more than 140% of GDP. Currently, the ratio is above 200%. The massive increase in the Fed's balance sheet over the last 25 years has led to financial asset price inflation The Stock Market