

Executive Summary
- Helene and Milton will impact economic numbers
- Earnings and the Election will dominate the news in the coming weeks
- Recency Bias means people will forget about the impact of the hurricanes
- Quantitative Tightening is ongoing
- The Everything Rally continued last week
- Uncertainty remains high. Risk management remains a priority.
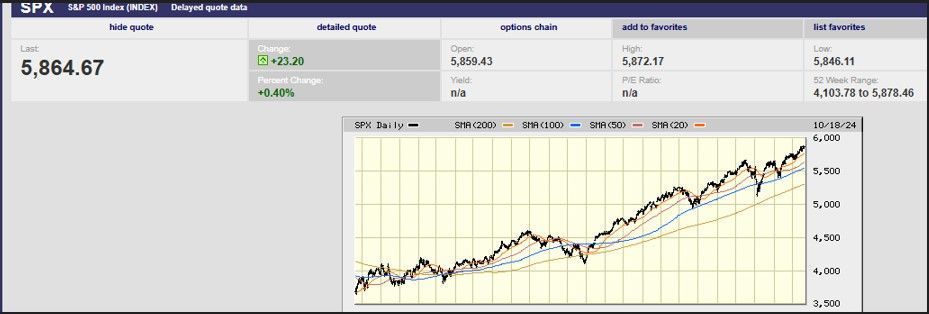
S&P 500 2-year
I was in South Carolina this weekend. A nephew was getting married. The devastation from Helene was much evident on the drive there and back. Recency bias* being what it is, the news cycle has moved on to Milton and forgot about Helene. Earnings and the election are likely to dominate the news in the next few weeks. There will be dwindling coverage of the two hurricanes. The people of North and South Carolina are still dealing with Helene though. Florida is still trying to surface from two hurricanes within two weeks. The state is sputtering and gasping for air as it does.
*Recency bias is a human bias that favors recent events over historic ones. It is the tendency to overemphasize the importance of recent experiences or the latest information we possess when estimating future events. Recency bias often misleads us to believe that recent events can give us an indication of how the future will unfold.
Events often have a lasting impact long after we’ve moved on to the newest thing. We can expect noise in the economic numbers in the coming weeks. At least some analysts will neglect to give due credit to the hurricanes for that noise. And they will draw unwarranted conclusions based on the noise.
The Great Recession is an example of an event with a long-lasting impact. The Covid pandemic is another. The Federal Reserve flooded the economy with money during the Great Recession. It did so again during the pandemic. Its balance sheet exploded from $850 billion to around $4.5 trillion during the Great Recession. The Fed’s balance sheet erupted yet again during the pandemic, rising to around $9 trillion. That’s a lot of liquidity. Somebody must hold every dollar of monetary base created. What to do with all that liquidity? Buy stocks, bonds, real estate, houses, collectibles, and Bitcoin.
Quantitative tightening is ongoing despite the Fed’s recent rate cut. The Fed has shrunk its balance sheet to $7 trillion since March 2022. It allows up to $25 billion in Treasuries to mature monthly without reinvesting the cash. It's allowing $35 billion in mortgage-backed securities to run off its balance sheet as well. The Fed’s foray into QE during the Great Recession was a first. Also a first was the Fed’s attempt at reducing its balance sheet beginning in October of 2017. QT lasted until September 2019. The Fed suspended QT when the short-term lending market seized up. So far so good in its second attempt at shrinking its balance sheet.
Meanwhile the so-called Everything Rally goes on. Pundits believe the rally is a result of the Fed beginning a rate cutting cycle. They are also pointing toward expected double digit earnings growth in 2025 and 2026. Recency bias may be at work again.
It’s as likely that the massive amount of liquidity still in the financial system is fueling the Everything Rally. Financial conditions are loose after all, despite the Fed’s claims to the contrary.
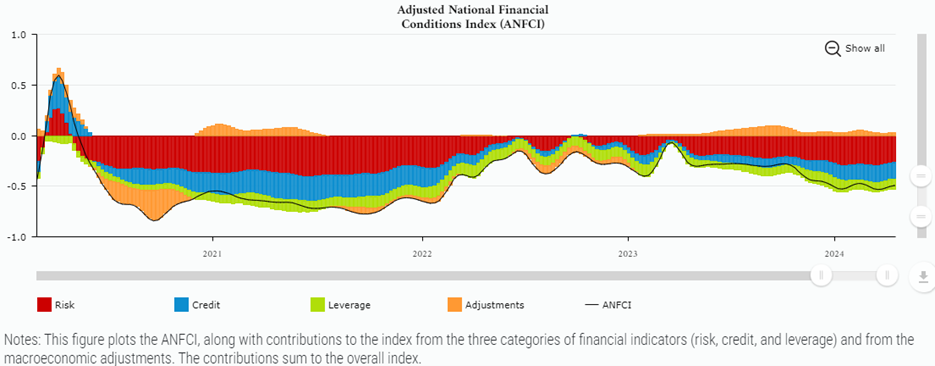
Index Points to Looser Financial Conditions in Week Ending October 11
The ANFCI decreased in the latest week, to –0.57. Risk indicators contributed –0.32. Credit indicators contributed –0.21. Leverage indicators contributed –0.11. Adjustments for prevailing macroeconomic conditions contributed 0.07.
It’s fair to ask whether the Fed’s ongoing QT will bring about a reckoning. Or at least an actual tightening in financial conditions. For now, reserves are “abundant”, according to the Fed. The Fed wants to continue draining excess liquidity until reserves are “ample”. The Fed assures us it will know “ample” when it sees it. Barron’s describes Fed officials as “sanguine” about reaching "ample" without breaking anything. How reassuring.
The Stock Market
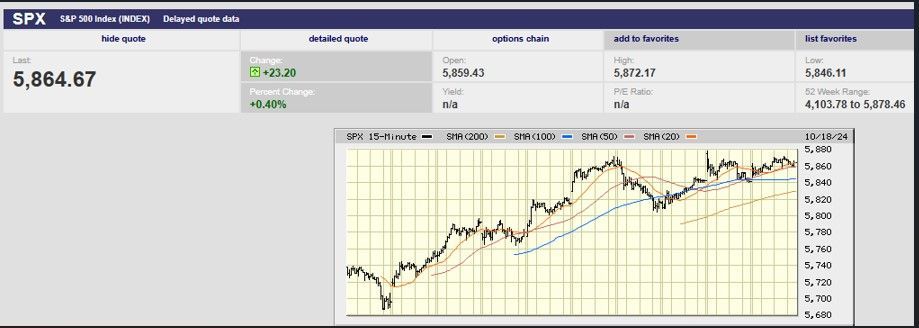
S&P 500 10-day
The Everything Rally continued last week. The S&P 500 rose 0.9%. It finished the week at 5,864.67. The index hit a record on Friday reaching 5,878.46. The Nasdaq rose 0.8% and the Dow 1% on the week. The equity rally has spread beyond the big tech names. The S&P 500 Equal Weight, Dow, and Russell 2000 have all been surging. In fact, the Russell has outperformed large caps in October. Even assets that don’t normally rise with stocks have been doing just that. Bond yields and gold have both been climbing, as has the Volatility Index. Gold has outperformed the S&P 500 so far this year. It is up some 32% year-to-date compared to 22% for the S&P 500. Bond yields continue to rise instead of fall since the Fed rate cut. The two-year Treasury yield is back over 4%. So is the 10-year yield, which had climbed to 4.19% by Monday’s close. Remember that the 10-year yield impacts the 30-year fixed mortgage rate. Rising yields will weigh on the economy and the stock market at some point.
Stocks are likely to continue to rise if history is any guide. Although there does seem to be confusion about how much. The bull market hit its second birthday on 12 October. Sam Stovall, chief investment strategist at CFRA, told clients that there is limited upside in year three of a bull market. He wrote that the average 12-month return was 2% following a second birthday. What’s more, stocks aren’t cheap. A price/earnings ratio of 25 times trailing earnings is a “concerning” valuation, he wrote.
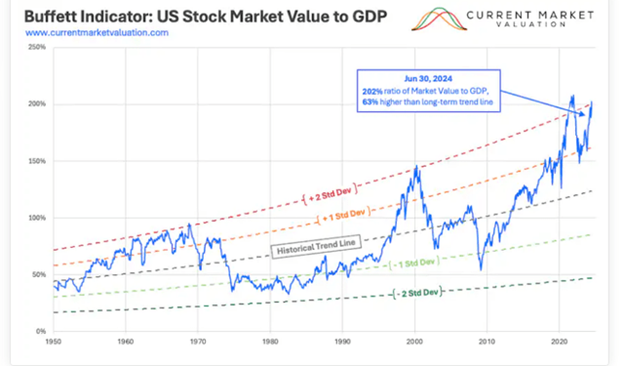
Warren Buffet’s favorite valuation gauge certainly looks expensive. (chart above)
Meanwhile, Nicholas Colas, co-founder of DataTek Research claims stock market upside is much higher following a second birthday. He told Barron’s that positive returns followed in year three of a bull market 12 out of 15 times. He claimed that the data shows an average third-year gain of 7.3%. Positive returns in year three of the bull market seem assured (yes that is sarcasm). How big the returns is an open question.
The Atlanta Fed’s GDPNow forecast rose to 3.4% from 3.2% last week. Its estimate of personal spending growth climbed to 3.6% from 3.3%. Retail sales for September pushed personal spending higher as sales topped estimates. Core retail sales (excluding automobiles, building materials, and gasoline) increased 0.7% last month. It was more than twice the consensus forecast of 0.3%. August’s number was 0.1%. The Fed may be second guessing its September half point rate cut by now.
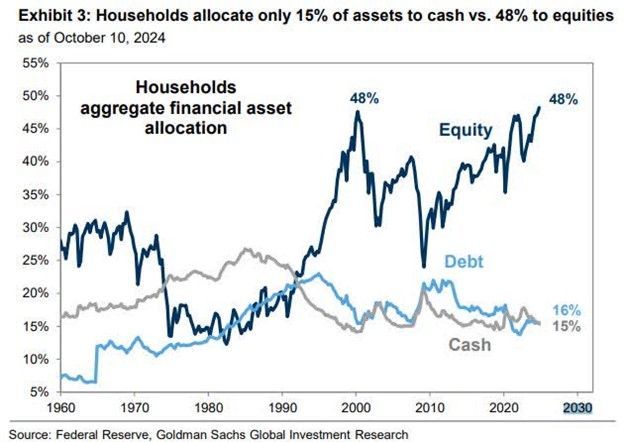
The half point cut also spurred the biggest jump in investor optimism since June 2020, according to BofA. Money managers’ allocations to stocks surged while they pared bonds and cash. Households followed suit. (See chart below).
Uncertainty remains high. Risk management remains a priority.
Regards,
Christopher R Norwood, CFA
Chief Market Strategist


