

Executive Summary
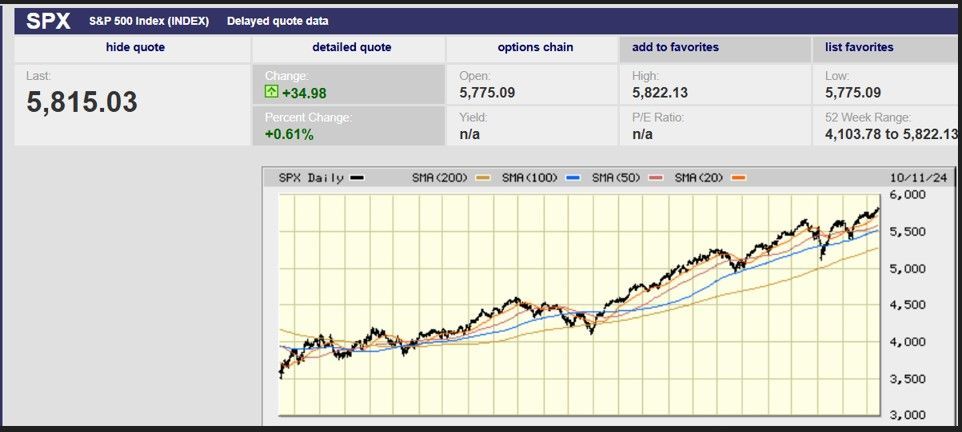
- The S&P rose 1.1% last week to 5,815.03
- Earnings season began last week
- Earnings growth is forecast to surge by double digits beginning in Q4 of 2024
- The Earnings forecast for Q3 2024 has fallen nearly 10%
- Long-term interest rates continue to rise
- Inflation expectations are rising since the Fed’s outsized rate cut
- Milton will further muddy the initial jobless claims numbers in coming weeks
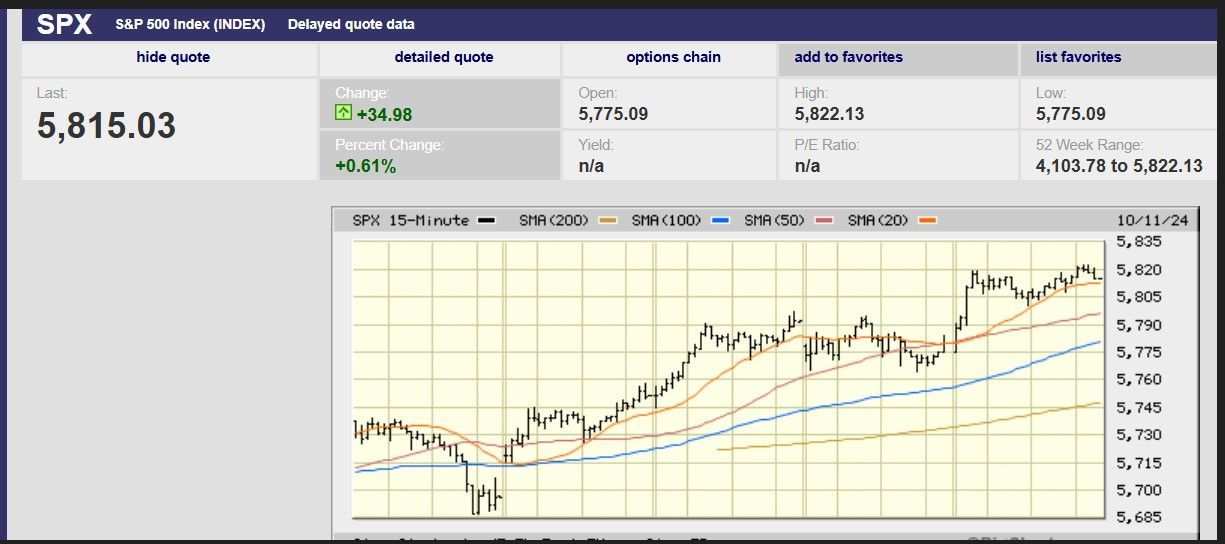
5-day S&P 500 chart
Market Update
The stock market rally continued last week. The S&P finished the week at 5,815.03, up 1.1%. The index hit its low for the week late Monday. The remaining four trading days were a steady grind higher. The index hit its daily high late in the day on Tuesday, Wednesday, and Friday. The S&P hit a new record high of 5,822.13 in the last hour of trading Friday. Early lows and late highs intra-day are bullish. Professional investors tend to trade late in the day. Highs late in the week are also bullish. That is because investors are confident enough to hold positions over the weekend.
Earnings season began last week with a few of the big bank’s reporting. A slew of companies will report this week. Earnings growth estimates have fallen. But it's guidance from executives that will determine how investors react to earnings reports. Analysts are expecting S&P 500 Q3 earnings growth of 3.5% year-over-year. Earnings growth is forecast to surge 11.1% in Q4. Earnings growth is forecast to be 14.0% in 2025 and 13.1% in 2026.
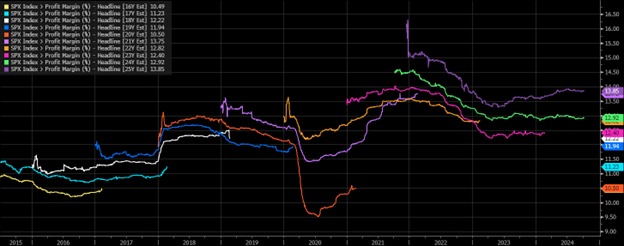
It's unclear why earnings growth will surge by double digits beginning in Q4 of 2024. The Federal Reserve is forecasting real GDP growth of 2% in 2025 and 2026. Inflation is forecast to be 2.0% for both years as well. That puts nominal GDP growth at 4.0%. Profit margins will need to expand if profits are to grow double digits with nominal GDP growth of just 4%. Margins are already high. Profit margins in 2024 are estimated at 12.9%. Margins are expected to expand to 13.9% in 2025. Margins above 13% have only occurred once since 2016. That was in was in 2021.
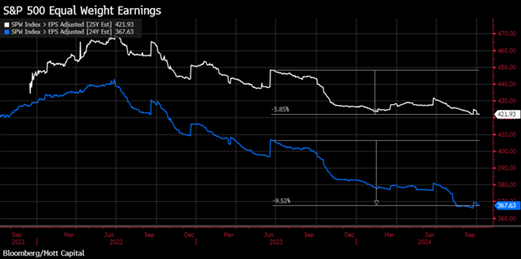
The S&P 500 equal weight index has seen its 2024 earnings estimates fall by nearly 10% to $367.63 per share. 2025 earnings estimates have fallen by more than 5% to $421.93 per share.
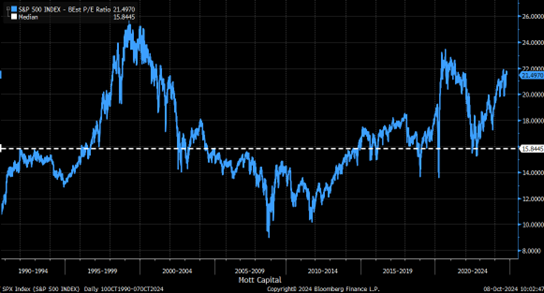
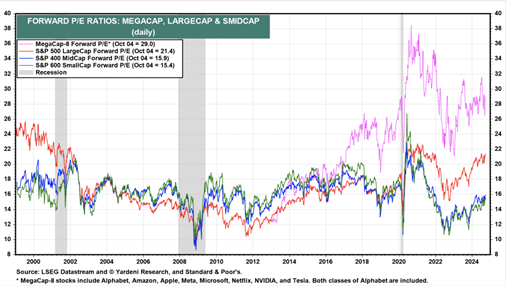
The S&P 500 is trading at 21.5 times a blended 12-month forward PE. That is well above the median PE of 15.9 since 1990. It is the third-most expensive S&P 500 in more than 40 years.
But the market is a market of stocks not a stock market. Breaking down valuations by size paints a better picture (see the chart below). Small and midcap stocks are cheaper than large-cap stocks and much cheaper than the “Mag 8”. International and emerging markets are also cheaper than U.S. large caps.
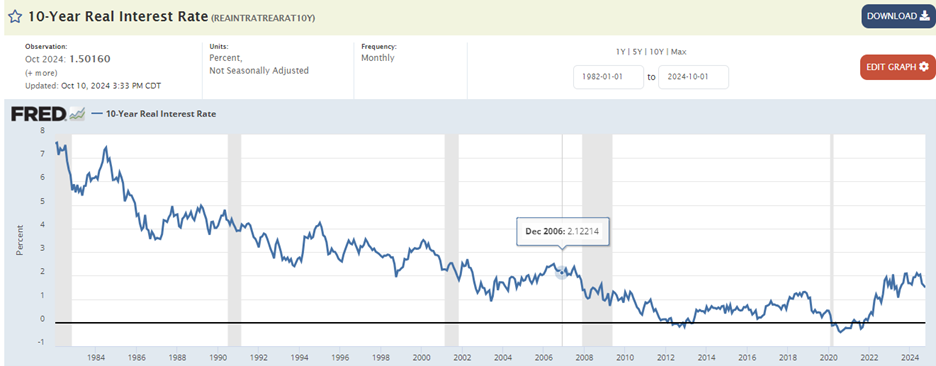
Meanwhile, long-term interest rates continue to rise. The two-year Treasury finished the week at 3.98% up from 3.95% the prior week. The 10-Year Treasury yield ended the week at 4.10% up from 3.97% the prior week. The 10-year Treasury yield is up 48 basis points (hundredths of a percentage point) since mid-September. The 10-year Real Interest Rate is low and falling. It finished the week at 1.50%. Money's getting cheaper.
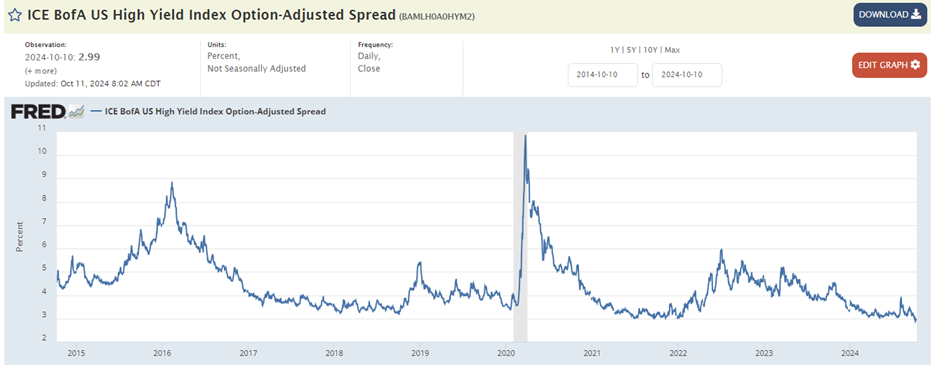
Credit spreads remain tight indicating no stress in the credit markets. The ICE BofA US High Yield Index measures the spread of high-yield debt over risk-free Treasury debt. The spread is 2.99% as of 10-10-24, at 10-year lows.
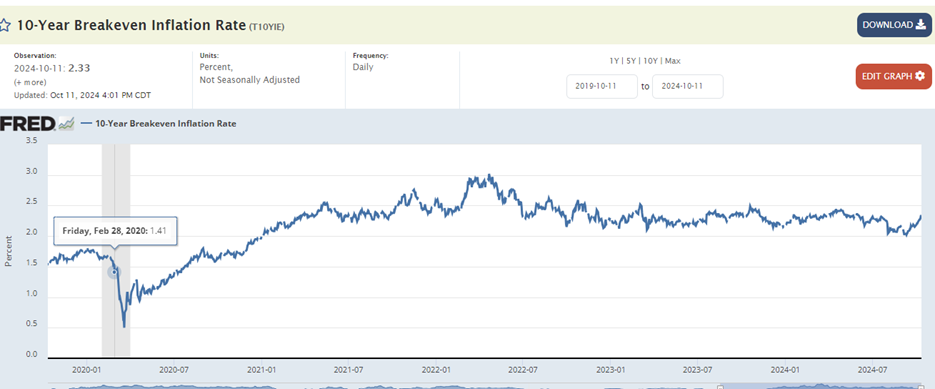
Inflation expectations are rising since the Fed’s outsized rate cut. The 5-year and 10-year breakeven inflation rates are continuing to rise. The 5-year breakeven is at 2.25% up from 1.88% on 9 September.
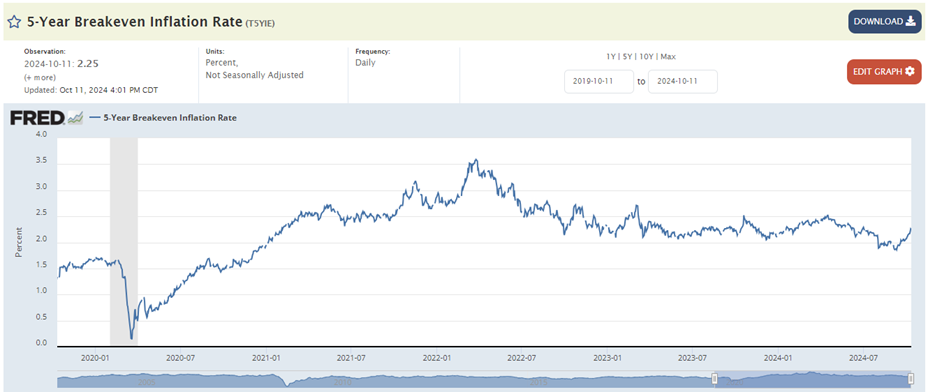
The 10-year breakeven is at 2.33% up from 2.02% on 10 September.
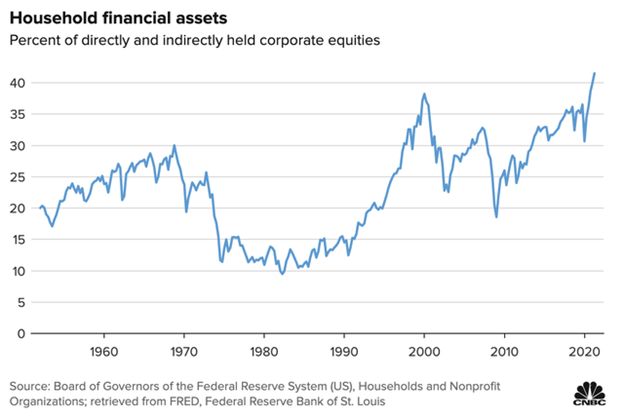
Sentiment is bullish. Markets trade on momentum in the short term. Investors have a high exposure to stocks.
Bears have dropped to only 20.6%, the lowest reading since December 14, 2023.
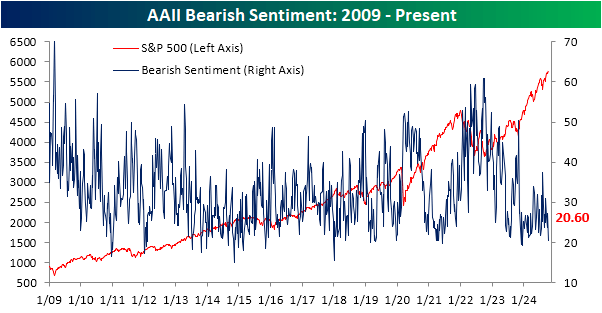
High levels of bullishness and low levels of bearishness means fewer investors are left to buy. Everyone is already in the swimming pool. Sentiment extremes often lead to corrections. For now, though, market internals remain strong. Profit taking is always a possibility but higher prices over the last 2 ½ months of the year seem likely.
2-year S&P 500 chart
Economic Indicators
The initial claims report was 258,000, up from 225,000 the prior week. Economists had estimated 230,000. The 258,000 initial claims matched the high from the week of 5 August 2023. It is the most elevated reading since 17 August 2023. Current initial claims are at some of the highest levels since the fall of 2017 (excluding pandemic).
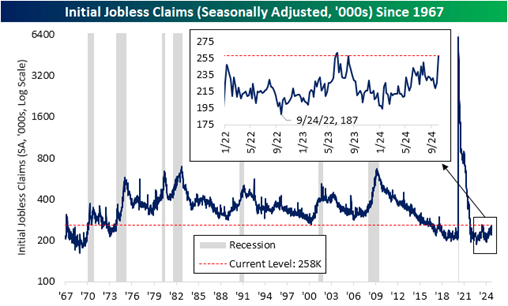
But excluding those states hit by Helene, claims aren't even at summer highs.
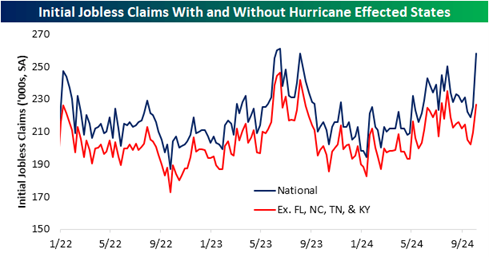
Milton will further muddy the initial jobless claims numbers in coming weeks. It will take a month or two before the noise filters out and we get a true read on initial jobless claims once again.
The Bureau of Labor Statistics (BLS) reported the Consumer Price Index (CPI) on Thursday. The headline number showed a rise of 2.4% year-over-year. It was above economists' expectations of 2.3%. Still, it was the smallest 12-month increase since February 2021. Additionally, core CPI rose to 3.3%, also above expectations.
Economic data continues to be strong. The Atlanta Fed GDPNow tool is forecasting GDP growth of 3.2% for Q3 2024. The GDPNow forecast is more accurate within 30-days of the release of GDP by the BEA. The advance estimate for Q3 is due 30 October. There is little evidence that a recession is near.
Indexes, Benchmarks, and Investing
My brother came to visit last week. He has recently started reading Barron’s at my suggestion. He asked me about fundamental indexes during his visit. He’d read about them in Barron’s a few weeks earlier.
Indexes have traditionally been market capitalization weighted. A notable exception is the DOW, which is market price-weighted. A company’s market capitalization equals the number of shares outstanding times the share price. It is a somewhat arbitrary way to weigh the importance of a company to the economy or a stock to an index. And it leads to some undesirable characteristics for an index. For instance, currently the top five stocks by market cap make up 26.4% of the S&P 500 index. The top ten make up 34.9%. As a result, the S&P 500 is a concentrated index, not appropriate as a standalone investment.
The weighting of a stock in a market cap-weighted index isn't based on business characteristics. Revenue, earnings, dividends and book value don't matter. Only the market cap matters. Fundamental indexes are less prone to concentration because market cap doesn't matter. As well, fundamental indexes track the metrics that lead to profits for owners. Earnings and earnings growth are the two determinants of return over the long run. It makes sense to weigh the importance of a stock in an index based on its economic size rather than its market capitalization.
A fundamental index is based on the idea that a company’s economic footprint is a better measure of a company’s value than market cap. It is contrarian in nature. That’s because fundamental indexes overweight undervalued companies and underweight overvalued companies. A benefit of contrarian investing is that it outperforms momentum and growth investing over long periods of time. The reason is straightforward. Buying assets when they’re on sale will always lead to above-market rates of returns. Paying less for a company than it’s worth generates the excess return. Conversely, if you overpay for a company your returns will suffer, regardless of the quality of the underlying business. People will learn that lesson with Nvidia in the coming decade. Folks that bought Coca-Cola in the late 1990s learned that lesson long ago. Coke hit a high in 1998 that it didn’t surpass until around 2016. Great company but not worth 55x earnings.
Indexes are useful but they aren’t perfect. Norwood Economics focuses on earning the real return needed for clients to meet spending goals in retirement. We focus on earning the needed return while taking as little risk as possible. Most of our clients can’t afford to lose money over a decade, as the S&P did from early 2000 until 2010. Nor can they afford to earn a zero for long periods of time as the S&P 500 did from 2000 until 2013 (and from 1968 until 1982).
Building low-risk diversified portfolios minimizes the probability of big losses or long periods of no returns. The goal is to achieve returns over a market cycle while minimizing volatility. The returns targeted are based on our clients’ spending goals in retirement.
Regards,
Christopher R Norwood, CFA
Chief Market Strategist


