

Negative Net National Saving (NNNS) means slower economic growth
Market Update
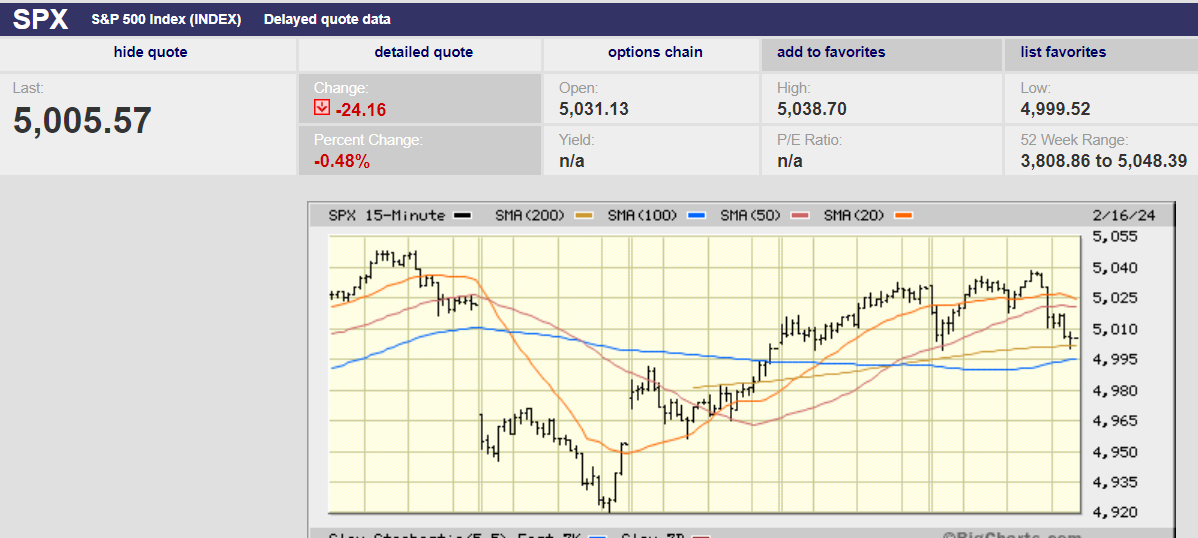
The S&P 500 closed the week at 5,005.57, down 0.4%. The Nasdaq fell 1.3%. The 10-year Treasury yield rose to 4.30%. The two-year Treasury rose to 4.67%. The 30-year Treasury yield rose to 4.45%. Treasury bond yields continue to rise. Rising yields will make it difficult for the stock market to continue its advance. In fact, it may have already made a short-term top.
The S&P hit an all-time high on Monday of 5048.39. Stronger-than-expected inflation news sent the index lower on Tuesday. The S&P gapped down at the open Tuesday. It traded lower until bouncing off the 20-day moving average late in the day. Investors continued to buy the bounce Wednesday and Thursday. The index filled the gap left from Tuesday’s open by late Thursday. The S&P peaked at 5038.70 around 2 p.m. on Friday before falling back to 5,005.57 by the close.
Tuesday’s low of 4,920.31 bears watching. It is support given that the market bounced from there in later afternoon trading. The bounce began near the 20-day moving average. An example of the mechanical trading that dominates the market most days. Find support at the 20-day then run the index back to fill the gap left by Tuesday's open. That done, take a run at the Monday high, see about pushing the index further into uncharted territory. Run into resistance midday Friday. Start probing to the downside to see if the Friday morning low can be taken out. That mission wasn't accomplished Friday afternoon. It might happen Tuesday morning when the market reopens. Or maybe buyers regroup and take another shot at a new all-time high. Mechanical trading, computer vs. computer, a zero-sum game.
A failure to take out last Monday’s high this week may lead to profit-taking. A continued decline to Tuesday’s 4,920.31 low sets up a test of support. More robo-selling will hit the market if 4,920.31 and the 20-day moving average fail to hold. A drop below 4,920 puts a double top in place. A double top in turn is a sell signal for the algorithms and would likely generate more selling. The next support after 4,920 is 4,800 (50-day M.A.) and then 4,600 (100-day M.A.).
Of course, the market may continue its merry way higher this week. Optimism abounds. There are a few caution flags though. The S&P finished near its lows for the day Friday. A yellow flag for short-term market direction. There is a negative divergence between the Relative Strength Indicator (RSI) and the S&P 500. The Slow Stochastic Indicator is pointing down and the MACD is close to flashing a sell signal. And of course, there are those rising interest rates. Higher rates will keep a lid on stock prices, all else equal. Finally, volatility remains low. It did spike to 17.94 on Tuesday briefly before falling back to 14.24 by week’s end. A low VIX signals investor complacency. A VIX in the 18 to 20 range is more typical.
An expensive market further tips the scales towards the downside. A pullback of at least a few percent is likely in the next few weeks. A 10% to 15% decline sometime in the next couple of quarters is also a real possibility. The S&P is trading at 22.4x trailing 12-month earnings, up from 20x a year ago. It trades at 21x expected 2024 earnings. A price-to-earnings of 16x 12-month forward earnings is the long-run average. The dividend yield has fallen to 1.44% from 1.63%. The index’s price-to-book ratio is 4.61x, above the average of 3.01x, according to Josh Staiger of Multipl. The current 4.61x price-to-book isn’t that far away from the record of 5.06x set in March 2000.
The week ahead could go either way. The main trend is up but the market is stretched. A pullback to 4,800 or even 4,600 would be normal. Norwood Economics would take the opportunity to buy more of what we already own. It would also look to buy a few new positions, companies we’ve researched but that aren’t quite cheap enough yet.
Economic Indicators
The core CPI was 0.4% for January, up from 0.3% the prior month. The forecast was for 0.3%. The CPI for January year-over-year was 3.1%. Core CPI was 3.9% year-over-year, unchanged from December. Q4 GDP was 3.3% while the economy grew 2.5% in 2023. None of these numbers argue for a Federal Reserve rate cut. The core rate of inflation at 3.9% is still well above the Fed’s 2.0% target. The Federal Reserve considers 1.8% GDP growth the non-inflationary rate. The economy is growing above 1.8%.
U.S. retail sales fell 0.8% in January after rising 0.4% in December. The forecast was for a decline of 0.3%. It was the biggest drop in 10 months. Retail sales minus autos was negative 0.6%, below the forecast of 0.2%. Retail sales represent about one-third of all consumer spending. The concern is that the consumer may be hitting a spending wall. It’s too early to tell whether weaker retail sales will turn into a trend though.
The producer price index (PPI) was stronger than expected in January. The core PPI rose 0.6%, faster than the 0.1% forecast, and faster than the prior month’s 0.2%. The increase in wholesale prices was the biggest in five months. Producer prices lead consumer prices. Wholesale prices are input costs. Profit margins fall if companies don't raise their prices in turn. Falling profit margins lead to falling profits otherwise.
The economic data last week showed that the inflation fight isn’t over. BlackRock made exactly that point in its weekly commentary. It said that “ongoing wage pressures in a tight U.S. labor market will put inflation on a rollercoaster beyond 2024”. Last week’s data also showed that consumer spending may finally be starting to weaken. The next few quarters will tell if that is the case.
Negative Net National Saving (NNNS)
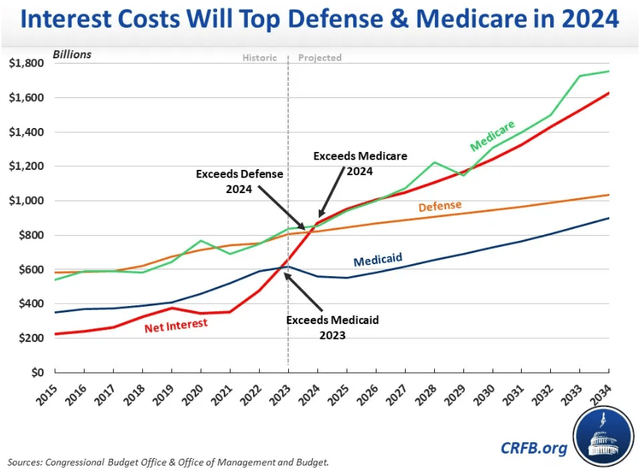
We’ve written about the heavy fiscal spending several times in the last few months. We wrote in Volume 257 in December that, “U.S. interest costs doubled from 2020 to 2023. Interest costs are the fastest-growing area of government spending. The U.S. is on track to spend more than $13 trillion on interest over the next decade according to the Congressional Budget Office (CBO)”.
The CBO recently released its Budget and Economic Outlook for the decade from 2024 to 2034. The debt growth projected is staggering.
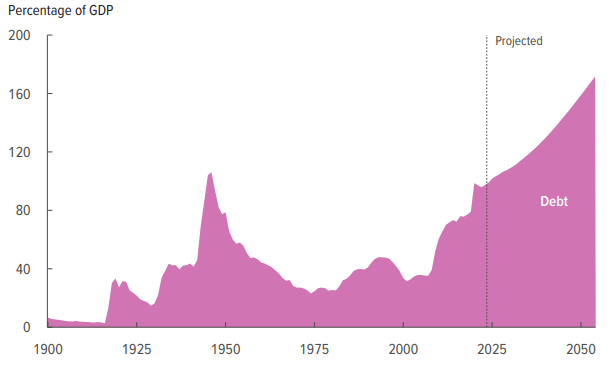
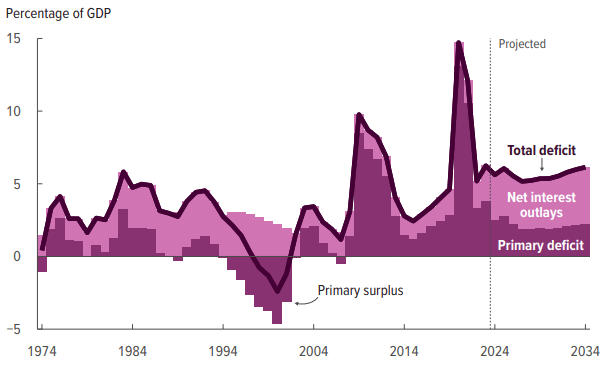
The CBO projects that the total deficit will rise over the next decade mostly because of rising interest expenses.
U.S. government interest payments are already rising rapidly due to large fiscal deficits and rising interest rates.
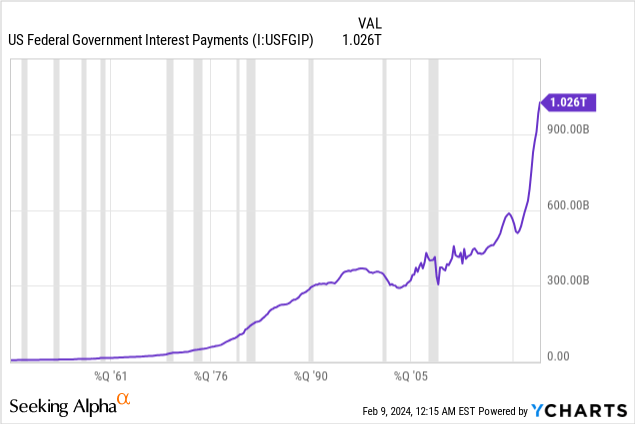
Interest costs will top defense and Medicare in 2024.
Economic growth will slow given current debt and deficit trends. Both are at extremes. Net national saving was negative in 2023. National saving was negative because the Federal budget deficit exceeded private and foreign saving. (Foreign saving is the inverse of the current account deficit). It is only the eighth year since 1929 with negative net national saving (NNNS). Four occurred during the Great Depression. The three other years occurred during the Great Financial Crisis and recovery (2008-2010).
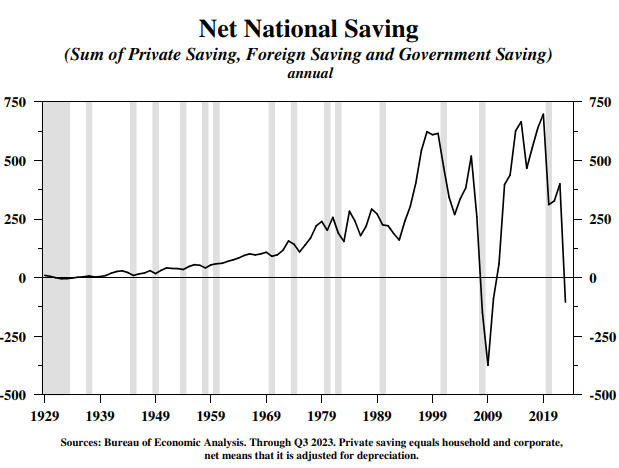
There are a few truths in economics. Investment equals savings is one of them. It is an accounting identity. Investment must equal savings. Negative saving means negative investment which means a reduction in the capital stock. A reduction in the capital stock means slower economic growth. That is because of another economic truth. Technology combined with land, labor, and capital determines the output of an economy. A falling capital stock means less output all else equal. Slower economic growth means less wealth for a nation.
A growing workforce and increased natural resources can offset a decline in the capital stock to some extent. But economic growth is slower than it otherwise would be given a declining capital stock. The U.S. population growth is low. It grew 0.5% in 2023. Increasing natural resource availability doesn't come quickly either. Economic growth will be slower in the U.S. if the country has a low or negative saving rate. Economic growth has already been slowing over the last 50 years.
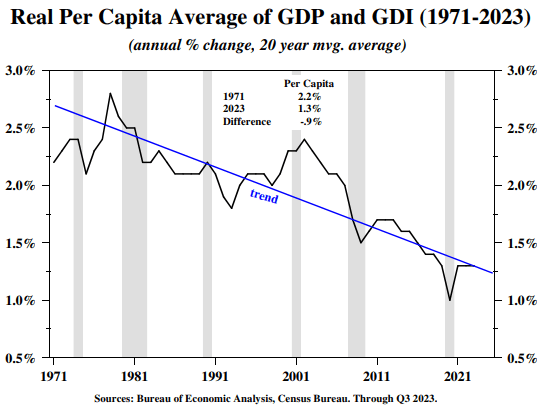
Dr. Lacy Hunt writes in the latest Hoisington Investment Quarterly Report, “Under prevailing conditions, the aggregate production function indicates the United States, and its major competitors face a prolonged period of subpar economic growth until net national saving turns positive.” Real per capita growth grew at 0.6% over the last four quarters. The twenty-year average is 1.3%. Real per capita growth has averaged 2.2% since 1970. Slowing real per capita growth means a slower increase in the standard of living. Slower economic growth will make it harder to staunch the fiscal deficits. It will make it harder to pay down a heavy and rising national debt load as well.
Slower economic growth also means slower corporate earnings growth. Slower corporate earnings growth means lower stock market returns than in the past. Stock market returns were already likely to be below the long-term average. That is because corporate profits are expected to grow more slowly now that interest rates are no longer falling (Smolyansky, Federal Reserve, 2022). The Fed study makes the case that the tailwind created by falling interest rates and reduced corporate taxes is gone. The lack of savings and resulting lack of investment in the capital stock only adds to the likelihood of an underperforming stock market in the coming decade.
Regards,
Christopher R Norwood, CFA
Chief Market Strategist


