

JP Morgan thinks current market developments are odd
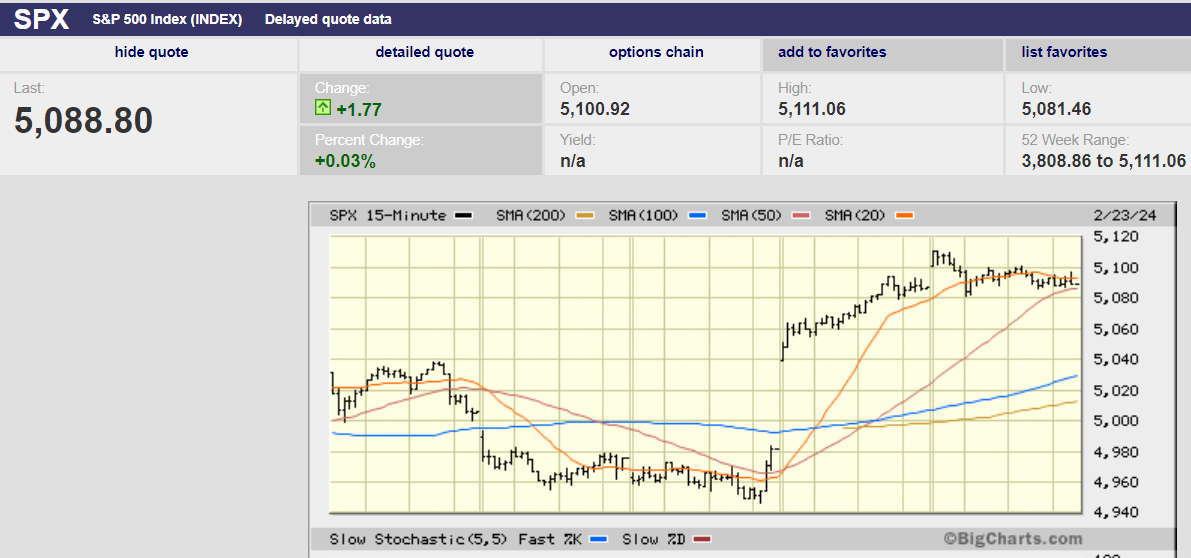
5 day chart of S&P week of 2/18/2024
Market Update
The S&P rose 1.7% last week, finishing at 5,088.80. We wrote last week that, "the market may continue its merry way higher this week." It did. We also pointed to some possible short-term weakness given that the S&P closed near its lows on Friday. "A yellow flag for short-term market direction," we called it. The S&P did start last week with losses on Tuesday and Wednesday. Nvidia's earnings report Thursday before the open ended the decline though.
The S&P 500 is up 6.7% on the year. The index is up 5.6% total since 4 January 2022. The rally that began on October 27th continues with nary a pause. The S&P was up 6.9% year-to-date when the rally began. It’s up 24.0% since then in less than four months.
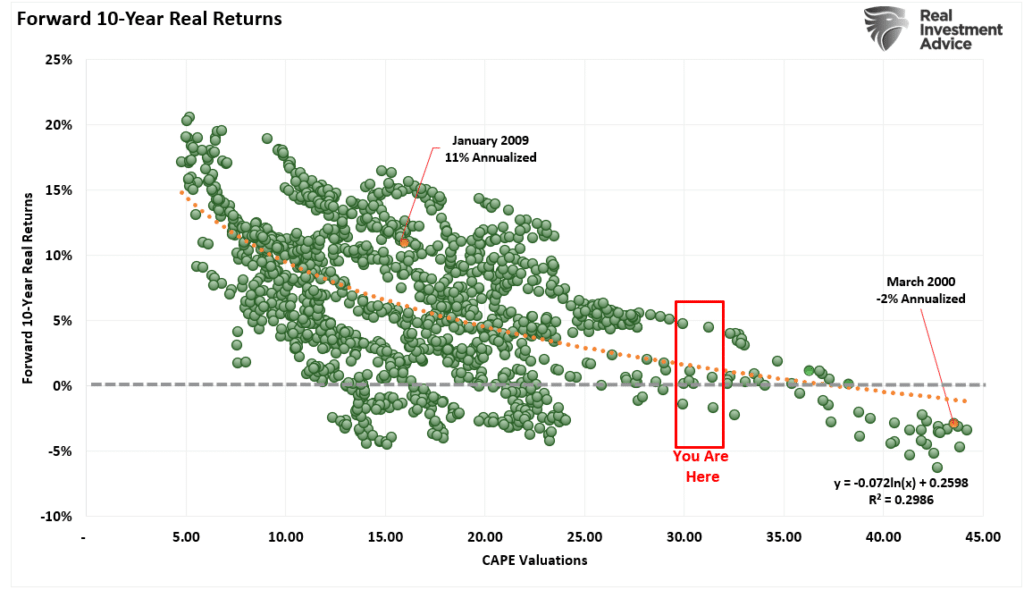
The rally has been unrelenting. The S&P has spent almost no time trading below its 20-day moving average since climbing above it on 2 November 2023. A pullback is overdue. Trees don’t grow to the sky. There are no straight lines in nature or the stock market. What’s more, the S&P wasn’t cheap when the October rally began. It was trading at around 17x 2024 earnings, a bit above its long-term average of 16x. Of course, 17x assumes that the big jump in earnings expected in 2024 materializes. Now the S&P is trading at close to 21x earnings, which is expensive. And again, that assumes the forecast 12% earnings growth materializes. Mid-single-digit earnings are more likely. The S&P price-to-earnings multiple rises to 22x if earnings grow only 5% in 2024. That’s nosebleed territory.
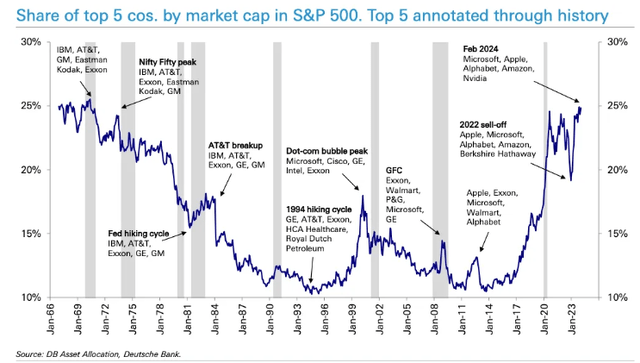
The catalyst for last week’s gains was Nvidia’s (NVDA) earnings report. Nvidia is a semiconductor stock and is experiencing strong growth in AI chips. Nvidia is one of the Magnificent Seven. Its market cap is $2 trillion. It is the third most valuable company in the world trailing only Apple and Microsoft. The stock is more valuable than all but 11 economies in the world. It is bigger than the economies of Russia, South Korea, Australia, and Spain among others. It’s barely trailing Mexico and Canada. Given the choice, I’d take Australia’s economy over Nvidia in a heartbeat. (Too much geopolitical risk with Russia or South Korea).
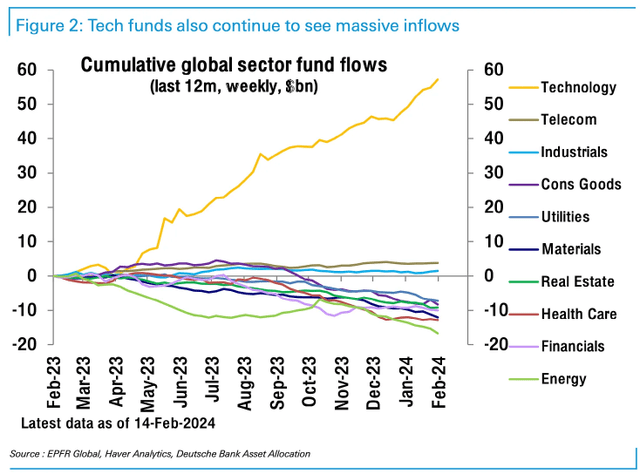
Thursday’s rally in the stock resulted in the biggest single-session increase for a U.S. company in history. Nvidia added $277B in market value on Thursday. A $277B increase in market cap is more than the market cap of Coca-Cola. It's a big number in other words. Nvidia’s stock has risen 60% in 2024. It accounts for more than a quarter of the S&P's gains YTD. Investors are stampeding into the Tech sector.
All of which means if you don’t own Nvidia and the rest of the Magnificent Seven you’re likely trailing the S&P 500 year-to-date. Does it matter? Should you buy Nvidia and the other mega-techs? We’ll address those two questions in part three of our newsletter.
Meanwhile, the two-year Treasury rose last week to finish with a 4.70% yield. The 10-year Treasury fell 4 bps to 4.26% from 4.30% and the 30-year fell 9 bps from 4.45% to 4.36%. It is the two-year Treasury that leads the Fed Funds rate. It is signaling higher for longer. Bond investors are starting to believe the Fed means what it says.
Higher interest rates matter to the economy. Higher rates make it harder for companies to refinance debt. There is a debt maturity wall looming in commercial real estate for instance. Around $2.2 trillion in CRE loans are coming due by the end of 2027, according to the Wall Street Journal. Many developers will hand the keys back to the banks, unable to refinance at higher rates. Higher rates also make it harder for consumers to consume. Credit card debt is above $1.15 trillion and climbing. Delinquencies are rising.
Rising yields are also competition for stocks. Jan Loeys and Alexander Wise are J.P. Morgan strategists. They think investors will migrate away from stocks in the coming years. Bonds are yielding 4% or better. Stocks are expected to return around 6% over the next decade according to the strategists. A 6% average return is well below the 10.8% average over the last 35 years. Loeys and Wise believe the combination of higher bond yields and lower stock returns will dampen investor enthusiasm for stocks.
The J.P. Morgan strategists may be too optimistic about U.S. stocks in the coming decade.
It's not been lost on some strategists that the original narrative of Fed rate cuts has gone by the wayside. Last fall it was the Fed cutting early and often in 2024 that spurred investors on. Not any longer. Market strategists are pointing instead to the AI boom as justification for the rally now. Same rally, different reason, no one cares. Well, not no one.
“While most of those incremental [rate] cuts are now priced out, the stock market did not correct at all,” wrote J.P. Morgan strategist Marko Kolanovic this past week. “We find current market developments odd,” he added, puzzling over how “various far-fetched applications of AI” will lift the broader economy.
There is a disconnect between the economy and investors’ rate-cut expectations. There is a disconnect between the promise of AI and the realization of AI as a productivity generator. It may be coming, but not tomorrow or even next year. It will take time, lots of it, before AI permeates the economy and impacts productivity. It's productivity gains that will lead to a faster-growing economy. It's a faster-growing economy that will justify higher stock price multiples. Speaking of which, GDPNow is predicting 2.9% GDP growth for the current quarter.
It's hard to imagine the Fed cutting given current conditions. The stock market is hitting all-time highs. Corporate bond spreads are tight. The economy is growing above its non-inflationary rate of 1.8%. Also, financial conditions are already easy. Companies can issue stock and convertible debt at almost no cost. Super Micro Computer (SMCI) raised $1.5 billion last week using private convertible debt. The notes carried a 0% interest rate with a 37.5% conversion premium. The stock trades for 69x earnings and 5.4x sales.
Easy financial conditions mean the Fed may not cut rates in the first half. It may not cut rates at all in 2024. The March Summary of Economic Projections (SEP) is likely to show that the Fed expects fewer than three cuts in 2024. The Fed’s December SEP had three cuts. Those cuts were predicated on GDP growth slowing to 1.4%, unemployment rising to 4.1% and the core PCE falling to 2.4%. GDP growth is showing no signs of slowing. Unemployment is 3.7%, which is near 50-year lows. The weekly jobless claims number is anchored near 200,000. Sticky inflation numbers are hinting that the rate of decline in inflation is slowing. Put it all together and a case can be made for one to two cuts at most. Those cuts would likely come in June and July. The Fed is unlikely to cut after that due to the Presidential election.
How will the market respond to higher for longer? How big an impact will higher for longer have on earnings growth? How long can the S&P continue to surge without lower rates and double-digit earnings growth? All good questions. Stay tuned.
Economic Indicators
It was a light week for economic news. Nvidia dominated the week’s trading with its better-than-expected earnings report. The Consumer Conference Board Leading Economic Indicators (LEI) report did come out Tuesday. It dropped 0.4%. It was the 22nd month in a row of declines. It is the third-longest losing streak ever. Six of the ten indicators rose over the last six months despite the overall drop. It’s the first time that’s happened in two years. The Conference Board is no longer forecasting a recession for 2024. It is expecting GDP growth to slow to near zero percent in the second and third quarters though.
The real interest rate yield is 2.0%. Money is expensive. The Federal Reserve believes R star is 0.5%. R star is the neutral rate that neither stimulates nor retards the economy. The U.S. has a large amount of public and private debt. A high real yield coupled with high debt loads will impact economic growth at some point.
That said, initial jobless claims were 201,000, another strong reading. They were 213,000 two weeks ago. The S&P flash US services PMI and manufacturing PMI both signaled growth. The manufacturing PMI rose to a 17-month high of 51.5. New orders were the strongest in more than a year and a half. Positive signs that the economy isn't falling into recession.
Chase the Big Techs or Not?
The stock market rose last year on narrow participation. It is still rising in 2024 with a huge helping hand from a handful of stocks. The rally kicked off with the narrative that the Fed would cut early and often in 2024. Investors were expecting six cuts in all. No one believes that anymore. The CME FedWatch tool calculates a 4% chance of a cut in March. It calculates a 25.3% chance of a cut in May. The odds of a cut don’t rise above 50% until June. Investors are pricing in three to four cuts in 2024 rather than the six they had their money on at the start of the year. They may not even get three. So, AI has taken up the rallying cry for investors. And the Mega-Tech stocks haven’t missed a beat. They are where the action is so far in 2024.
Norwood Economics owns two tech stocks, neither of which are named Nvidia. Our stock portfolio trailed the S&P 500 last year. Our stock portfolio easily beat the S&P in 2022. Does it matter? We don’t think it does. First, we aren’t trying to track the S&P. In fact, only 54% of our stock portfolio is U.S. The other 46% are international stocks. We look for good companies on sale regardless of where they are headquartered. The S&P as a benchmark is irrelevant to our portfolio. The Russell 1000 Value Index is a closer match in style. The Morgan Stanley EAFE index is a better match for our international stock holdings. (EAFE stands for Europe, Australasia, and Far East.)
The S&P 500 also doesn’t matter because we aren’t trying to beat it. Beating the S&P isn’t a retirement goal. Having enough money to meet spending goals in retirement is a retirement goal. It's the most important retirement goal. Norwood Economics calculates the real return (net of inflation) needed to meet spending goals. We build diversified portfolios to earn that real rate of return while taking as little risk as possible. The S&P doesn’t figure into the process.
And then there is the lack of diversification in the S&P. It is a concentrated U.S. stock portfolio. Diversified portfolios should have Treasury bonds, emerging market stocks, and gold in them.
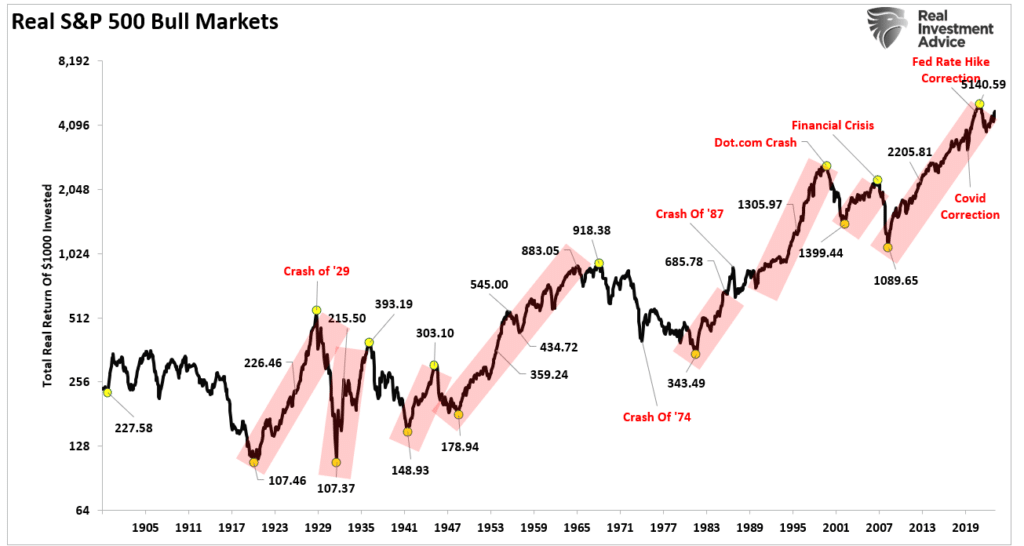
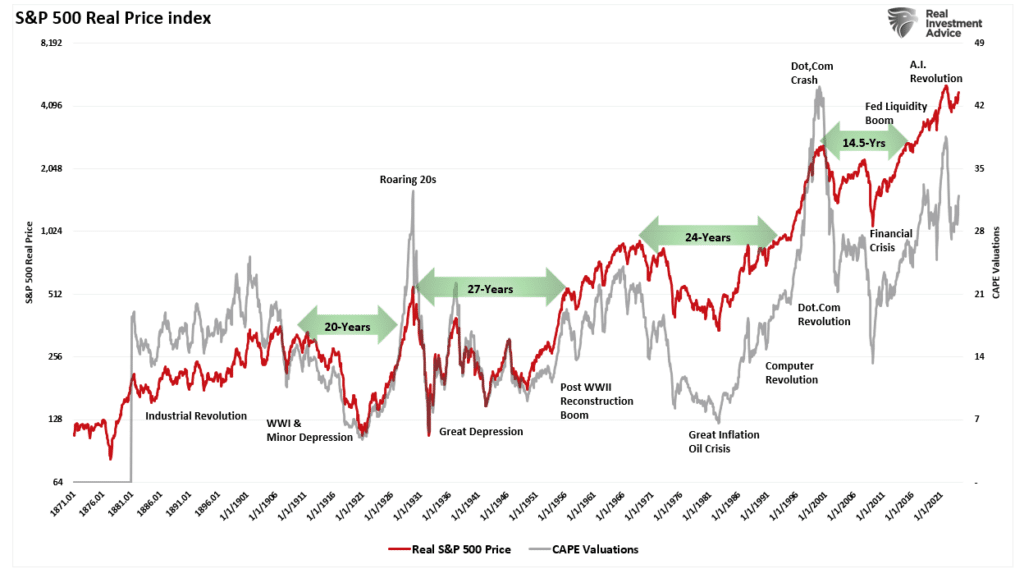
The lack of diversification can lead to long periods of zero return.
We would buy some or all the Mega-Tech stocks if we thought they would generate excess risk-adjusted returns. That brings us to the second question we posed earlier in our newsletter. Should you (we) buy Nvidia and the other big tech companies now?
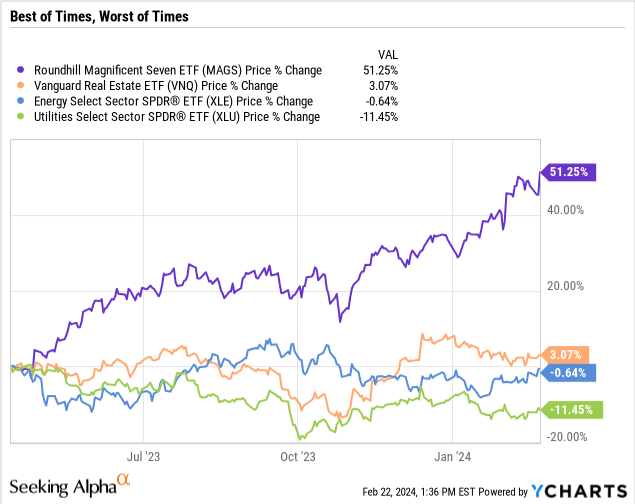
Technology stocks can underperform for long periods too.
We don’t think they offer a big enough margin of safety now that they’ve risen 100%, 200%, 300% or more. Price determines return in the long run. Paying 60x earnings or more for a company rarely leads to excess risk-adjusted returns. Do we wish we’d bought the Magnificent Seven coming out of the Covid recession? Sure. We did research Alphabet (Google), Amazon, Microsoft, and Meta Platforms (Facebook). We didn’t buy any of them. We didn’t buy any of them for the same reason Warren Buffet has avoided tech stocks for most of his investing career (Apple being a notable exception). There is too much uncertainty in the tech space. It’s impossible to know who the winners and losers will be 10 -years from now. Cisco used to be the largest company in the world. IBM was once a titan in the tech space. Apple was on the ropes in the mid-90s. Analysts were questioning its survival (pre-Steve Jobs return).
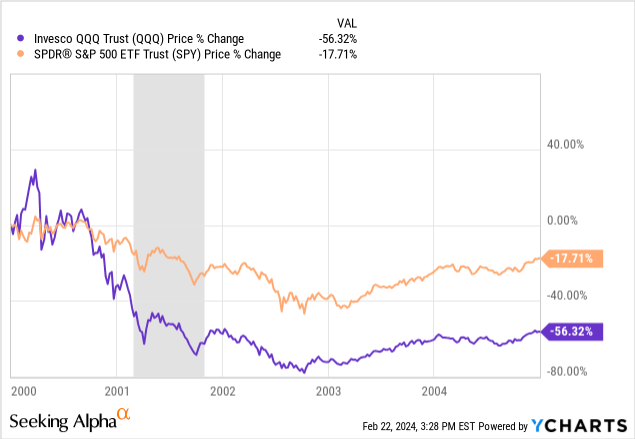
So yes, we'll buy tech companies if they are cheap enough. But not now. Not after the huge tech rally that got underway in the fall of 2022. Chasing performance always ends badly. Those folks that bought tech in 1999-2000 had to wait 18 years to match the return of the overall S&P 500. A diversified portfolio gives an investor the highest probability of hitting their return target. Value has a long track record of outperforming growth over 10-year periods. Chasing performance in a handful of stocks will increase volatility and reduce returns. That's the opposite of what we seek to achieve with our investing.
Regards,
Christopher R Norwood, CFA
Chief Market Strategist


