

Investors Should Not Get Too Excited
Market Update
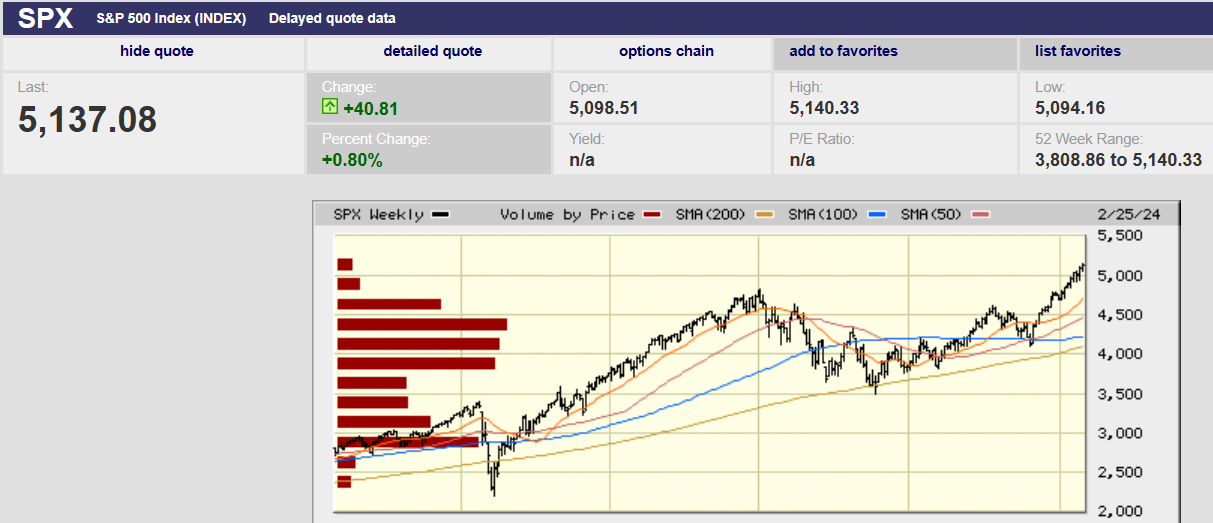
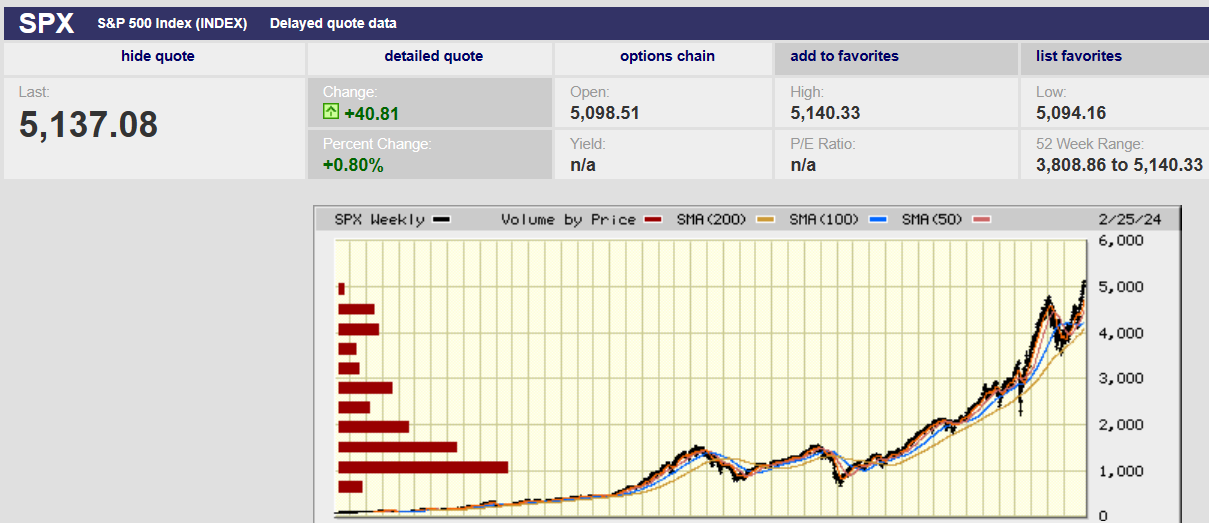
The S&P 500 rose 1% last week, closing at 5,137.17. It ended Friday just below the weekly high of 5,140.33 set earlier in the day. Closing near the high on Friday is a short-term bullish signal (next few days are likely to be up). It was another record close for the S&P. The Nasdaq hit a record high Thursday for the first time since November 2021. For all the hype and hoopla, the Nasdaq hasn’t gone anywhere in 27 months. The S&P is up only 6.6% since the all-time high set on 4 January 2022. It was showing a loss dating back to 4 January 2022 as recently as 18 January of this year. One run-of-the-mill correction and the S&P will be down again over a longer than two-year period.
The point is that people shouldn’t get too excited. They shouldn’t extrapolate the S&P recovery into the future as if further gains are guaranteed. Memories are short. Bad times are quickly forgotten. The excitement over artificial intelligence is building. Yet gains have been limited since late 2021. And interest rates are as high as they’ve been in over fifteen years. Tighter financial conditions will impact economic activity at some point. There are too many no profit businesses that have survived on free money. They aren’t generating enough free cash flow to cover their interest payments let alone pay off maturing debt. The challenge is figuring out when, and how much of an impact, a slowing economy will have on the stock market.
The market is stretched. The close today is 13% above the 200-day moving average. It is 5% above the 50-day moving average. A pullback to the 50-day moving average at 4,890 means a 5% decline. A 5% decline is a common occurrence. Yet investors may be shocked when the next correction arrives. They are feeling bulletproof because of a market that doesn’t seem capable of falling.
A recent survey from Investors Intelligence shows bulls outnumbering bears by the widest margin since late 2021, according to Barron’s. “This level of bullishness is nearly as good as it gets,” writes Barron’s. It suggests that parts of the market “look a little euphoric,” says Julia Hermann, global market strategist at New York Life Investments. Yet some investors are worried. Searches on Google for the words “stock bubble” have reached their highest level since January 2022. You’ll recall that the Nasdaq peaked in November of 2021 and the S&P in January of 2022.
Valuations, at 20.6 times 12-month forward earnings, are high relative to history. Torsten Sløk, chief economist at Apollo Global Management, notes that the median price/earnings ratio of the S&P 500’s 10 biggest stocks is higher than in 2020, 2010, and even the dot-com bubble peak in 2000, when it was about 25 times.
What might lead to a pullback? Tighter financial conditions for one. Financial conditions aren’t tight currently. Not really. The Fed funds rate is the rate that banks charge one another on overnight loans. It is the rate that the Federal Reserve directly controls. The funds rate indirectly affects interest on consumer products such as credit cards and mortgages. The funds rate hasn’t been at the current level of 5.25% since the summer of 2006. It hasn’t been above 5% on a sustained basis since 1999-2001. Financial conditions are tight if judged only by the federal funds rate.
Goldman Sachs thinks the link between short-term interest rates and GDP is broken. It believes a high Fed funds rate no longer equates to tight financial conditions. Goldman developed a financial conditions index of its own. It was created to better judge financial conditions and their impact on the economy. The Goldman Sachs financial conditions index is defined as a “weighted average of riskless interest rates, the (dollar) exchange rate, equity valuations and credit spreads. The factors are weighted to correspond to the direct impact of each variable on GDP. The Goldman Sachs Financial Conditions Index shows that financial conditions eased dramatically in November and December. Financial conditions have remained easy in January and February.
Bloomberg has developed its own financial conditions index. It tracks how easy or difficult it is to borrow money. It does this by “tracking the level of financial stress in the U.S. money, bond, and equity markets to assess the availability and cost of credit.” It is near its easiest level since late 2021, according to Barron’s. Financial conditions haven’t been looser than now in at least the past seven years, writes Evercore ISI strategist Julian Emanuel.
Loose financial conditions explain an economy growing above trend. It's true that fourth quarter GDP growth was revised down to 3.2% from 3.3% last week. That's still strong though. GDP grew 2.6% for all 2023, despite a high fed funds rate. The Fed believes 1.8% GDP growth is the non-inflationary rate of growth. It believes that wage growth needs to slow. Wages grew 5.7% in January year-over-year, too fast if 2% inflation is the Fed’s goal. Investors have their doubts. Inflation expectations are rising.
New Paragraph
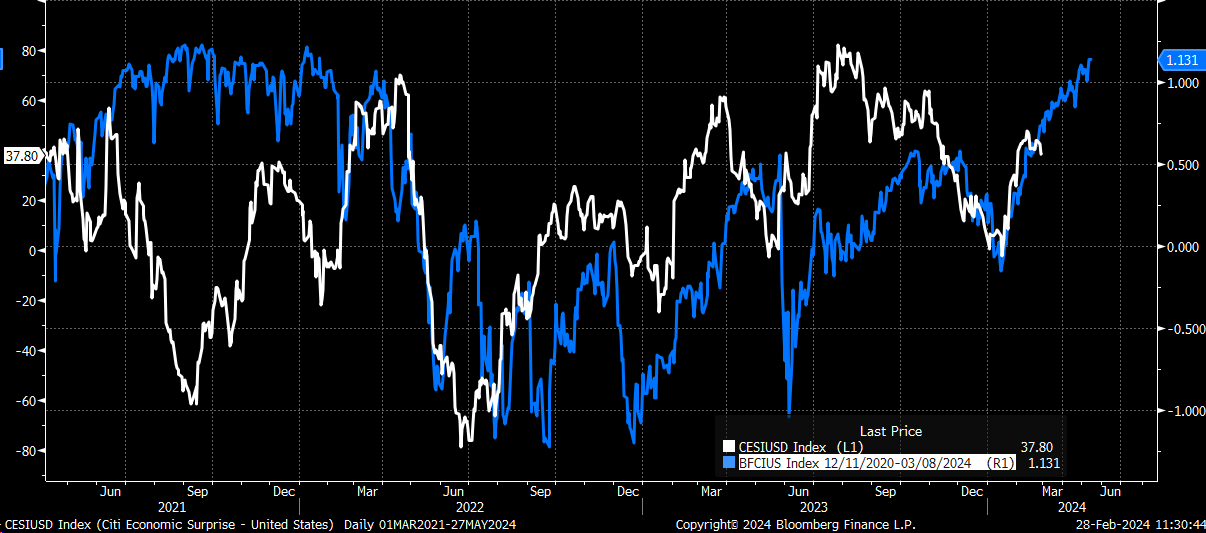
The chart above shows easing financial conditions and the Citi Economic Surprise Index.* The chart shows that easing financial conditions leads to better-than-expected economic data with a three-month lag. The chart shows we should expect the economic data to improve throughout the spring given easing financial conditions.
*The Citigroup Economic Surprise Index represents the sum of the difference between official economic results and forecasts. With a sum over 0, its economic performance generally beats market expectations. With a sum below 0, its economic conditions are generally worse than expected.
So, what might lead to a pullback in the stock market? Ultimately a slowing economy and corporate earnings growth that doesn’t meet expectations. The economy is unlikely to slow while financial conditions remain loose. Some combination of rising long-term interest rates, a falling stock market, widening credit spreads, and a stronger dollar is needed. A Fed funds rate at 5.25% - 5.50% hasn’t done the trick by itself.
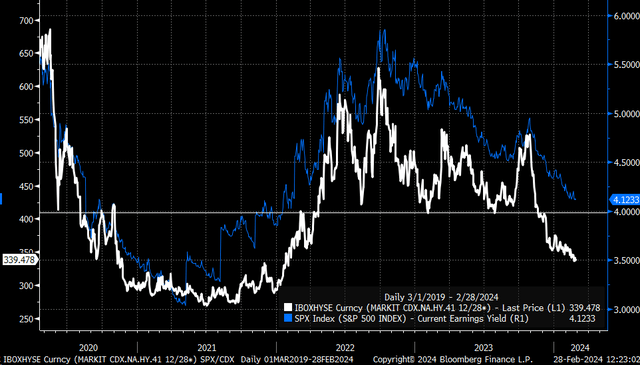
The earnings yield of the S&P 500 is the inverse of the PE ratio. It trades in sync with changes in credit spreads. The stock market's earnings yield falls when credit spreads are narrowing. The earnings yield rises (prices fall) when credit spreads are widening.
Stock prices show no sign of falling yet. That is unlikely to change until financial conditions tighten. Instead, we can expect continued economic growth. It is also possible that the inflation rate will stop going down. It might even start going up. Inflation plateauing or rising isn't priced into either the bond or stock market. Former Secretary of the Treasury Lawrence Summer recently said there is a "meaningful chance" the next Fed move will be a rate hike. It's not the most probable move, but it is a risk worth considering.
Economic Indicators
Consumer confidence fell in January from a six-month high. It was the first decline in four months. The index fell to 106.7 from a revised 110.9 according to the Consumer Conference Board. The decline in the consumer confidence index follows a weak retail sales number. Combined, the two reports might be foretelling a decline in consumer spending. So might the surge last year in credit card delinquencies. The rise in delinquencies indicates financial stress, according to the New York Fed. Delinquencies rose by more than 50% in 2023.
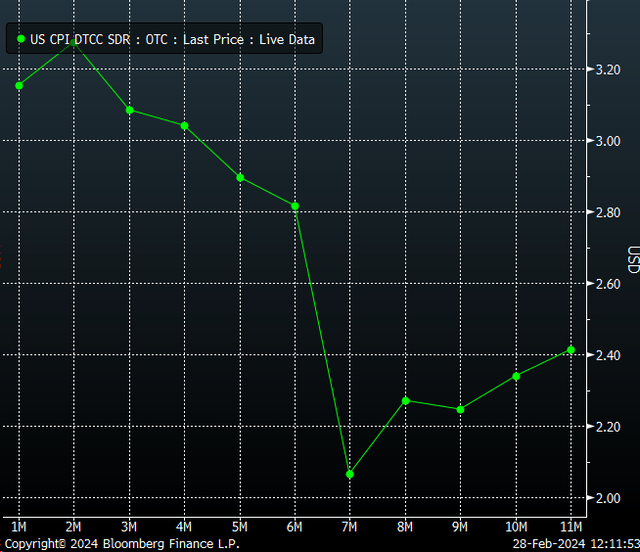
The big report last week was the Personal Consumption Expenditure (PCE) Index. Core PCE rose 0.4% in January. The forecast was for a rise of 0.1%. There are signs that inflation is falling at a slower pace.
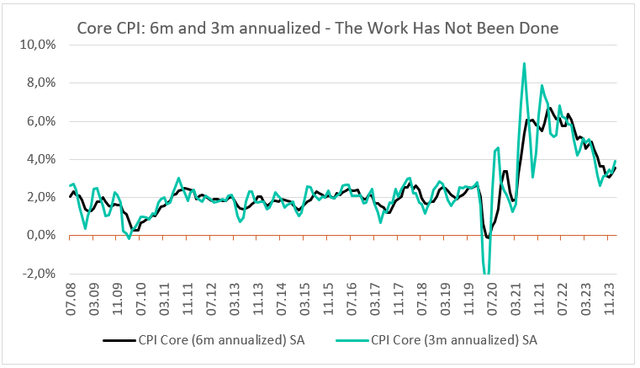
Whether looking at the CPI
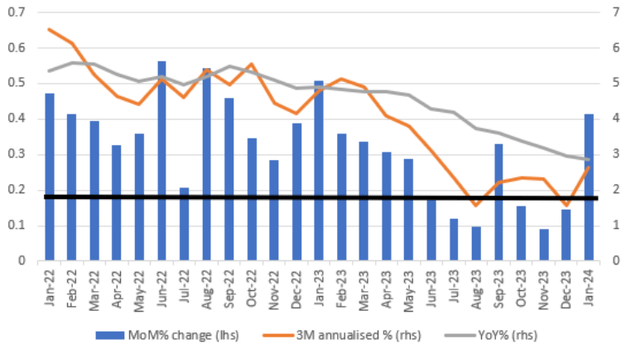
Or looking at the PCE
The inflation data supports Summer’s belief that the next Fed move could be a rate hike.
Stock Returns
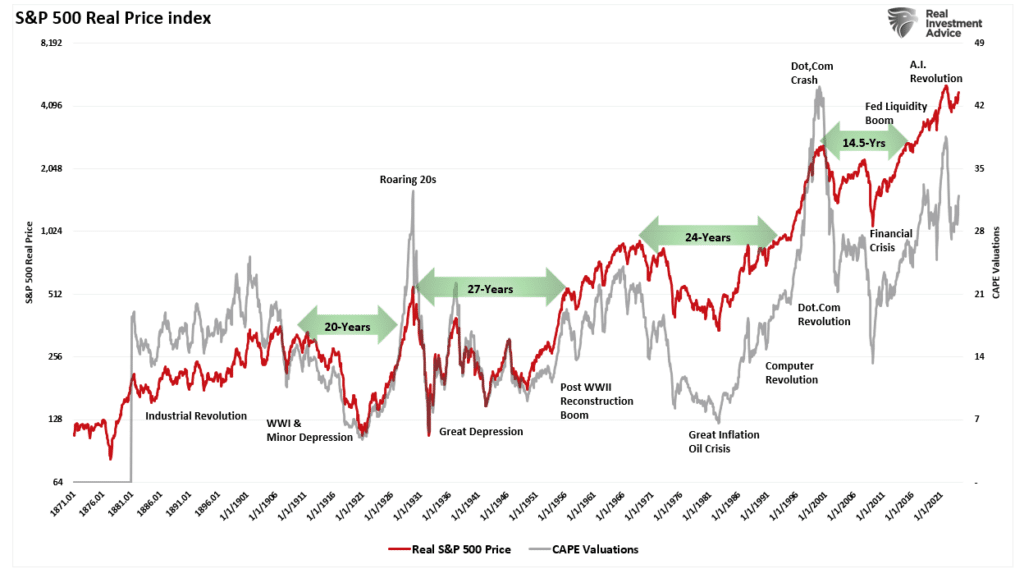
I had a couple of conversations last week about stock returns and return expectations. I showed a friend the chart below. It’s a chart of the S&P 500 going back into the 1980s.
The chart’s most important feature is the shape of the S&P 500 advance. It isn’t a constant slope trend (a straight line). Rather the rate of change is increasing. It is a parabolic move higher in stock prices. A trend line cannot continue to steepen forever without turning back on itself. The x-axis is time. Time does not go backwards. Should the slope of the line continue to increase we’ll eventually be left with a vertical line. Stock prices going to infinity in a single day. An impossibility. The current increasing slope of the trendline will stop increasing someday. It is a mathematical certainty.
In fact, parabolic moves in the stock market have always ended the same way, a correction back to a constant slope trend (a straight line). Why? Because the trendline represents economic growth. In America's case the economy has grown at around 6% per year for centuries. Revenue grows at around 6% and so do earnings. Profit margins are one of the most mean-reverting series in finance. Jeremy Grantham's famous quote expresses the why of it nicely. "…if profit margins do not mean-revert, then something has gone badly wrong with capitalism." Grantham went on to write that, "if high profits do not attract competition, there is something wrong with the system." It is a certainty that Nvidia's excess profits will be competed away. The only unknown is how long it will take for other companies to catch up to it.
The stock market can't continue to go up at an increasing rate. The value of a stock is based on earnings yield, earnings growth, and any change in the price investors are willing to pay for those earnings. Economic growth of around 6% per year means revenue growth of around 6%. Revenue growth of 6% means earnings growth of 6%. The inverse of 6% is 16.7x. It is no coincidence that the long-run average price-to-earnings ratio for the S&P is 16x to 17x earnings.
It all ties together. Stocks can't continue their parabolic move. It would take an ever-increasing rate of economic growth. It would take an ever-increasing rate of revenue and earnings growth. That's not going to happen. The market will correct back to trend. The parabolic move will end with a nasty bear market. Or it will end with a long period of zero returns.
Regards,
Christopher R Norwood, CFA
Chief Market Strategist


