

Quits Rate points to a weakening job market.
Payroll reports point to a strengthening job market.
Mixed Signals?
Market Update
The S&P fell 0.3% last week to finish at 5,123.69. The Nasdaq fell 1.2%. We wrote last week that, “Closing near the high on Friday is a short-term bullish signal (next few days are likely to be up).” We were right… at least for a few hours. The S&P pushed higher Monday morning, reaching 5,149.67 in the afternoon. The index started to fall around 3 p.m. It closed at 5,130.95, down 0.1% on the day. The S&P continued its decline on Tuesday, gapping down at the open. It eventually fell to 5,056.82 by late in the day.
The index rallied back Wednesday, Thursday, and the first part of Friday. It reached 5,189.26 in early trading Friday before reversing and falling to 5,117.5 by 1:30. Buyers stopped the decline and rallied the index back to 5,147 by 3 p.m. The advance ended when the algorithms started selling in the last hour of trading. The S&P closed near its lows for the day. The last hour of trading is dominated by the smart money, according to Wall Street lore. Friday’s action points to a down open on Monday.
The aimless back and forth that was last week’s trading seems to show that investor exuberance is exhausted for the time being. Not even the payrolls report could generate a clear direction for long. The market did rise at the open on Friday following the better-than-expected report. It gave the gains back throughout the rest of the day though. Friday’s close was near Thursday's open. Two days of going nowhere for stocks.
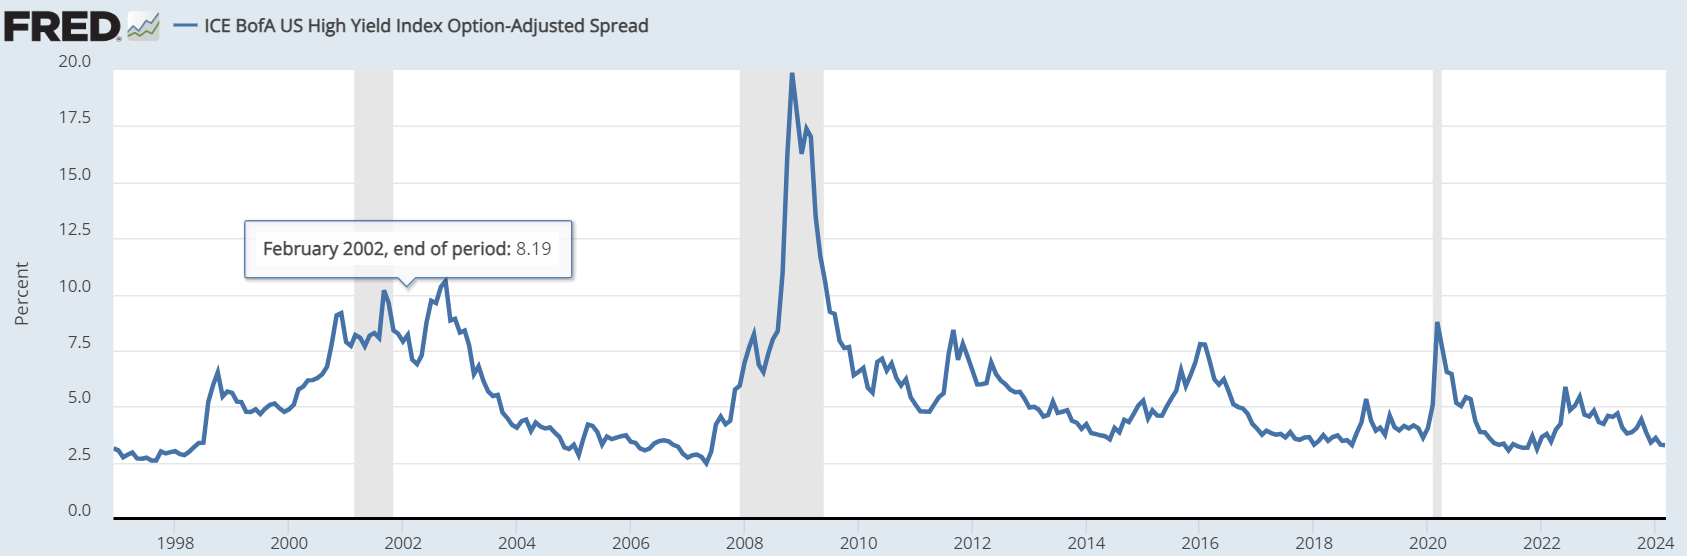
Bond yields went somewhere last week. They fell. The 10-year ended the week yielding 4.08%, down from 4.22% the prior Friday. The two-year bond ended the week yielding 4.48%, down from 4.53% the prior week. The ICE BofA US High Yield Index ended the week at 3.27%. The index measures the yield difference between Treasuries and high-yield bonds. The spread has been lower only four times since 1997.

Lower long-term rates and tighter credit spreads mean easier financial conditions all else equal.
The economy grew 2.5% in 2023. The consensus is for it to grow 2.1% in 2024 and 1.7% in 2025. The Fed sees it growing 1.4% in 2024. Its forecast is well below consensus. Add a 2.5% inflation rate to the real GDP growth forecasts and nominal GDP is expected to rise 4.6% in 2024 and 4.2% in 2025. Earnings are forecast to grow 11% in 2024 and 13% in 2025. Earnings won’t grow faster than revenue without margin expansion. Margins are above average already. Nevertheless, net profit margins are forecast to rise to 11.7% in Q1 2024 and 12.1% in Q2 2024.
It's hard to believe in double-digit earnings growth given nominal GDP growth in the mid-4% range. The Fed is expected to cut rates four times in 2024, beginning in June. It would be unprecedented if the Fed did cut four times in 2024. The stock market is hitting new highs. Corporate profits are at record highs. Inflation is still above the Fed’s target. And the economy is growing above the 1.8% rate the Fed considers non-inflationary. Ed Yardeni of Yardeni Research says, “If the Fed is really as data dependent as it says, there is no good reason for a rate cut at all.”
Norwood Economics is forecasting a 10% to 15% pullback in the next quarter or two. The stock market is expensive. It is also overbought. Forecasting a correction is hardly a bold call. Stocks have averaged a 10% drop once per year on average since 1929.
On the valuation front, Savita Subramanian pointed out last week that the S&P 500 is more expensive than average based on 19 of 20 metrics she tracks. Subramanian is head of U.S. equity and quantitative strategy at BofA Securities. Still, she raised her year-end target for the S&P to 5,400 from 5,000. Expensive markets can become more so. The Cyclically Adjusted Price-to-Earnings ratio (CAPE) is 34. It is double its historical average of 17 although not yet to the 2000 peak of 44.
Investors might see the S&P 500 at 5,400 sometime this year. Valuation is a poor timing mechanism. Other factors such as momentum can dominate valuation in the short term. High valuations do increase an investor’s risk though. Currently some 10% of companies in the Russell 1000 index trade for 10 times sales or more. Investors expect a return on their investments. Investor wealth is generated through corporate earnings not fluctuations in stock prices. Companies trading above 10x sales almost never generate sufficient profits to adequately compensate investors.
As for overbought, the S&P is 12% above its 200-day moving average which is at 4,560. That is stretched. The index was 9% above the 200-day at the start of 2022. The S&P 500 was down as much as 27% in 2022. As of March 1, the S&P 500 had climbed in 16 of the prior 18 weeks. It is the first time that has happened in 53 years, according to Deutsche Bank’s Jim Reid.
Sentiment is also hitting bullish extremes. Bullish and Bearish extremes are contrarian indicators. Too much bullishness often leads to market declines. Likewise, too much bearishness often leads to stock market rallies.
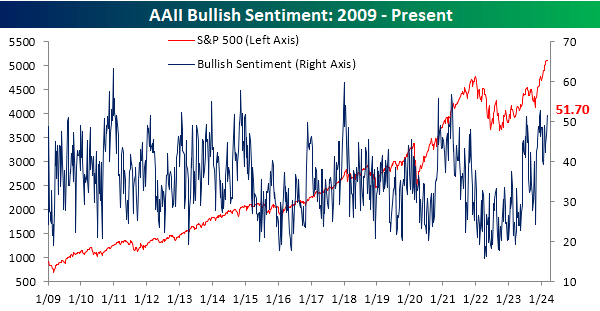
The latest AAII Sentiment Survey showed more than half of respondents surveyed are bullish. At 51.7%, bullish sentiment is just below the multi-year high from December 2021.
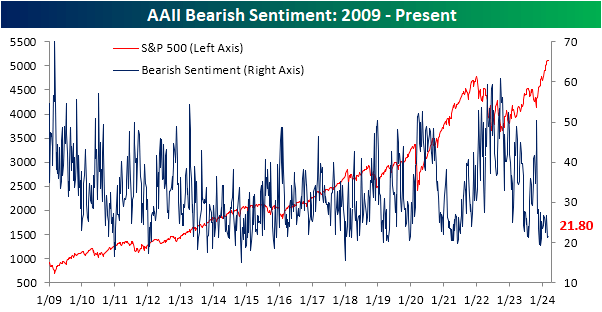
Bearish sentiment fell to 21.8% in the latest AAII survey.
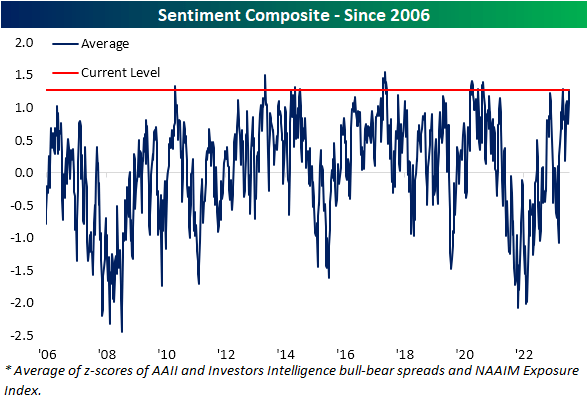
The AAII sentiment composite now ranks in the 98th percentile of all periods since data began in 2006. There are only a handful of other periods of similar elevated sentiment.
Some market internals are signaling possible trouble ahead as well. The fall on Tuesday was broadly based, Craig Johnson, chief market technician at Piper Sandler, told Barron’s. Declines outnumbered advances by 1.4 to 1 on the New York Stock Exchange. Declines outnumbered advances by 1.8 to 1 on the Nasdaq. Also, more than 50% of stocks are currently in downtrends, according to Johnson. “The weakening of internals and breadth, combined with recent overbought conditions, suggest that the market is overdue for a pullback or consolidation,” he explained to Barron’s.
The S&P has had six dips ranging from 1.7% to 5.8% since last October. It’s due for a bigger pullback. There will need to be a catalyst though. Easy financial conditions will keep the stock market rising despite overbought conditions otherwise.
Economic Indicators
Economic reports last week showed growth in the economy and a strong labor market. The ISM services index for February was 52.6%. It was 53.4% the prior month. Anything above 50% is growth. The report showed new orders rising to a six-month high. New orders are a leading indicator. Production accelerated with business activity hitting a five-month high of 57.2. Business activity was 55.8 in January. "The underlying trend suggests that services inflation will remain on a downward trend in the first half, with some risk that it may not cool as quickly as Fed officials would like," said Oren Klachkin, financial market economist at Nationwide.
The jobs report was the big news last week. Nonfarm payrolls rose a better-than-expected 275,000 in February. The forecast was for 198,000. The prior jobs number was revised down but still produced 229,000 jobs in January. The 90% confidence interval for the jobs report is 130,000. That means that jobs increased between 145,000 and 405,000 with 90% confidence in February. High-end or low, the labor market is strong. In fact, hiring appears to be picking up. The three-month moving average has begun to rise over the last few months.
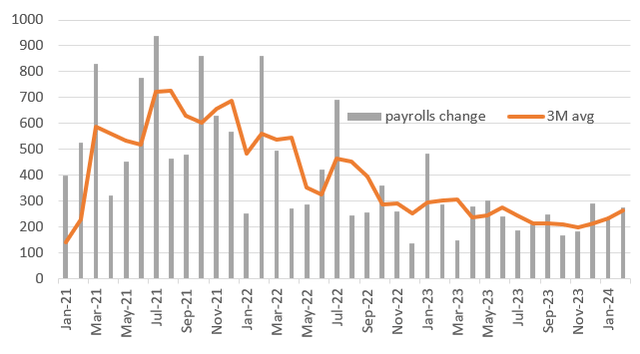
The economy needs to create 100,000 jobs to absorb entrants into the workforce.
The Quits Rate is telling an opposite story though. It has been trending lower since April 2022. The Quits Rate measures the number of workers quitting their job before finding a new one. A higher Quits Rate suggests jobs are plentiful. A lower Quits Rate suggests jobs are scarcer.

The Quits Rate is correlated to the Employment Cost Index (ECI).
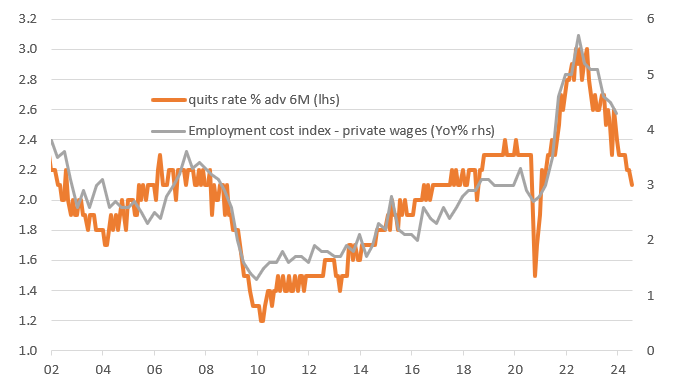
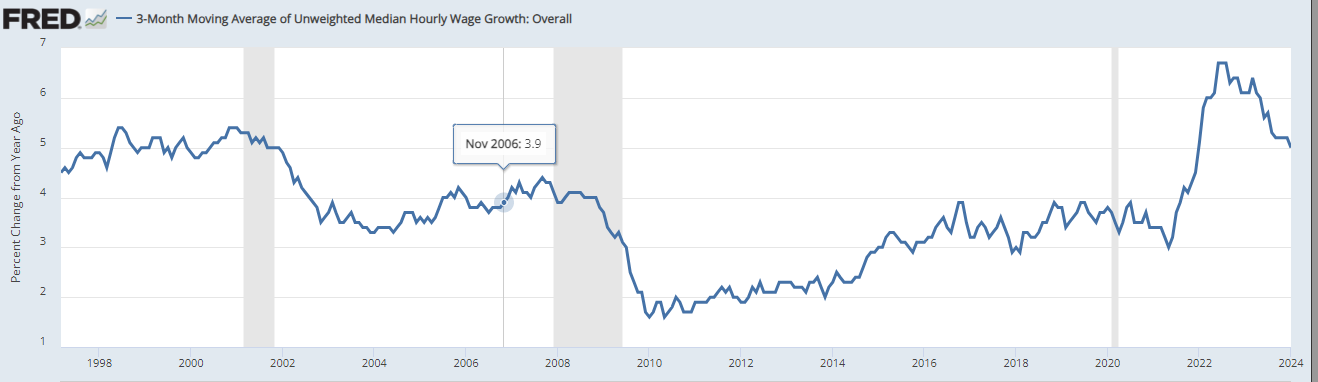
The chart above shows the quits rate relationship with the employment cost index. The ECI is the broadest measure of labor costs since it includes bonuses and benefits. The falling quits rate suggests falling labor costs, despite payroll numbers starting to trend higher. The Federal Reserve is watching wage growth closely. Wage growth must continue to slow for inflation to fall to 2%. Evidence is building that wage growth is doing just that.
A soft landing may lie in our future. There is no sign of an economic slowdown yet though. A no landing scenario is possible. Bond yields will move higher in that case. On the other hand, a hard landing looks like a soft landing until it doesn’t. Investors are likely to fear that a soft landing is becoming a hard landing sometime later this year. That assumes the economy does begin to slow. Investor fear of a hard landing might be what triggers a correction in the stock market.
Like Minded
I had intended to write about the long-term economic impacts of pandemics. The short version is that pandemics depress economic growth for decades. The neutral interest rate falls as a result. The neutral rate is the rate that neither stimulates nor retards the economy. The current real rate is around 1.8%. The Fed says the neutral rate is 0.5%. An increasing number of economists believe the neutral rate might be as high as 1.5%.
Regardless, the Fed needs to lower rates at some point, or the economy will fall into recession. The economy is more likely to fall into recession if the neutral rate is 0.5% than 1.5%. That’s true because monetary policy is currently tighter if the neutral rate is lower. The lingering effect of the pandemic means the neutral rate is more likely closer to the Fed’s estimate. It’s possible that the neutral rate is less than 0.5% due to the impact of the pandemic. The bigger the difference between the real rate and neutral rate the more likely we are to have a recession. That's because monetary policy is tighter when the difference is larger.
I’ll save the pandemic research for next week. Instead, I’m going to pass on some comments from a financial advisor in Montana. The advisor was interviewed in Barron’s for this week’s issue. What struck me about the interview is how similar are our views. It’s nice to get confirmation that someone else is on the same page as Norwood Economics.
Jim Stack is the founder of the Montana Investment Advisor. He believes in “safety first” money management and concierge client service. We couldn’t agree more. The RIA has $1.8 billion under management.
Stack told Barron’s that “We’re dealing with a stock market that is in uncharted territory. We have never had recession warning flags flying as high as they are now—like the leading economic index down for 23 consecutive months. That’s the second-longest in its 60-year history. The only time longer was the financial crisis.”
He went on to list three “inherent systemic risks” today. The first is valuation. He points out that “no matter what valuation metrics you look at, we’re in the 90th percentile. That means that stocks have been more overvalued less than 10% of the time. This isn’t a low-risk market in terms of price.”
“The second risk one can’t overlook is the concentration of performance in the big-cap momentum stocks, the Magnificent Seven, the AI-driven frenzy,” he told Barron’s. Rapid rises in a narrow segment of the stock market have ended badly in the past. Stack says the concentrated performance is, “...bringing back a lot of the same feelings to market historians that they saw in the dot-com bubble of the late ’90s”. Norwood Economics would add the Nifty-Fifty era as well.
The third risk is the potential bubble in real estate, Stack believes. Commercial real estate is struggling. “Vacancies are running at 20%,” he tells Barron’s. “There’s $1.2 trillion in mortgages on commercial real estate that has to be refinanced this year and next at much higher rates.” We’ve pointed that out in a recent newsletter as well. Stack goes on to say, “We have a residential real estate problem. Whether it’s a bubble or not, unaffordability is worse than it was in 2005”.
Stack’s company is overweight consumer staples, healthcare, and value stocks. Norwood Economics is as well. Stack’s company focuses on intrinsic value. Norwood does as well. We seek to buy good companies on sale. The on-sale part keeps us out of trouble with the high-flying stocks. All too often investors chasing turbo-charged returns end up like Icarus. They fly too close to the sun and plunge to earth after their wings melt.
Regards,
Christopher R Norwood, CFA
Chief Market Strategist


