

The economy is strong, inflation rate is still high
Fed may trim its rate cut forecast
Market Update
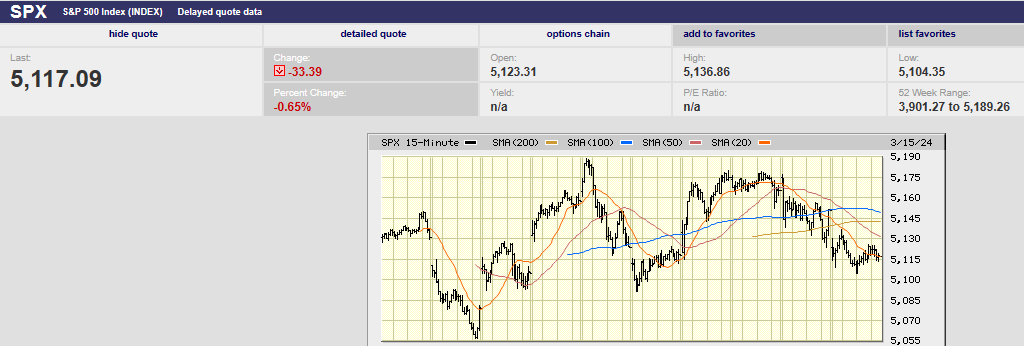
The S&P 500 fell 0.1% last week to 5,117.09. We wrote in our last newsletter that, “Friday’s close was near Thursday's open. Two days of going nowhere for stocks.” Make that seven days of going nowhere for stocks now.
10 day S&P chart
The index low Friday, March 8th was 5,117.50. It closed the following Monday at 5,117.94. The S&P peaked on Tuesday at 5,179.87. It hit 5,179.14 Wednesday, and 5,176.85 on Thursday. The index declined from Thursday’s high to the 5,117.09 close on Friday, six points below the prior Friday close. It was also less than half a point away from the low on Friday the 8th. A whole lot of nothing over the last seven trading days in other words.
We wrote last week that, “Friday’s action points to a down open on Monday.” We did get the down open. But the index bottomed at 5,091.14 in the first hour of trading Monday. It then moved higher for the next two and a half days before giving most of it back Thursday and Friday.
The two-year Treasury yield rose last week. It ended Friday at 4.77%. The two-year most closely tracks the Fed funds rate. It is up around 37 bps in 2024 as investors grudgingly adjust to the Fed’s higher for longer policy. The 10-year rose to 4.32%. The 10-year Treasury has the biggest impact on the 30-year fixed mortgage rate.
Friday’s low touched the 20-day moving average. We will see this week if the 20-day remains support or gives way. A decline below the 20-day may be the beginning of a correction. The market is overdue for a pullback. The Federal Reserve meeting this week might be the catalyst.
There is a 98% chance the funds rate will remain where it is at 5.25%-5.50%. Guidance is the unknown for the March meeting. Investors began the year expecting six rate cuts with the first in March. Now the futures market is forecasting the first cut in either June or July. The CME FedWatch tool assigns a 55.2% probability of a cut in June. It assigns a 75.9% probability of a funds rate at or below 5.00%-5.25% after the July meeting. The FedWatch tool assigns a 69.6% probability that the Fed will cut three times or less in 2024.
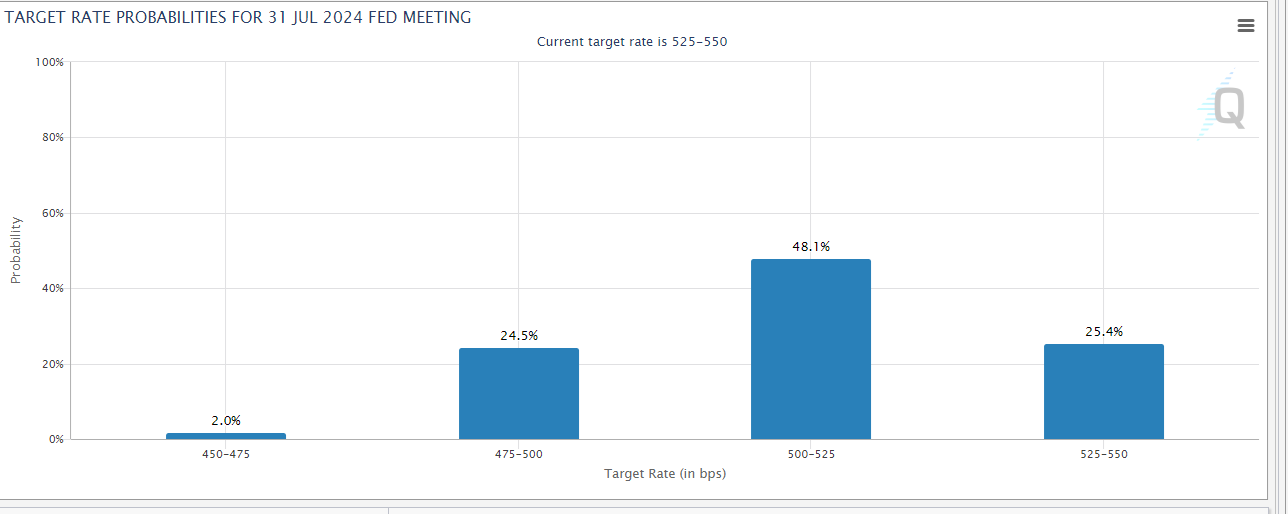
There are a growing number of economists who believe the Fed might only cut twice in 2024, if at all. The Fed’s Summary of Economic Projections (SEP) gets an update this week. The SEP is showing three projected rate cuts in 2024. A change to two or fewer projected cuts might be enough to trigger a correction. There’s a good chance the S&P will test last Monday’s low of 5,091.14 Monday morning. There’s a better than 60% chance the 20-day will give way leading into the Fed’s Wednesday meeting. The Fed continuing to forecast three rate cuts likely leads to a renewed rally. A Fed signaling fewer rate cuts in 2024 will likely lead to higher long-term rates. Higher long-term rates will likely trigger a pullback in stocks. The 50-day moving average at 4,955 is a reasonable target for the algorithms.
Why might the Fed trim its rate cut forecast from three to two?
Stronger-than-expected economic growth is reason number one. The economy has continued to grow strongly. Real GDP rose 2.6% last year. It grew at a 4% annualized rate in the second half of 2023. The Atlanta Fed’s Nowcast for the first quarter is at 2.5%. The Fed believes growth above 1.8% is inflationary. It's reasonable to assume the Fed will worry that inflation won't fall to 2% if economic growth stays above 1.8%.
Inflation numbers that aren’t falling quite as fast as before is reason number two. Last week’s hotter-than-expected consumer and producer price index reports were bad news. The three-month annualized rate of the Fed’s so-called super core measure of inflation accelerated from 2.2% in December to 4.1% in January. Also, not good news for a data dependent Fed. The super core measure tracks service prices less housing costs.
The notion that monetary policy is tight stems from the belief that the neutral rate is 0.5%. The neutral rate is the rate that neither stimulates nor retards economic growth. The funds rate is at 5.25% - 5.50%. The nominal neutral rate, assuming 2% inflation, is 2.5%. A funds rate almost 300 basis points (3.00%) above the neutral rate is restrictive. A neutral rate of 3.5% to 4.0% including inflation is much less restrictive. The fact that the economy continues to grow strongly suggests that the neutral rate is higher than the Fed thinks.
Some members of the Federal Reserve are starting to discuss whether the neutral rate is higher than 0.5%. Minneapolis Fed President Neel Kashkari for one has begun questioning the Fed's belief that the neutral rate is 0.5%. Research from the Bank for International Settlements (BIS) finds that the neutral rate may have risen by as much as 1.5%, according to Barron’s. A higher neutral rate means less urgency for the Fed to cut rates. A higher neutral rate would also help explain why the economy isn’t slowing as fast as the Fed thought it would.
Of course, another reason the economy isn’t slowing might have to do with loose financial conditions. We wrote two weeks ago about Goldman Sachs belief that the link between the Fed fund’s rate and GDP is broken. Both Goldman Sachs and Bloomberg believe financial conditions are loose based on their models.
The Fed meets this week. Investors may see a sharp rise in volatility, especially compared to the last seven trading days.
Economic Indicators
The core CPI report was hotter than expected last week. The February number came in at 0.4% above the expected 0.3%. The CPI report also came in at 0.4%. It was the largest increase in CPI in five months. Higher gas and housing costs were the main culprits in the hot print. The PPI and core PPI were above expectations as well. PPI rose 0.6% in February above an expected 0.3%. The core PPI rose 0.4%, above the expected 0.2%. The producer price index leads the consumer price index.
Meanwhile, U.S. retail sales rose 0.6% in February. Retail sales were weaker than expected but well above January’s negative 1.1%. Sales gained the most since September. Economists said that a healthy labor market is adding to incomes and fueling spending, according to MarketWatch.
The decline in the inflation rate is slowing, perhaps even reversing. February’s consumer price index showed core inflation at 3.8% year-over-year. It has accelerated to an annualized 4.2% over the past three months. Also, the economy is growing strongly. Nothing in last week’s economic reports gives the Federal Reserve reason to start cutting rates. Nor did anything give the Fed reason to believe it would need to start cutting rates this summer. A more hawkish than expected announcement on Wednesday is a risk. Reducing the number of cuts to two or less could trigger a correction.
Pandemics, ZIRP, Deglobalization, and Demographics
Economics is a soft science. It’s not like physics with its immutable laws. There is no law of gravity, no constants such as the speed of light. Economies are complex systems with many feedback loops. Economies are dynamic, always changing. Humans are involved and humans learn. The growing debate about the neutral interest rate is an example of the fuzziness that surrounds the field of economics. Identifying the neutral rate is key to conducting appropriate monetary policy. Yet economists aren't sure whether the rate is 0.5%, 1.5%, or neither.
The neutral rate is an important concept. It is the fed funds rate that neither stimulates nor retards economic activity. The Federal Reserve bases its monetary policy on the neutral rate. The Fed currently believes the neutral rate is 0.5%. A growing number of economists believe the neutral rate has risen to 1.5%. These economists suggest that Fed policy isn’t as tight as the Fed believes.
The opacity surrounding monetary policy gets even worse. It's possible the neutral Fed funds rate no longer matters. Gravity no longer works. The speed of light has changed. Goldman Sachs believes the link between the Fed funds rate and GDP is broken. It has developed a financial conditions model that doesn't include the funds rate. Goldman believes a weighted average of riskless interest rates, the exchange rate, equity valuations and credit spreads is better at predicting economic activity. Bloomberg has its own financial conditions model.
Still, the neutral rate is central to monetary policy. But it is not a constant. There are structural changes in the economy that can muddy the waters. Structural changes can influence the neutral rate.
Pandemics can have a significant and lasting economic impact. Those impacts can change growth rates and the neutral rate. Jorda, Singh, and Taylor published a working paper in June 2020 on the longer-run economic consequences of pandemics. Jorda is with the Federal Reserve Bank of San Francisco. Singh and Taylor are at the University of California, Davis. The authors studied the history of pandemics going back to the 1400s. They found that major pandemics had long-lasting economic effects. In particular, real rates of return on assets were depressed for decades following major pandemics. Slower economic growth was attributed primarily to labor scarcity and a shift to greater precautionary savings. The neutral interest rate would be lower in a low return, slower growth environment.
The authors found that, “Following a pandemic, the natural rate of interest declines for years thereafter, reaching its nadir about 20 years later, with the natural rate about 150 bps (1.5%) lower than had the pandemic not taken place.” Of course, there is doubt about whether Covid reached the level of a major pandemic. There is also doubt about whether pandemics have as great or long lasting of an impact on a modern economy. Technology might now be able to replace the lost labor faster than in 1400.
Then there is research by the Bank for International Settlements. It has found indications that the neutral rate may have risen by as much as 1.5%. The BIS sites the reversal of four major depressants for the neutral rate in the 2010s. It also points to two important changes in the structure of borrowing. The depressants were: overleveraged households; trade liberalization and the resulting global savings glut; slow U.S. population growth; and capital light business investments. All four of these neutral interest rate depressants are no more according to the BIS.
Also, two changes in the structure of borrowing are pushing the neutral rate higher. First, households and corporations have locked in low interest rates. Household interest payments are less than 10% of disposable income as a result. That means the Fed must make borrowing even more expensive for it to adequately impact the economy. The neutral rate must be higher in other words. Second, increased investment is needed to adjust to changing globalization and technology. Increased investment is also needed to adjust to changes in fiscal policy (think big deficits). Increased investment can lead to faster productivity growth. Faster productivity growth in turn leads to a higher neutral rate.
Economics is indeed a soft science. Truman’s famous quip comes to mind. Out of frustration he'd reportedly asked for a one-armed economist. He'd grown tired of his economic advisors telling him that "On the one hand.... On the other hand".
Does the neutral rate fall some 150 bps for the next twenty years or so because of the Covid Pandemic? Jorda, Singh, and Taylor’s research into pandemics suggest that is a possibility. Or does the neutral rate rise by 150 bps due to the reversal of four major depressants and changes to the structure of borrowing? The BIS believes that may be the case. It's possible that they offset one another, and the neutral rate is unchanged.
The takeaway for investors is to tread cautiously. Avoid overconfidence. Accept that uncertainty is high and diversification even more important than normal. Understand that the Fed is flying blind. It is famously bad at forecasting. It has a history of making bad monetary policy as a result. The Fed's micromanaging will lead it to make another major policy blunder. Capital markets and the economy will pay the price when it does.
Regards,
Christopher R Norwood, CFA
Chief Market Strategist


