

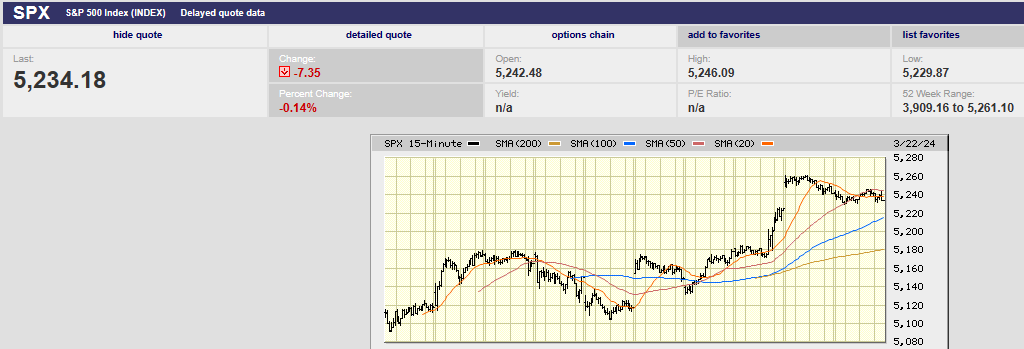
10 day S&P 500 chart
Is the Fed really data dependent?
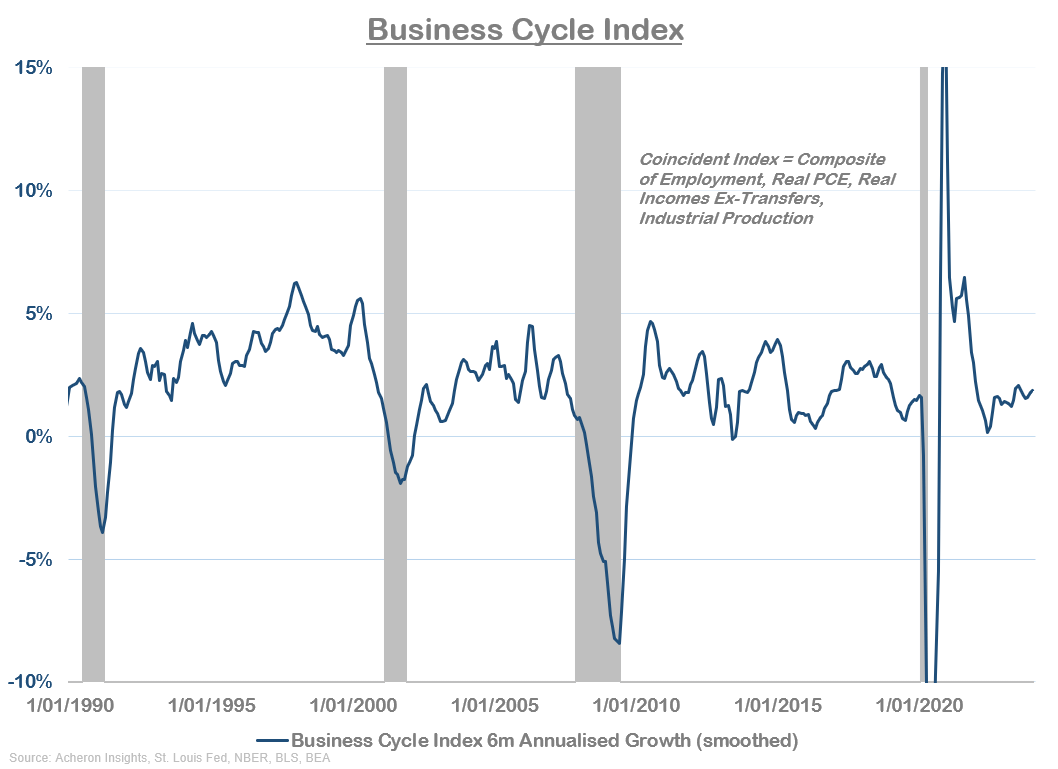
The data points to a strong economy.
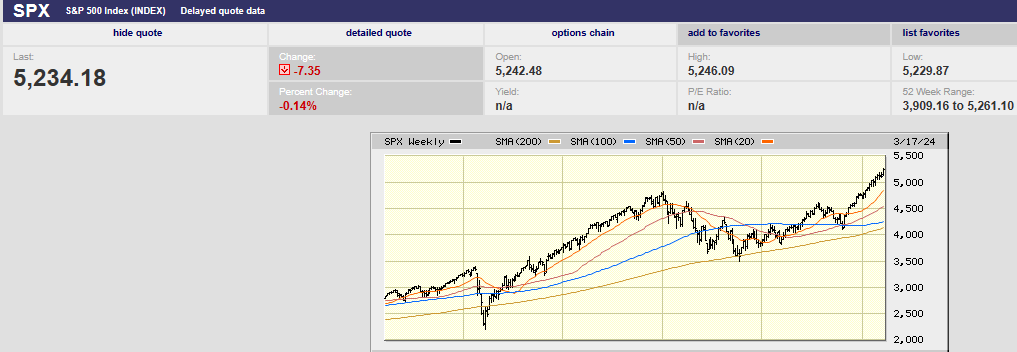
5 year S&P 500 chart
Market Update
The S&P 500 rallied again last week. It rose 2.3% to close at 5,234.18. Investors were first anticipating and then responding to a dovish Federal Reserve. The Fed met Tuesday and Wednesday. It released its updated “dot plot” during the meeting. Powell’s press conference was described by the financial media as dovish. The Fed, “all but green-lighted lower policy interest rates in coming months in the expectation that inflation will continue to make downward progress,” wrote Barron's. “Policymakers really, really, really want to cut rates, and it is not a matter of if but how soon,” wrote Mizuho Securities economists Steven Ricchiuto and Alex Pelle in a client note.
The two-year Treasury yield fell to 4.60% from 4.77%. The 10-year Treasury yield fell to 4.20% from 4.32%. Bond investors seemed to agree that the Fed was sending dovish signals. The CME FedWatch tool shows a 66.7% chance of a quarter-point cut in the funds rate in June. There’s a 75.6% chance that the rate will be at 5.00% - 5.25% or lower by then.
Powell suggested Wednesday during his news conference that financial conditions were tight. His assessment was likely based on high real interest rates, wrote Jonas Goltermann, deputy chief markets economist at Capital Economics. The Fed believes the real neutral rate is 0.5%. Its inflation goal is 2%. Powell's assessment of financial conditions is likely based on the belief that 2.5% is the nominal neutral rate. The Fed funds rate is currently 5.25%-5.50%. Real interest rates are high across the Treasury yield curve if the nominal neutral rate is 2.5%. The Fed is pinning its financial conditions assessment on an unobservable number, the neutral rate. It is ignoring a slew of market signals that point toward loose financial conditions. Real interest rates may not be high at all if the neutral rate is higher than the Fed believes. There are a growing number of economists who no longer believe the real neutral rate is 0.5%. They think it might be as high as 1.5%.
Powell’s suggestion that financial conditions were tight wasn’t based on the data. The stock market is hitting new highs. Credit spreads are tight. The dollar is strong and long-term riskless rates are below short-term rates. Oh, and gold is having a pretty good run these last five months. It is up around 33% since it bottomed in late September. Market-based data is screaming that financial conditions are loose.
There is an excess of liquidity sloshing around in the financial system. The Fed increased its balance sheet by around $5 trillion during the Covid crisis. It's shrunk its balance sheet by around $1.4 trillion since it began Quantitative Tightening in 2022. True, the economy has grown since, but nowhere near enough to absorb the excess liquidity. Also, the Chicago Fed Financial Conditions index has been loosening since early 2023.
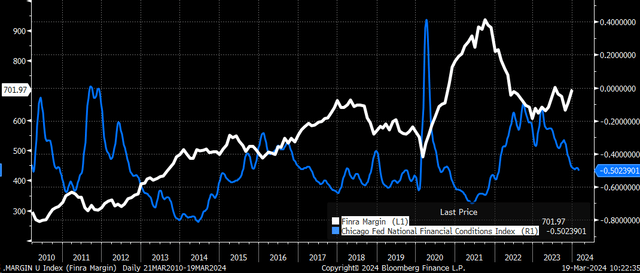
The inverse relationship between financial conditions and leverage is easy to see.
It’s obvious that looser financial conditions lead to more leverage in the system. The inverse relationship between financial conditions and leverage is easy to see. The easing of conditions since March 2023 has allowed leverage to enter the market. The tightening of conditions between May 2021 and October 2022 led to less leverage.
Financial conditions are not tight. Rising financial leverage is one indicator. The Goldman Sachs financial conditions index is another. Bloomberg’s financial model points to loose conditions also. The Fed is not being truthful with the public. It claims it is data dependent but the data points to strength in the economy.
The Consumer Conference Board Coincident Economic Index rose by 0.2% in February. It is up 1.1% over the six-month period ending in February. That is faster than the 0.8% increase in the previous six months. Payroll employment, personal income-less transfer payments, manufacturing and trade sales, and industrial production are included among the data used to determine recessions. All four components were positive last month. Meanwhile, the Board's Leading Economic Index (LEI) rose 0.1% in February. It was its first increase in two years.
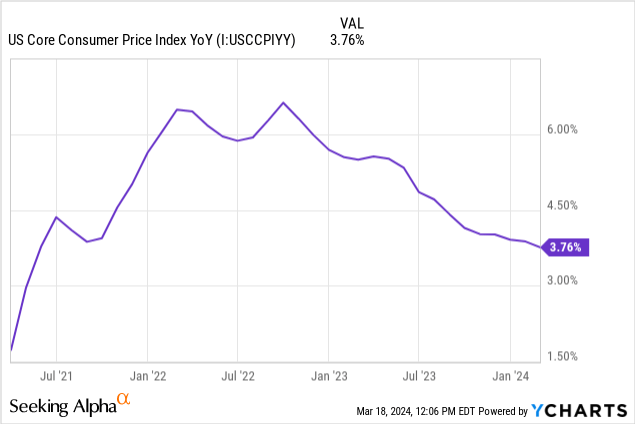
The Fed claims it is data-dependent but the data points to the disinflation trend slowing. The rate of disinflation is slowing with inflation well above the Fed’s target. There is no guarantee that the inflation rate will continue to fall.
The stock and bond market interpreted Powell’s comments as dovish. The updated dot plot doesn’t support a dovish interpretation. According to the “dot plot” gross domestic product is forecast to grow 2.1%, measured fourth quarter to fourth quarter. The prior forecast was 1.4%. The 2.1% growth forecast is above the Fed’s estimated non-inflationary rate of 1.8%. The core personal consumption expenditures index, which excludes food and energy, is expected to rise 2.6% this year, up from a 2.4% forecast before. The year-end jobless rate is projected to be 4.0% by year-end 2024, down from a forecast 4.1%. The jobless rate is still near 50-year lows.
The S&P 500 is up 33% and home prices up 6% from a year ago. The Evercore ISI’s economics team calculates that consumer net worth is up 9% in the first quarter from a year earlier, according to Barron’s. Its proprietary survey of Realtors also shows robust home price growth. “It would be unusual for a recession to start with house prices this strong,” Evercore wrote to clients. Yet the Fed continues to expect three rate cuts in 2024, despite higher growth and inflation forecasts. That doesn’t sound like data dependency.
It’s worth repeating. The Fed expects to cut three times in 2024. It expects to make those cuts even as it forecasts a stronger economy, stronger labor market, and higher year-end inflation. Not all Fed members are expecting three cuts, however. There are 9 FOMC members who see rates higher than the median - 2 of them predicted no cuts in 2024, 2 predict only 1 cut, and 5 predict 2 cuts this year. The Fed’s dot plot results are median forecasts not consensus forecasts. The “dot plot” shows each individual member’s forecasts. There is disagreement among members. Rates may remain higher for longer yet.
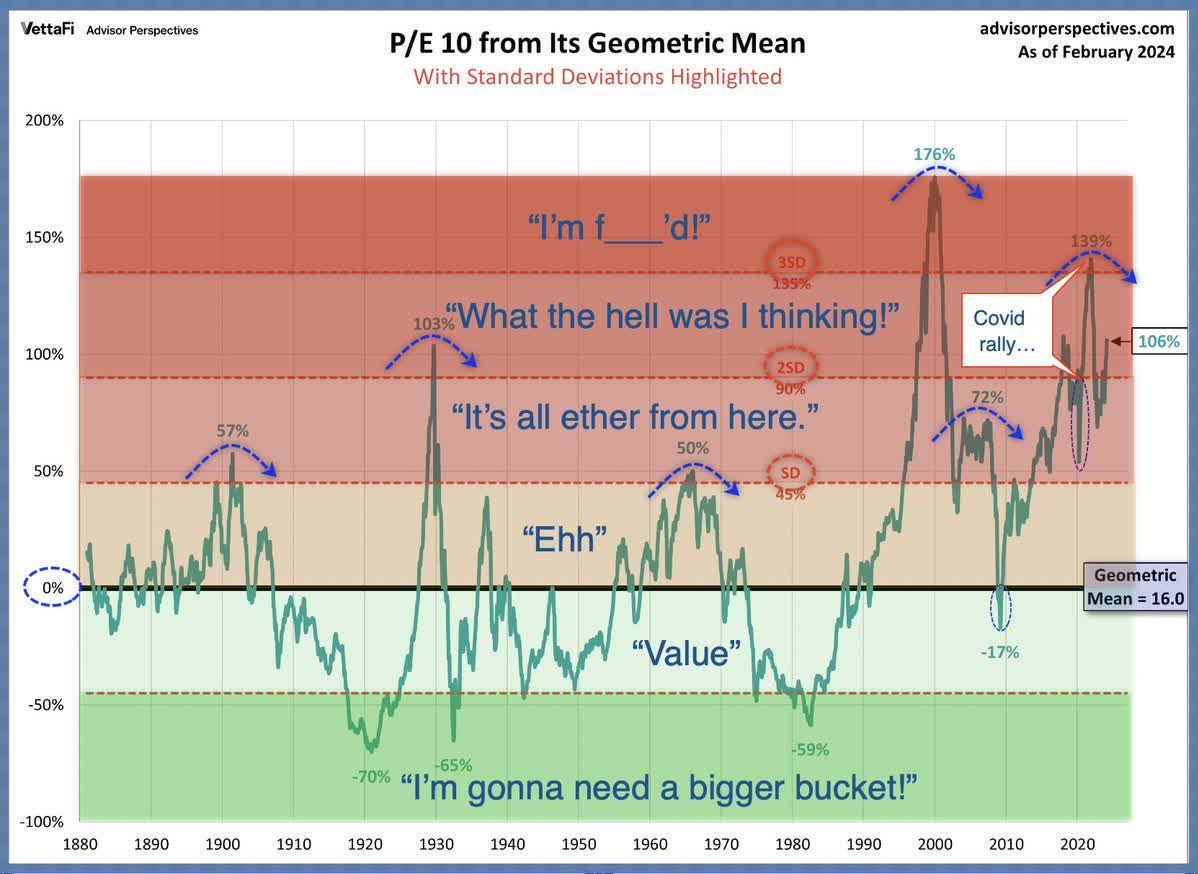
Meanwhile, history suggests that a profit recession and bear market are still real possibilities. Profit recessions and bear markets usually occur when the Fed tightens. Only three times have they been avoided after a tightening cycle – once each in the 60s, 80s, and 1990s. Importantly, the yield curve did not invert during those three tightening cycles. The yield curve has inverted during the most recent tightening cycle. The 2/10-yield curve inverted in July 2022. It remains inverted, one of the longest periods ever. Also, stocks entered the three soft-landing tightening cycles at below-average valuations. That is not the case now. The smoothed 10-year price-to-earnings ratio for US stocks (S&P 500 below since 1880) was the second-most overpriced level in the last 144 years, according to Danielle Park, CFA.
The stock market is expensive. Returns from current levels are likely to disappoint.
Uncertainty is higher than normal. Norwood Economics expects higher volatility the rest of the year as a result.
Economic Indicators
Housing starts and building permits rose in February. Housing starts came to 1.52 million, so did the number of building permits. The median forecast was for 1.43 million housing starts and 1.49 million building permits. Building permits are a leading indicator. Also, existing home sales rose to 4.38 million in February from 4.0 million the prior month. The housing market is the most interest rate sensitive sector of the economy. It is showing signs of life. Other interest rate sensitive sectors of the economy may strengthen as well.
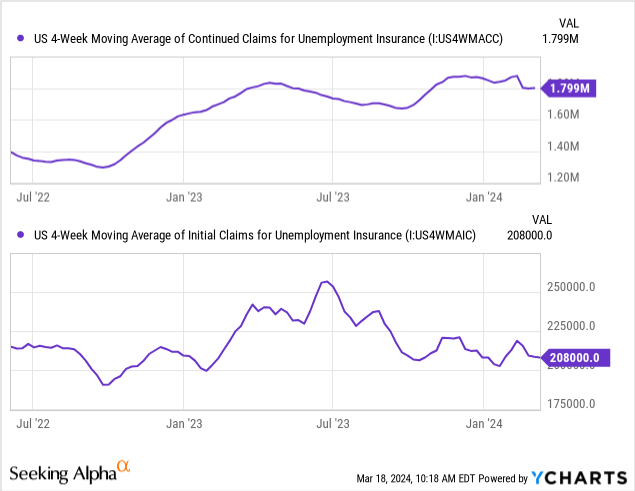
Initial jobless claims were 210,000 last week, down from 212,000 the week prior. The jobs market may be fraying around the edges, but it is still strong. The S&P flash U.S. services PMI in March was 51.7. The manufacturing PMI was 52.5. Any number over 50 indicates expansion.
The economic data is improving not weakening. Monetary policy’s long and variable lead times may still sink the economy. For now though there is scant evidence of it doing so.
Target Dated Funds
Barron’s had an article about target dated funds in this week’s edition. It is prompting me to pass along how I explain target date funds to 401k plan participants. Target date funds are diversified portfolios. Most folks don’t know how to build a diversified portfolio, or they choose not to do so. Diversified portfolios are more likely to earn your targeted return. Everyone aside from expert investors (of which there are few) should maintain a diversified portfolio.
Target date funds also adjust the risk level as investors move closer to retirement. The portfolio managers lower the allocation to stocks and increase the allocation to bonds. A good feature since many people don’t adjust risk as they near and then enter retirement.
Not all target date funds are the same though. Some target date funds manage risk to retirement. Other target date funds manage risk through retirement to end of plan (deceased). The two approaches result in different allocations. Some fund families have as little as 20% in stocks at the target date. Other fund families have as much as 56% allocated to stocks at the target date.
Target date funds are a one-factor model, a limitation. Other factors may call for adjusting your portfolio. Two 60-year-olds wishing to retire at 65 will have the same target date fund based on the same retirement date. But what if one of the participants has $2 million banked already while the other has only $200,000? Two different portfolios are needed. The amount saved is a second factor. The second individual needs to play catch up. The first individual may be able to take less risk given $2 million already accumulated.
A third factor is liquidity needs. The timing of major spending goals matters. Two individuals with the same amount saved might have different liquidity needs. We now have three factors to consider. And there are other factors that might need to be considered as well.
Target date funds are a boon to investors. They take away the need to build your own diversified portfolio. They take away the need to adjust risk as you get closer to retirement. But there are other factors that may impact your choice of target date funds. The “through” and “to” distinction needs to be accounted for. Factors other than retirement date matter.
We believe most plan participants should use a target date fund. Diversified portfolios with the right mix of stocks and bonds makes a successful retirement more likely. Non-diversified portfolios with an overly aggressive mix of assets makes a successful retirement less likely.
Regards,
Christopher R Norwood, CFA
Chief Market Strategist


