

It's a Momentum Market but,
Bullish Sentiment is Hitting Extremes

5-year S&P chart
Market Update
The S&P 500 rose 0.4% in a holiday-shortened week. The index finished the week at 5,254.35. There was a small sell-off in the last hour of trading on Tuesday. There wasn’t any news surrounding the half-point drop into the close. Wednesday saw a near-mirror image move to the upside in the last hour of trading. Wall Street lore has it that smart money trades in the last hour. It appears the smart money was of two minds or had a change of heart in the 24-hour period between closes.
The smart money bought into the close Wednesday even as Fed Governor Waller prepared to give a “hawkish” speech at the Economic Club of New York that evening. Waller said high inflation readings and strong job gains in early 2024 reinforce his view that ‘there is no rush” to cut U.S. interest rates. In fact, the speech was titled, “There’s Still No Rush”, leaving no doubt where Waller stands on the issue. Higher for longer interest rates is viewed as bearish by stock investors. Waller’s speech shouldn’t have seen a front running move higher on Wednesday afternoon by the smart money. If anything, one would have expected a sell-off into the close on a leaked manuscript.
And it’s probable that Waller’s speech had nothing to do with Wednesday’s surge into the close. The most likely explanation for both Tuesday’s abrupt sell-off and Wednesday’s last hour rally was provided by Art Hogan, chief market strategist for B. Riley Wealth. “So, it really feels like a quarter-end rebalance and certainly more enthusiasm for equities, in what otherwise would be a quiet week, if not for the end of the quarter,” Hogan said on Friday.
Not smart money making insightful investments based on fundamentals at all then. Quarter-end rebalancing by pension plans and mutual funds instead. Algorithms and portfolio managers reallocating because of a date on the calendar. Last week’s trading likely had nothing to do with fundamentals at all. It was short-term noise.
There is fundamental news to ponder.
“The relevant news is that recent inflation data are rising briskly,” wrote Michael Lewis in a client note Friday. Lewis heads Free Market Inc. Advisory. The three-month core PCE trend has rebounded to 3.5% annual growth, from under 2.5% in late 2023, he points out. Also, Vanguard Group is out with data showing that hiring has picked up recently. Vanguard’s proprietary indicator uses enrollment data from its 401(k) plan clients. Vanguard also pointed out that high-income workers are finding new jobs quickly.
The Atlanta Fed’s GDPNow tool is estimating first-quarter GDP growth of 2.3%. GDP grew 2.5% in 2023 after growing 1.9% in 2022. The Fed is forecasting growth of 2.1% in 2024. Inflation is well above target. The economy is showing no signs of weakening. And there is a growing split among Fed officials about when to cut rates and by how much. A slight majority favor at least three rate cuts in 2024 while the rest prefer two or fewer.
Yet the stock market keeps rising. The index has hit 22 record closes year to date, the most in a first quarter since 1998, according to Barron’s. The S&P 500 is up 10.2% for the first three months of 2024. That’s the fourth time since 2000 that it has gained 8% or more in the first three months of the year. The other years were 2012, 2013, and 2019, when it rose 12%, 10%, and 13.1%, respectively.
The S&P has risen 8% or more in the first quarter 16 times since 1950. The index lost ground the rest of the year only once, in 1987. The other 15 times the S&P gained an average of 9.7% during the following three quarters, according to Barron’s. The weekly magazine wrote that “going back roughly three-quarters of a century, if the S&P 500 climbs 8% or more in the first quarter, there’s a nearly 94% chance of more gains.”
That’s a nonsensical statement. It is true that the index did add to its gains 15 out of 16 times after gaining 8% or more in the first quarter since 1950. That does not mean the odds are 94% for gains in the future. Data mining is a danger. Just because something happened in the past doesn’t mean it will continue to happen in the future. The economy and capital markets are complex systems with many feedback loops. A Super Bowl win for an original NFL team doesn’t have any ability to forecast the direction of the stock market the following year.
The Super Bowl indicator was 100% accurate through 1978. The Super Bowl indicator has a 72% accuracy rate through 2023 but has been only 30% accurate in the last 20 years. Of course, the Super Bowl indicator is no indicator at all. It is the law of small numbers in action.
The law of large numbers is a mathematical theorem. It states that the average of a result obtained from many independent and identical random samples converges to the true value. The law of small numbers refers to a cognitive bias. It leads people to believe that true values can be drawn from a small sample size. Sixteen samples would most definitely qualify as a small sample size. And then there is the fact that the sixteen samples aren’t “independent and identical samples”. The odds of the market finishing above its Q1 close by year-end 2024 is unknowable.
That said, momentum exists in markets. The current stock market is a momentum market. Momentum might prevail during the rest of 2024. Yet there are many factors that drive markets in the short term besides momentum. Sentiment is one such factor.
In fact, it is more likely that the U.S. stock market is down a year from now instead of up. Why? The stock market is overbought, and market sentiment has hit extremes.
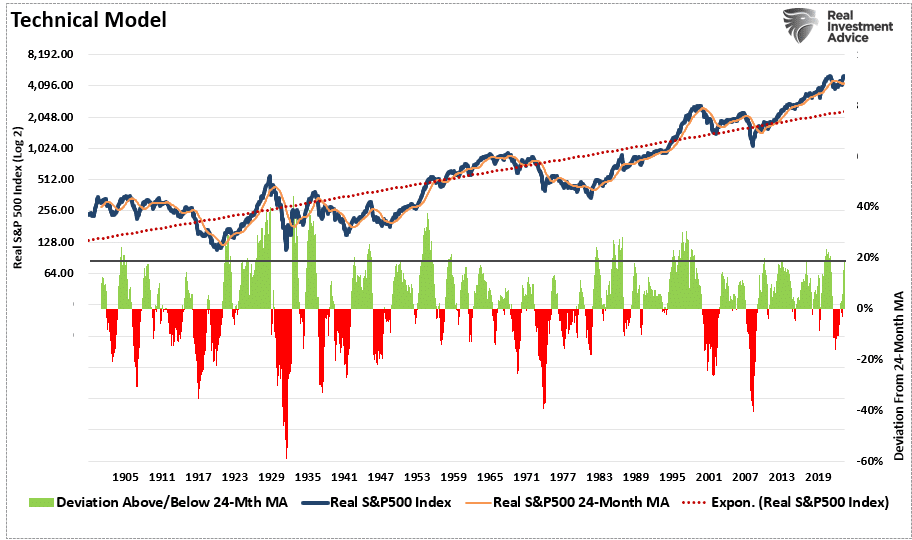
The deviation of the market from its underlying 2-year average is one of the largest in history, writes Lance Roberts, partner at RIA Advisors.
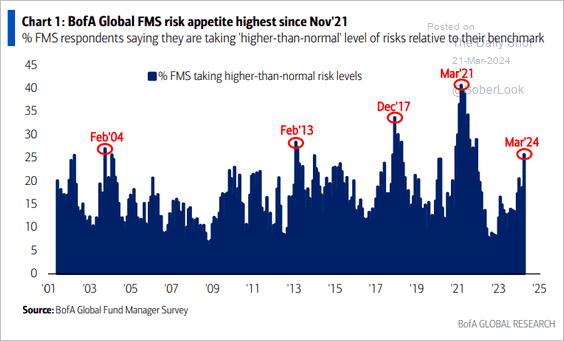
Fund managers are taking more risk as they chase performance.
History shows that money managers are usually heavily short at market bottoms, writes Michael James McDonald, a retired Morgan Stanly Senior VP of Investments. Likewise, they have low short positions at market tops.
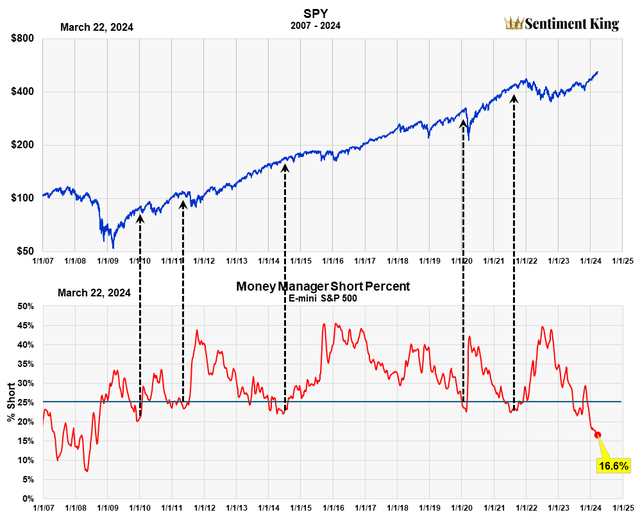
The ratio of shorts to longs rose to 45% in mid-2022, which is historically high. The stock market began its current bull market run in October 2022. McDonald writes that, sentiment hits bullish extremes anytime the ratio falls below 25%. See the black arrows in the chart above. Each occurred close to a top. None occurred prior to or in the middle of a bull market. He points out that the current ratio is 16.6%, the lowest since 2008.
Likewise, the AAII bear-to-bull ratio is hitting extremes.
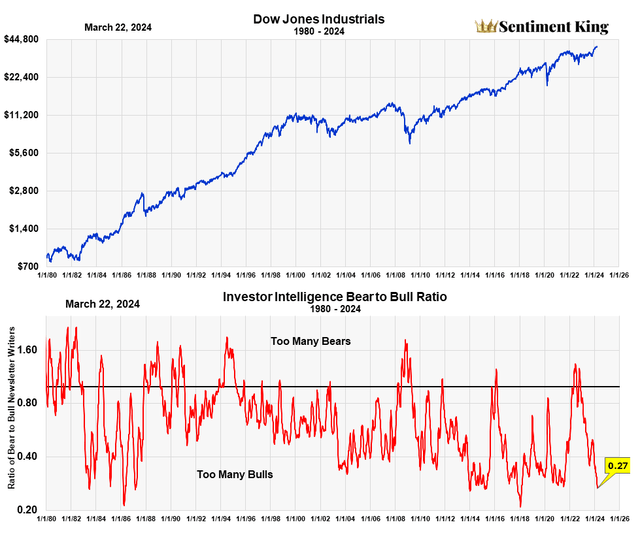
The Investment Intelligence survey dates to 1964. It is one of the oldest and most respected investment surveys of sentiment. Currently, there are almost four bullish newsletters for every bearish one. The bearish ratio is low. McDonald asks the question in his blog, “…with so many investors already bullish, who’s left to buy to drive prices higher?”
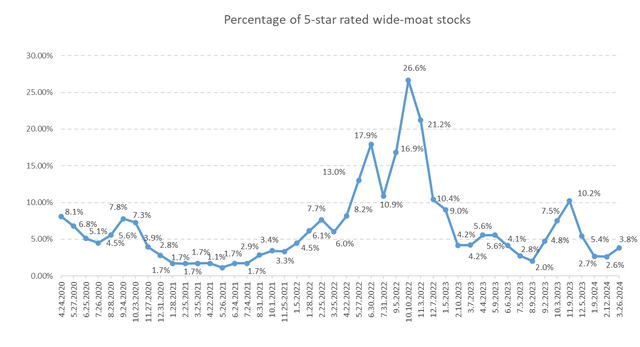
Morningstar rates stocks from one to five stars based on valuation. A one-star stock is most overvalued. A five-star stock is most undervalued. Morningstar also awards wide, narrow, and no moat ratings to businesses it follows. Businesses with a moat earn more than their cost of capital. It's called earning an economic profit. Earning an economic profit isn't supposed to happen in capitalism. Excess profits are supposedly competed away. Economic profits result when a business has a sustainable competitive advantage. The competitive advantage prevents excess profits from being competed away. Warren Buffet popularized the concept of moats.
The percentage of five-star wide-moat stocks is a good sentiment indicator. A high percentage of wide-moat five-star stocks means investors are pessimistic. They are unwilling to buy quality companies even when they are on sale. A low percentage of wide-moat five-star stocks means investors are optimistic. They are willing to pay more for quality companies than they are worth. Currently, only 3.8% of wide-moat stocks earn five stars from Morningstar.
The S&P 500 is overbought. Sentiment is too bullish. The stock market is likely to be lower one year from now as a result. Buy stocks not the market. There are good companies on sale. The challenge is finding them.
Economic Indicators
Economic news last week showed strength. New home sales of 662,000 in February almost matched the 664,000 sales the prior month. Home prices rose 6.6% in January against a 6.1% increase the prior month. The housing market continues to show signs of life. The consumer confidence report was 104.7 in March versus 104.8 the prior month. Initial jobless claims remained low at 210,000, down from 212,000 the prior week. Meanwhile, Q4 GDP was revised to 3.4%, above the forecast 3.2%. The economy continues to surprise to the upside.
Inflation is no longer falling. The Personal Consumption Expenditure Index (PCE) has risen since the end of 2023. The annualized rate of core inflation in the past six months rose to 2.9%, up from 2.6% in January and 1.9% in December. Hard to see the Fed cutting with the economy strong and inflation still percolating.
The payrolls number is the big report this week. The forecast is for 200,000 jobs added in March, down from 275,000 last month. Two hundred thousand jobs is still a strong number. Unemployment is expected to fall to 3.8% from 3.9%. That’s near a 50-year low. U.S. hourly wages are forecast to increase by 0.3%, down from 0.4% in February. Hourly wage growth year-over-year is forecast to be 4.1%, still too high for a 2% inflation target.
The economy remains strong, and inflation remains a problem. It will likely take a recession to hit the Fed’s 2% inflation target.
Medicare or Medicare Advantage?
Healthcare costs in retirement are a major expense. An individual age 65 in 2023 will need to have saved approximately $157,000 to cover health care costs in retirement, according to Fidelity. People can choose between traditional Medicare and Medicare Advantage.
The latter is private insurance. It is offered by large health insurers such as United Health Group and Humana. The insurers are reimbursed by the federal government. The government pays the insurers a fixed amount per member. They make a profit if their costs are less than the reimbursements. The model incentivizes insurance companies to restrict access to healthcare.
More than half of Medicare recipients get their benefits through Advantage plans, according to Barron’s. Humana CEO Bruce Broussard told analysts in January that the whole industry will “possibly reprice” next year. He said that the Advantage sector is navigating “unprecedented increases in medical cost trends.” Consumers are getting caught in a growing battle, wrote Barron's. The government, healthcare providers, and insurers are increasingly at odds.
I’m no expert in Medicare and Medicare Advantage but a few things stood out to me. First, switching to traditional Medicare may not be an option later. The only time you’re guaranteed the right to purchase Medigap insurance (to cover out-of-pocket costs) is when you first enroll. Otherwise, insurers can charge more or deny coverage for pre-existing conditions. So, your initial election may mean you’re stuck with Medicare Advantage once chosen. Second, Medicare Advantage plans require pre-approval for many procedures, unlike traditional Medicare. Again, insurance companies are incentivized to restrict access to healthcare. It's how they make a profit from the government's fixed payments. Third, many Advantage plans are HMOs with limited in-network service providers. Out-of-network services aren't covered, limiting a person’s choices, or increasing costs.
Paying more up front for traditional Medicare is a better choice for many. Choosing Medicare Advantage to save on premiums is betting on your health in retirement. You may be healthy at 65 but have serious health problems in your 80s and 90s. Choosing traditional Medicare limits the risk of high out-of-pocket costs should you encounter serious health issues later in life. Switching to Medicare Advantage after your health deteriorates may not be possible. Pre-existing conditions may make the price too high for many.
Ultimately it comes down to how much risk you’re willing to take on for healthcare costs in retirement. I plan on enrolling in traditional Medicare when I turn 65.
Regards,
Christopher R Norwood, CFA
Chief Market Strategist


