

Payroll Report Stronger Than Expected
Future’s Market Uncertain About 3 Cuts in 2024
Higher Interest Rates Will Cause Problems for the Economy, but when?
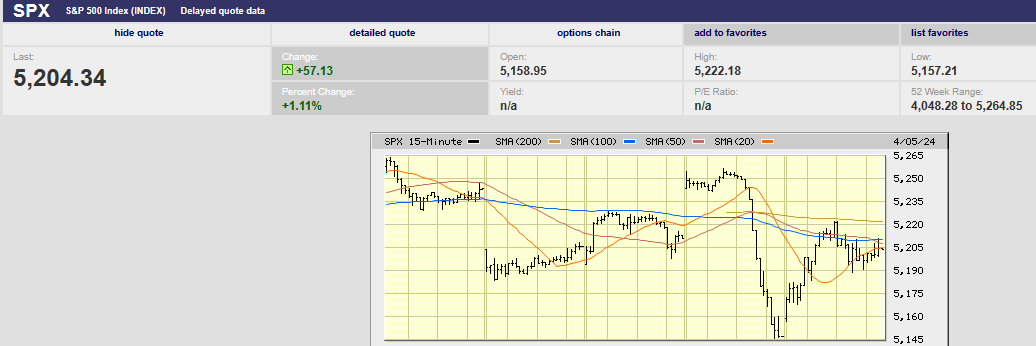
5-day S&P chart
Market Update
The S&P 500 fell 0.95% last week, ending up Friday at 5,204.34. The two-year Treasury yield rose to 4.79%. The 10-year Treasury yield rose to 4.41%. Long-term rates moved higher in response to stronger-than-expected economic news. The 10-year Treasury yield is at its highest since late November. The 10-year yield has risen 0.5% since early February.
Nonfarm payrolls were stronger than expected last month. The forecast was for 200,000 new jobs. The number came in at 303,000. The unemployment rate fell to 3.8% from 3.9%. Unemployment is near 50-year lows. Hourly wages rose 0.3% in March, up from 0.1% the prior month. Hourly wages year over year rose 4.1%. That was down from 4.3% the prior month. The workweek rose one-tenth of an hour to 34.4 hours. A longer workweek points to economic strength.
Some economists see weakness in the rising part-time employment numbers. Michael Reid of RBC Capital disagrees. There’s nothing wrong with that, if it’s for the right reason, he wrote in a recent note to clients. "The number of part-timers who prefer part-time work outnumber those forced to take part-time work for economic reasons by a factor of five," Reid wrote in his note.
The March jobs report doesn’t help the Fed’s case for rate cuts. Nor does the latest reading from the Atlanta Fed’s GDPNow tracker. It is forecasting 2.5% GDP growth in the first quarter. Strong GDP growth plus full employment means no Fed rate cuts anytime soon if the Fed is data-dependent. Rate cuts aren’t warranted because the economy isn't showing any signs of slowing down. Rate cuts also aren't warranted because inflation is running above the Fed's 2% target. Minneapolis Fed President Neel Kashkari said as much on Thursday. He suggested that no rate cuts might be needed this year. Kashkari’s comments were the reason for Thursday's sell-off according to Barron's. The magazine also blamed rising tension in the Middle East for Thursday’s sell-off (in a different article). Readers get to pick which reason they find more compelling apparently.
It isn’t only the employment picture that is signaling economic strength. The ISM manufacturing index indicated expansion for the first time since October 2022. The index rose to 50.3% in March from 47.8% the prior month. The move into expansion territory caught economists by surprise. The consensus forecast was for a continued contraction in the manufacturing economy. Instead, the manufacturing report showed increased production. It also showed rising new orders. Less welcome was evidence of increasing inflationary pressures, according to ING Financial. “Markets interpreted that as reducing the chances of meaningful Fed rate cuts,” ING Financial wrote in a client note.
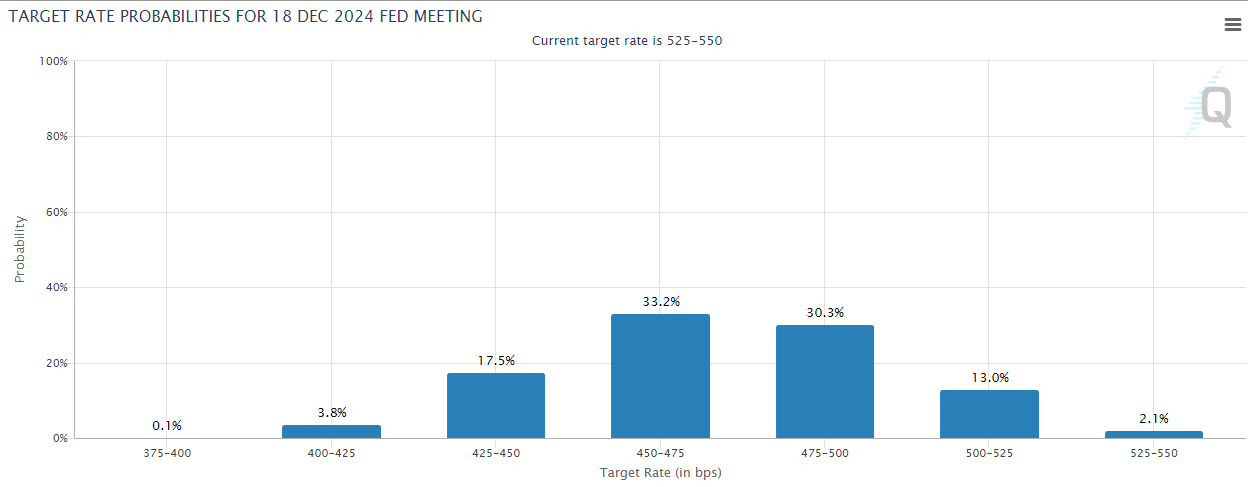
The CME FedWatch Tool is less certain about three rate cuts in 2024. There is a 95.2% chance the Fed will make no move in its May meeting. The futures market is still indicating three rate cuts for 2024 as most likely. But it is pricing in a greater chance of two or fewer cuts. There is a 33.2% chance of three one-quarter point cuts by year-end. There is a 30.3% chance of two cuts in 2024. The probability of rates being at 4.75% (two cuts) or higher is 45.4%.
The Fed claims data dependence. The economic data is signaling strength with no need to cut. The inflation data is starting to turn against the Fed as well.
The S&P Global PMI survey is signaling rising inflationary pressures. Average prices charged for goods and services rose globally at the fastest rate in ten months in March, according to Markit. Service sector pricing pressure remained the main problem area. The service sector reported the steepest price rise in eight months globally in March. Upward price pressures were primarily linked to increased labour costs and were most evident in the UK and US.
Inflation expectations are key to controlling inflation. It’s why the Fed focuses on “anchoring” inflation expectations. Inflation expectations are important because expectations of higher inflation become a self-fulfilling prophecy. People react to rising inflation expectations by asking for bigger raises. Businesses react to rising inflation expectations by raising prices. Currently, inflation expectations are rising.

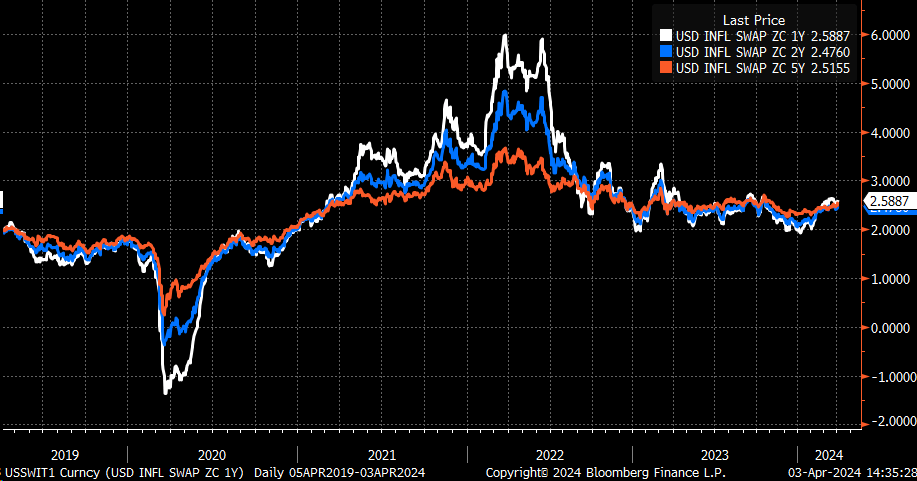
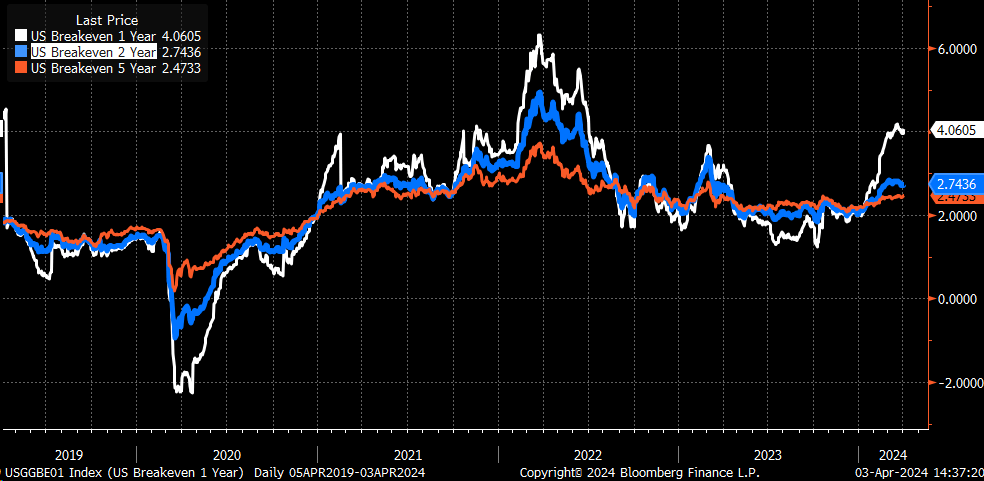
1-,2-, and 5-year inflation swaps have all been trending higher in recent months as well. It isn’t a well-established trend yet but it is enough to raise a warning flag.
1 year chart
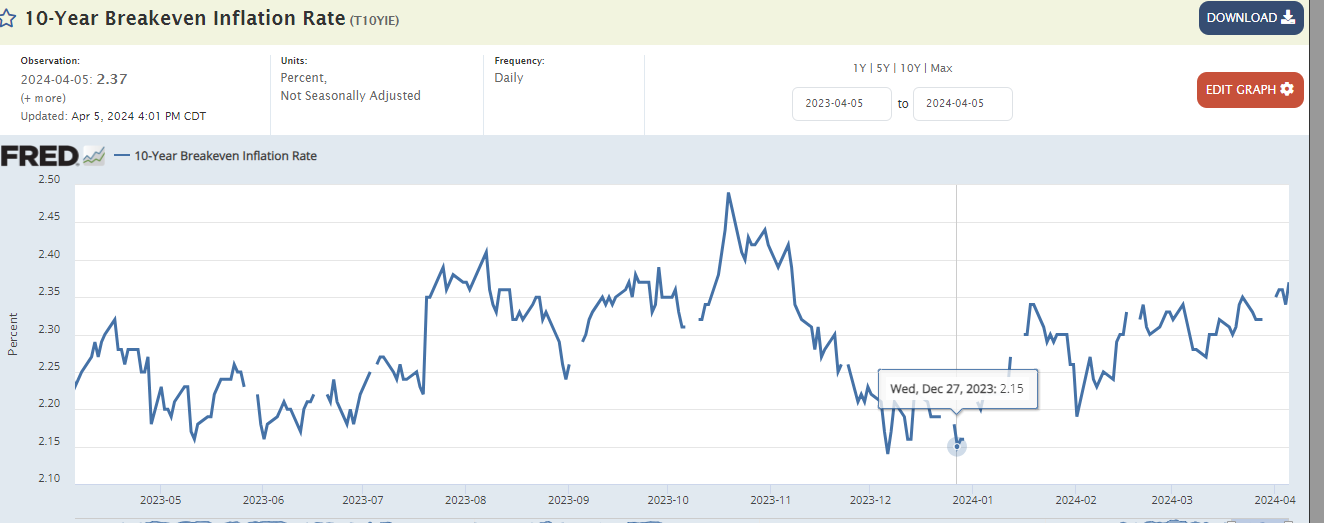
Shorter breakeven periods are starting to raise concerns as well. The 1-year and 2-year breakevens haven’t been this high since early 2023. Fed Chair Powell is claiming that financial conditions are tight. Goldman and Bloomberg both disagree based on their proprietary financial condition’s indexes. Common sense would indicate loose financial conditions as well. It's logical to expect the market to price in lower, not higher, inflation expectations if financial conditions are tight.
1 year chart
Rising inflation expectations can become self-fulfilling. A data-dependent Fed is playing with fire if it chooses to cut rates in the face of strong economic data and sticky inflation.
But why might the Fed cut rates even though unwarranted based on the data? There are many reasons including interest cost and protecting the banking system.
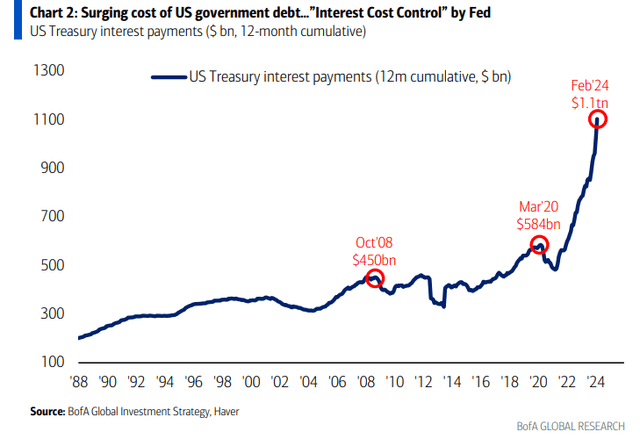
The U.S. national debt exceeds $34 trillion. The interest cost is skyrocketing with higher interest rates.
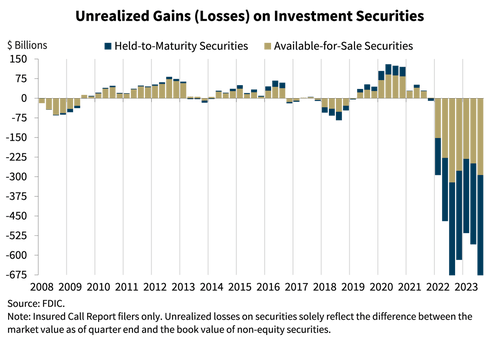
Losses at U.S. Banks due to rising interest rates are large and growing. Losses on bonds and potential losses on commercial real estate (CRE) loans threaten bank balance sheets. Goldman Sachs estimates $1.2 trillion in CRE loans will mature between now and the end of next year. Many borrowers will likely default if forced to refinance at current high rates. A wave of CRE defaults could trigger a credit crunch and banking crisis.
The Fed may decide to cut to help the government fund the debt. It may also be anxious to begin cutting to head off another banking crisis. Then there is the fear of causing a recession by keeping rates high too long. The Fed knows that rate hikes work with long and variable lags. It knows that data won't give them a timely enough warning to avoid a recession. It knows its claim of data dependence is a sham. All of which means the Fed might cut without any data to support cuts. It can't very well admit that it is conducting monetary policy by the "seat-of-its-pants" can it?
Economic Indicators
The jobs report was the big one last week. The economy added 303,000 jobs, well above the forecast of 200,000. The unemployment rate fell to 3.8%. Weekly initial jobless claims did rise to 221,000 but that is still a strong number as well.
The big report this week is the Consumer Price Index. Core CPI is forecast to rise 0.3% with year-over-year core at 3.7%. Neither number gives the Fed room to cut. A hotter-than-expected report could push long-term rates higher. It could also cause bond investors to reduce their rate cut expectations for 2024. Neither development would be helpful for the stock market.
Investing in a Crowded Bond Trade
Bonds have been a terrible investment for years. The Fed’s zero interest rate policy (ZIRP), begun in 2008, meant low coupons and little protection from falling bond prices. The iShares Core U.S. Aggregate Bond ETF lost 1.77% in 2021, 13.02% in 2022 and is down 1.72% year-to-date. A $10,000 investment a decade ago is worth $11,680 today. That’s a total return of 16.8%, or just 1.68% per year. Making matters worse, the correlation with stocks rose to 0.70 over the last three years. That's up from 0.35 over the last decade. Intermediate Treasury bond correlation is only 0.07 over the last decade. But the correlation between Treasuries and the S&P 500 rose to 0.59 in the last three years. A major reason to own bonds is diversification. Higher correlations with stocks make bonds less effective at reducing portfolio risk.
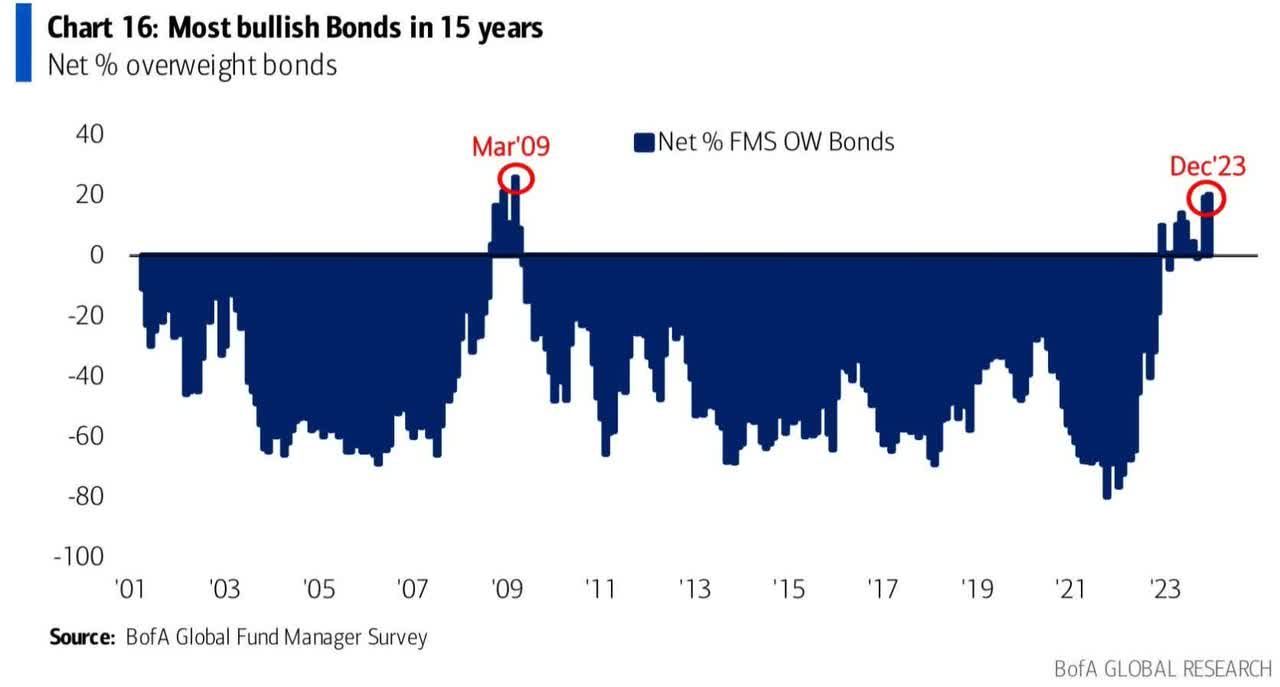
Investors are bullish on bonds now. The Fed’s rate hikes since March of 2022 make yields more attractive than they’ve been in more than 15 years. The 10-year Treasury bond is yielding 4.41%. The 30-year Treasury is yielding 4.55%. The real yield (nominal minus inflation) is around 2%, attractive to investors. Norwood Economics sold much of its bond exposure in 2020, avoiding the worst of the bond route since then. We began buying short-term Treasuries in early 2023. We’ve been considering adding intermediate and long-term bonds back into the investment mix as well. One concern is holding us back. Almost everyone loves bonds. Sentiment is over-the-top bullish. We wonder who is left to buy.
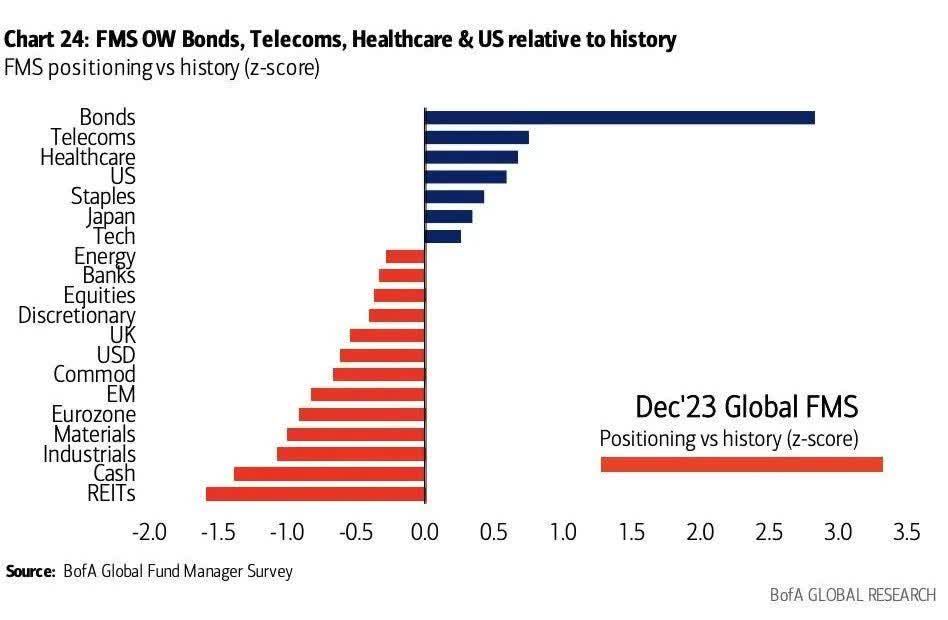
There is a bullish consensus among mutual fund managers. They are overweight bonds. In fact, they are as bullish on bonds as they’ve been since 2009, according to BofA’s Global Fund Manager Survey.
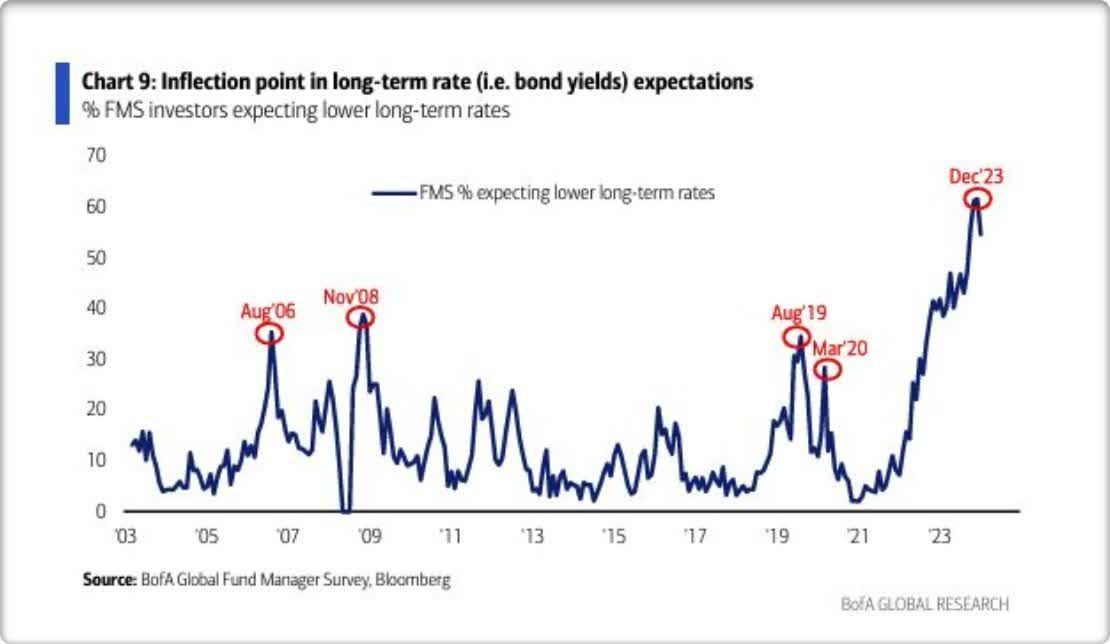
The mutual fund manager’s consensus is for interest rates to move lower not higher, although the consensus may have peaked.
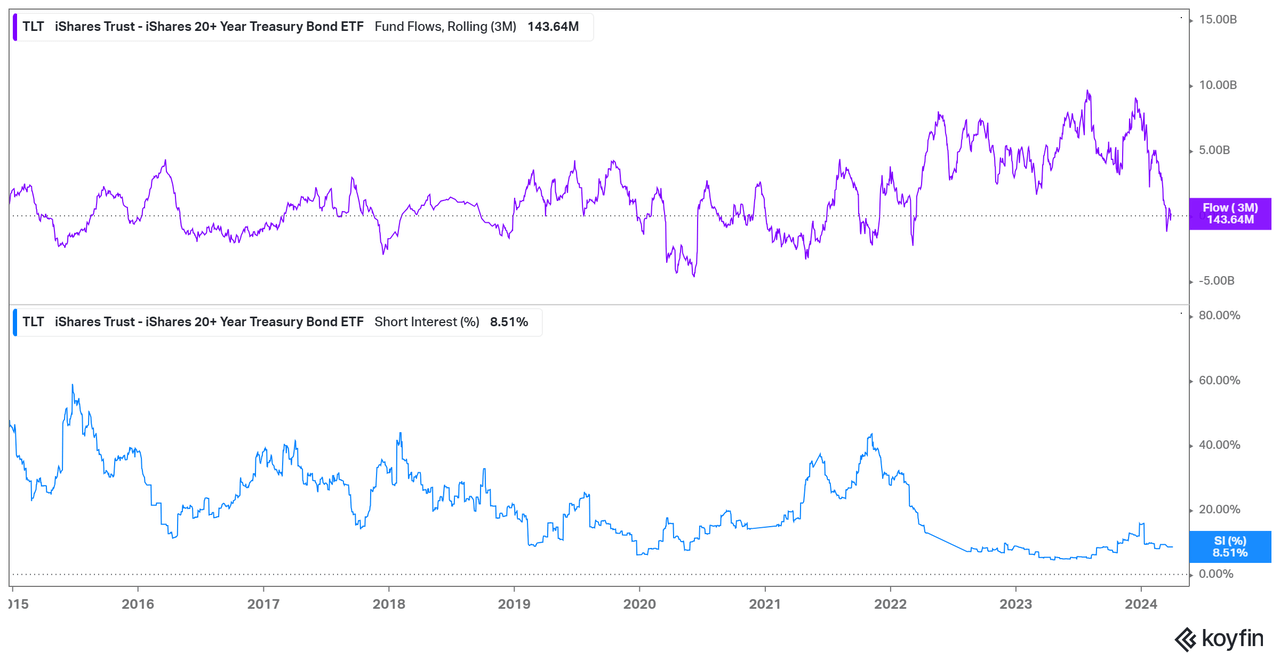
The iShares 20+ Year Treasury Bond ETF (TLT) fund flows have fallen back to more neutral levels. But short interest remains close to decade lows. It is near levels seen at cyclical tops in bonds, not bottoms.
The economy is strong. Inflation is showing signs of unexpected stickiness. Bond investors are loading up on longer-term bonds in anticipation of falling rates. Eventually, the economy will slow, the Fed will cut, and rates will decline. But it is increasingly likely that the Fed will not cut in 2024. It's also increasingly likely that long-term rates will continue to move higher this year. A scenario in which a strong economy keeps the Fed on hold into 2025 is no longer out of the question. Nor is the possibility of the Fed indicating that rate hikes are back on the table. Should that scenario come to pass we would expect bonds to struggle and stocks along with them. It isn’t Norwood Economics' base case, but it is a growing possibility.
Regards,
Christopher R Norwood, CFA
Chief Market Strategist


